


Sugary drinks, defined as beverages with added sugars (e.g. sugar-sweetened beverages (SSB), a subset of sugary drinks) and beverages with natural intrinsic sugars (e.g.100 % juice), are associated with increased chronic disease risk in children and adults, including obesity, type 2 diabetes and CVD(1,2) . Excise taxation of sugary drinks, levied at the point of manufacturing or distribution, is well-established to reduce population-level intake and related health, economic and social costs(3). Evidence from real-world SSB taxation policies suggests that excise taxes result in higher prices, reduced sales and increased revenue for investment in public health priorities(Reference Krieger, Bleich and Scarmo4). A systematic review and meta-analysis of high-quality international studies found that excise SSB taxes had an average pass-through rate (defined as the proportion of the excise tax that is reflected in the retail price of the product) of 79 % (95 % CI: 60, 97) which increased the overall SSB prices and was associated with a corresponding 13 % (95 % CI: 6, 20) mean reduction in SSB sales (a price elasticity of demand of −1·39 (95 % CI: –1·86, –0·91))(Reference Andreyeva, Marple and Marinello5). Sugary drinks taxes are considered a WHO ‘best-buy’ intervention, recommended as part of a suite of population-level interventions to reduce sugar consumption, including financial (e.g. excise taxation, incentives), advertising, health beverage defaults and restricted availability(Reference Krieger, Bleich and Scarmo4).
Internationally, SSB taxes have been implemented in 105 jurisdictions, covering 51 % of the world’s population(Reference Hattersley and Mandeville6). The targeted beverages, tax rate and tax structure are important considerations for the development of sugary drink taxes. To date, existing sugary drink taxes have overwhelmingly targeted SSBs, omitting important sources of free sugar consumption from 100 % juice. Further, on average, implemented SSB tax rates have been 10 % or less(Reference Andreyeva, Marple and Marinello5), falling below the WHO-recommended 20 % flat excise tax(2). The structure of existing sugary drink taxation policies also varies, targeting the overall price of the product (e.g. flat rate), the amount of volume of beverage purchased or the concentration of sugar (e.g. tiered tax design) or other tax instruments that apply to a broad range of goods and services (e.g. import taxes or sale taxes)(Reference Backholer, Vandevijvere and Blake7), which can lead to heterogeneous effects of SSB taxation. Flat-rate tax structures aim to shift individual consumer behaviour away from sugary drinks. Tiered tax structures can additionally incentivize sugary drink reformation by manufacturers to reduce sugar content under tax thresholds, which can indirectly reduce sugar consumption through reduced sugar content of sugary drinks(Reference Popkin and Ng8). A recent global review of SSB taxes found that only 18 % (18 of 104) of SSB taxes worldwide apply a tiered tax structure(Reference Hattersley and Mandeville6). Tiered SSB taxes were predominantly identified in high-income countries, as they can be more burdensome to implement than flat-rate structures due to their contingency on sugar concentrations of each product(Reference Lee, Mozaffarian and Sy9).
In Canada, a national sugary drink tax has not been adopted, despite these beverages contributing 21 % (aged 9–18) and 17 % (aged 19+) of Canadians’ total sugar consumption(Reference Langlois, Garriguet and Gonzalez10,Reference Garriguet11) and a higher prevalence of consumption and mean energy intake from sugary drinks among individuals with low compared with high socio-economic position (SEP)(Reference Warren, Hobin and Manuel12). A recent Canadian study estimated that total free sugar consumption above 10 % of total energy intake, WHO’s benchmark for total free sugar intake, cost Canada’s healthcare system 2·5 billion CAD in 2019 from direct (1·1 billion CAD) and indirect (1·4 billion CAD) costs(Reference Liu, Munasinghe and Maximova13). Subnational SSB taxes exist in the Canadian provinces of Newfoundland and Labrador (a 20 cent/l sugary drink tax levied on manufacturers since September 2022(14)) and in British Columbia (where soda beverages are no longer exempt from the 7 % provincial sales tax applied to food products for human consumption as of April 2021(15)). The impact of these sugary drink taxes has not yet been evaluated; however, their introduction suggests sugary drink taxes are an acceptable policy option for reducing the health and economic burden associated with sugary drink consumption in Canada.
Additional evidence is required to inform the development of a national sugary drink tax in Canada. First, while tiered taxes have been implemented across jurisdictions, the potential impact of this taxation structure has not been examined in Canada. Second, natural and added sugars are indistinguishable through the metabolic process in humans(2); therefore, despite containing essential nutrients and possibly contributing to a healthy diet in moderation, it is important to consider 100 % juice in potential taxation scenarios which are often omitted from SSB taxes. Third, evidence regarding the extent to which SSB tax outcomes are heterogeneous across socio-demographic factors is limited(Reference Andreyeva, Marple and Marinello5), with evidence from a systematic review suggesting the tax would deliver similar if not greater benefits for individuals with lower SEP(Reference Backholer, Sarink and Beauchamp16). Studies modelling the potential impact of sugary drink taxes across SEP have focused on income (individual or ecological) as the sole indicator of SEP(Reference Kao, Jones and Ohinmaa17–Reference Briggs, Mytton and Kehlbacher19). It is important to understand the impact of such policies across additional indicators of SEP to fully reflect social pathways associated with consumption and health(Reference Braveman, Cubbin and Egerter20). Modelling studies are useful to estimate and compare the impact on consumption under multiple potential implementation scenarios(Reference Lee, Mozaffarian and Sy9). Our study objective was to estimate the impact of implementing 20 % flat-rate and separately, tiered sugary drink tax structures on the consumption of sugary drinks, SSB and 100 % juice across age, sex and SEP in Canada using the most recent population representative dietary intake data available in Canada.
Methods
Data source
We conducted a modelling study using data from the 2015 Canadian Community Health Survey-Nutrition (CCHS-N)(21). The cross-sectional CCHS-N is the most recent nationally representative assessment of Canadians’ dietary intake since 2004. The CCHS-N, administered by Statistics Canada, used interviewer-administered 24-h dietary recalls adapted from the Automated Multi-Pass Method from the United States Department of Agriculture(22). A multi-stage, cluster sampling approach was used to secure a sample of 20 487 Canadians aged 1 and older living in private dwellings across the 10 provinces (61 % response rate)(21).
We included single-day 24-h dietary recalls among Canadians aged 2 and older (n 20 115). We excluded respondents if they were breast-feeding or reported no energy intake (n 200) or were missing information on income (n 22), education (n 41) or food security (n 110). The final analytic sample included 19 742 respondents.
Modelled interventions: flat-rate and tiered sugary drinks tax
Tax structures
We modelled two sugary drink taxation structures: (1) a 20 % flat-rate tax, the most commonly advocated tax by public health experts(3), and (2) a tiered tax that applied 10 % (2–4·9 g/100 ml), 20 % (5–7·9 g/100 ml) or 30 % (≥ 8 g/100 ml) tax based on the amount of sugar per volume. Tiers were defined based on the UK Sugar Drinks Industry Levy(Reference Pell, Mytton and Penney23), with tax levels matching a previous Canadian experimental study(Reference Acton and Hammond24) (tax assumptions and beverages list available in online supplementary material, Supplemental Table 1).
Beverage tax base options
We examined three potential beverage tax bases: sugary drinks (all beverages containing free sugars, which include both added and natural sugars), SSB (beverages containing added sugars only) and 100 % juice (beverages containing natural sugars only). Sugary drinks included both SSB and 100 % juice(Reference Warren, Hobin and Manuel12). Briefly, we estimated per-capita energy intake (kcal) on a given day from each beverage category by applying Health Canada’s sugary drinks definition(25) to Nutrition Survey System codes linked to Canadian Nutrient File descriptions (sugary drinks = 249 codes, SSB = 190 codes, 100 % juice = 59 codes). For each beverage category, we estimated their relative proportion of daily energy intake from all food and beverages consumed (%).
Model inputs – price to demand
We modelled the impact of price changes – for each tax scenario – on the demand for sugary drinks using price elasticities. Own-price elasticities (OPE) represent the responsiveness of demand for a product to a percentage change in the price of that product. Cross-price elasticities (CPE) represent the responsiveness of demand for one product to a percentage change in the price of another product. Price elasticities for sugary drinks were derived from a recent meta-analysis which estimated a –1·39 (95 % CI: –1·86, –0·91) OPE of SSB from high-quality studies and 0·42 (95 % CI: –0·52, 1·35) CPE for beverage substitutions (e.g. milk, diet beverages) at an average pass-through of taxation from manufacturer to consumer of 79 %(Reference Andreyeva, Marple and Marinello5). To estimate the impact of taxation by SEP, we applied the percentage change of income-specific price elasticities from a Canadian study(Reference Kao, Jones and Ohinmaa17), assuming that the OPE and CPE from the meta-analysis(Reference Andreyeva, Marple and Marinello5) represented the average of the middle-income quintile (Q3). Detailed methods for parameters are available in online supplementary material, Supplemental Table 2. Each CCHS-N respondent was assigned price elasticities for a 1 % increase in price for each beverage type based on the reported household income quintile(Reference Kao, Jones and Ohinmaa17).
Model inputs – demand to energy intake from sugary drinks
We modelled the impact of the demand on energy intake from sugary drinks by multiplying income-specific OPE and CPE by the modelled tax amount (e.g. 10, 20 or 30 %) for each respondent, beverage and tax scenario. Energy intake from taxed beverages and CPE-impacted beverages was estimated by taking the product of the expected demand change for each tax scenario and reporting energy intake from each beverage type. Energy estimates from all other food/beverage items were unchanged. For each respondent, we summed modelled energy intake for each beverage type and from all sources for each tax scenario.
Primary outcomes
Our primary outcomes were per-capita mean energy intake (kcal) and proportion of daily energy intake (%) – that is, the ratio of energy intake from taxed beverages to all food/beverage items – from sugary drinks, SSB and 100 % juice on a given day.
Exposures
We examined study outcomes across socio-demographic characteristics. We categorised sex as female or male and age into children/adolescents (aged 2–18) or adults (aged 19+). We categorised the highest level of household education into four groups: ‘less than high school’, ‘high school diploma’, ‘certificate below bachelor’s degree’ (e.g. a trade, college or non-bachelor certificate) or ‘bachelor degree or above’. Household food security status was assessed by eight questions for children/adolescents (aged 2–18) and ten for adults (aged 19+) with responses classified as either food secure (i.e. answered ‘yes’ to 0–1 questions about difficulty with income-related food access) or food insecure (i.e. answered ‘yes’ to two or more questions about compromised quality/quantity or reduced food intake due to disrupted eating patterns)(22). Household income adequacy quintiles were derived based on the adjusted ratio of the respondents’ total household income reported in the previous 12 months to the low-income cutoff corresponding to their household and community size(22).
Statistical analysis
We estimated means, mean differences and corresponding 95 % CI using ordinary linear regressions and the least-squared means procedure for per-capita mean energy intake and proportion of daily energy intake on a given day, for sugary drinks, SSBs and 100 % juice overall and across socio-demographic characteristics measured in the ‘no tax’ scenario (i.e. CCHS-N) and for each modelled taxation scenario. In addition, we used ordinary linear regressions to estimate the change in per-capita mean energy intake (change in kcal) and proportion of daily energy intake (change in percentage points) measured in the ‘no tax’ compared with each modelled taxation scenario across socio-demographic characteristics. All models were unadjusted to estimate actual intake in population-representative surveys(Reference Conroy and Murray26).
We derived 95 % uncertainty intervals (UI) using a probabilistic approach. We selected twenty OPE and twenty CPE values based on their probability distributions. For the per-capita mean energy intakes, we fit twenty regression models since the energy intake from sugary drinks is only affected by OPE but not CPE; while for the proportion of daily energy intake, we fit 400 regression models based on the 400 pairs of OPE-CPE values. Each model was bootstrapped (500 repetitions) following Statistics Canada procedures to account for the CCHS-N’s complex survey design(21). Survey sample weights were applied to all analyses to produce population-representative estimates(21). We applied Rubins’ Rules, designed for pooling repeated parameter estimates that are normally distributed from multiple imputations, to derive pooled estimates and uncertainty intervals from the regression models(Reference Enders27). We used the ‘miceadds’ R package to obtain the pooled estimates. Statistical analyses were conducted using R v4·3·1.
We explored several deterministic sensitivity analyses to assess the robustness of our findings. Specifically, we varied the following model inputs: (1) applied a consistent own price elasticity of –1·39 (95 % CI: –1·86, –0·91)(Reference Andreyeva, Marple and Marinello5) assuming similar price responses across income(Reference Briggs, Mytton and Kehlbacher19); (2) applied a smaller own price elasticity –1·00 (95 % CI: –1·47, –0·50) from an earlier systematic review and meta-analysis(Reference Teng, Jones and Mizdrak28); and (3) for both taxation scenarios, assumed 100 % pass-through rate from manufacturer to consumer.
Results
We estimated mean per-capita energy intake and proportion of daily energy intake from sugary drinks, on a given day, across socio-demographic characteristics measured in the CCHS-N (Table 1). Overall, Canadians consumed on average 127 kcal (95 % CI: 122, 132) from sugary drinks, which was 6·7 % (95 % CI: 6·4, 7·0) of daily energy intake. Mean per-capita energy intake and the proportion of daily energy intake from sugary drinks were 57 kcal (95 % CI: 46, 68) and 3·4 % (95 % CI: 2·8, 3·9) higher in Canadians aged 2–18 compared with 19+. Mean energy intake from sugary drinks was 47 kcal (95 % CI: 38, 56) higher in males compared with females. Sugary drink consumption on a given day was higher among individuals with a ‘high school diploma’ (18 kcal, 95 % CI: 4, 32) and ‘certificate below bachelor’s degree’ (17 kcal, 95 % CI: 4, 29) compared with ‘bachelor’s degree or above’, in food insecure compared with the food secure group (43 kcal, 95 % CI: 15, 70) and in the lowest compared with the highest income quintile (15 kcal, 95 % CI: –5, 35).
Table 1 Descriptive statistics and weighted mean per-capita energy intake from sugary drinks on a given day by socio-demographic characteristics, Canadian Community Health Survey-Nutrition (n 19 742)

‘Absolute energy intake (kcal)’ refers to the mean per-capita energy intake from sugary drinks on a given day. ‘Relative contribution (%)’ refers to the mean per-capita proportion of energy intake from sugary drinks relative to all food and beverages consumed on a given day.
We modelled the difference in sugary drinks, SSB and 100 % juice consumption from the ‘no tax’ scenario for both 20 % flat-rate tax and tiered tax scenarios (Fig. 1 and online supplementary material, Supplemental Tables 3 and 4). In the 20 % flat-rate tax scenario, we estimated that mean per-capita energy intake from sugary drinks would decrease 29 kcal (95 % UI: 18, 41) on a given day, a 1·3 % (95 % UI: 0·8, 1·8) reduction of daily energy intake from sugary drinks. In the tiered tax scenario, we estimated that mean energy intake from sugary drinks would decrease by 40 kcal (95 % UI: 24, 55) and 1·8 % (95 % UI: 1·1, 2·5) reduction of daily energy intake from sugary drinks. Similar trends were observed for reductions in energy intake and the proportion of daily energy intake for SSB and 100 % juice. Although SSB accounted for the majority of reduced energy intake from sugary drinks, including 100 % juice as part of each sugary drink tax scenario resulted in an additional 28 % reduction in mean energy intake from sugary drinks compared with an SSB-only tax in both 20 % flat-rate tax and tiered tax scenarios.
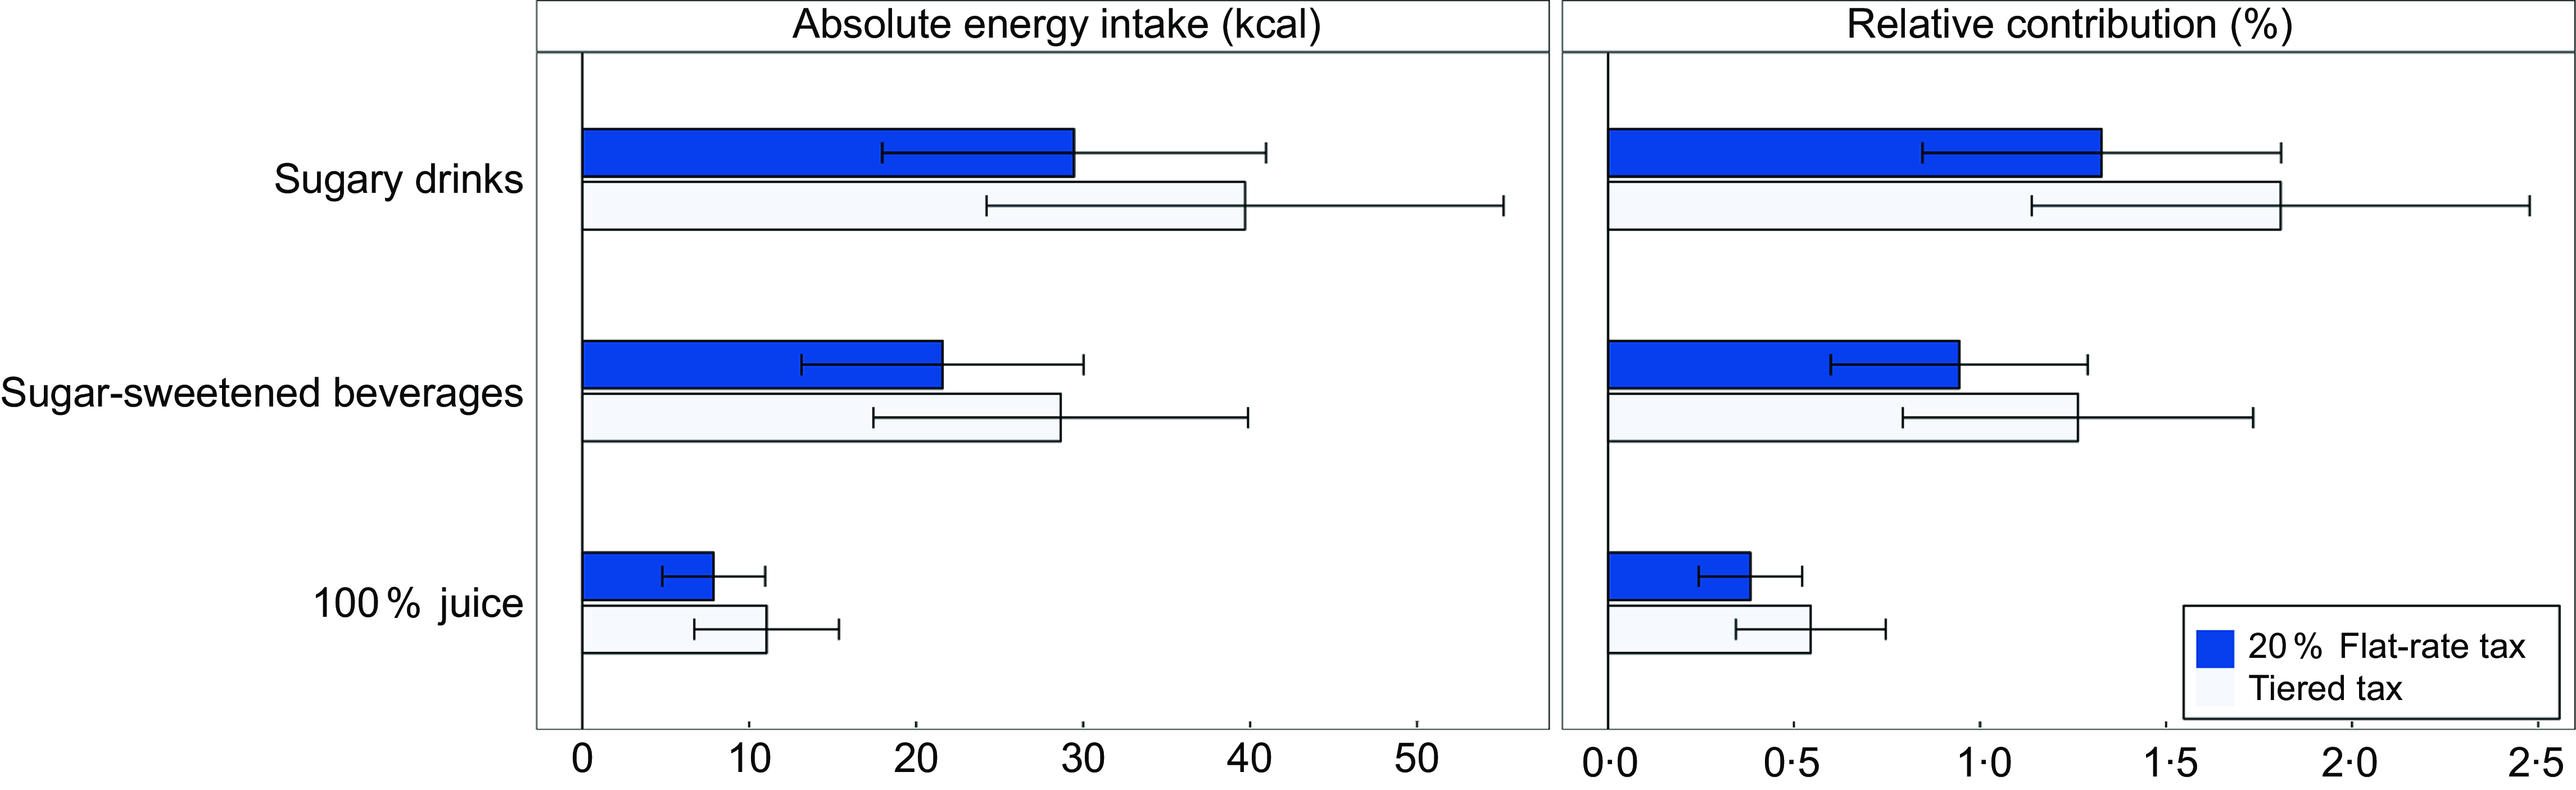
Fig. 1 Reduction in mean per-capita intake and proportion of daily energy intake from sugary drinks, sugar-sweetened beverages and 100% juice on a given day and 95% uncertainty intervals for each modelled taxation scenario, Canadian Community Health Survey-Nutrition (n 19 742).
We estimated the difference in sugary drink consumption across socio-demographic characteristics from baseline for each tax scenario on sugary drink consumption (Fig. 2 and online supplementary material, Supplemental Tables 3 and 4). Baseline inequities in energy intake and the proportion of daily energy intake from sugary drink consumption across age, sex and socio-economic indicators were reduced but not eliminated in each modelled taxation scenario, with additional small but meaningful reductions in the tiered tax scenario across subgroups.
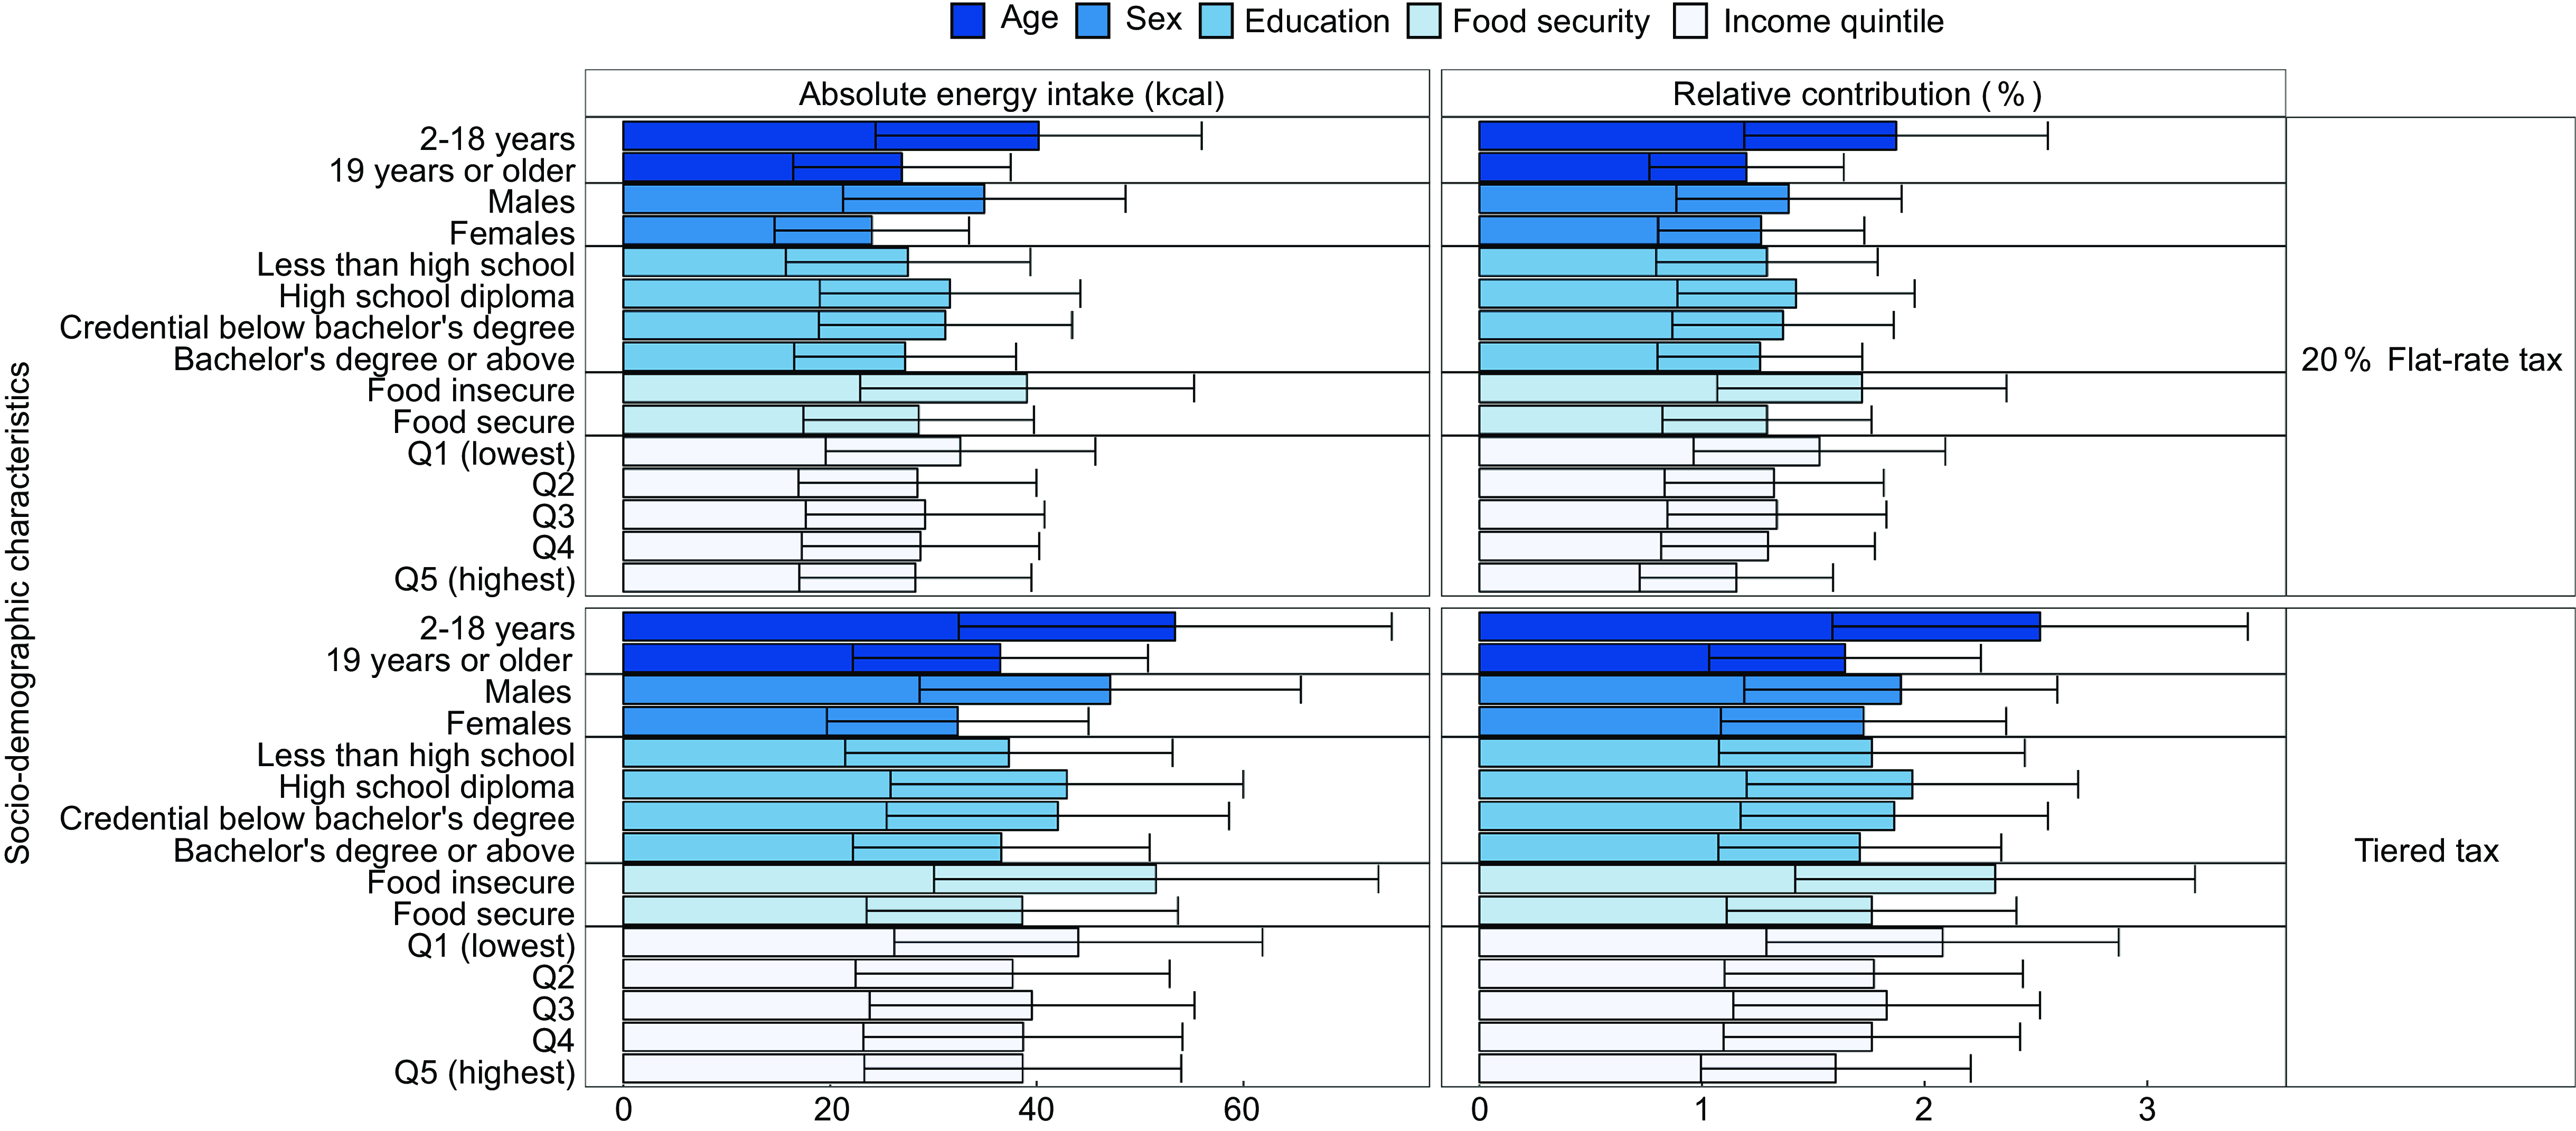
Fig. 2 Reduction in mean per-capita intake and proportion of daily energy intake from sugary drinks on a given day and 95% uncertainty intervals for each modelled taxation scenario by sociodemographic characteristics, Canadian Community Health Survey-Nutrition (n 19 742).
Further, for each modelled taxation scenario, we assessed whether reductions in sugary drink consumption were differential across socio-demographic characteristics (Table 2). Both tax structures reduced absolute energy intake from sugary drinks by a larger degree among individuals aged 2–19 compared with 19+ (20 % flat tax: –13 kcal, 95 % UI: –19, –8; tiered tax: –17 kcal, 95 % UI: –25, –9) males compared with females (20 % flat tax: –11 kcal, 95 % UI: –16, –6; tiered tax: –15 kcal, 95 % UI: –21, –8) and food insecure compared with secure (20 % flat tax: –10 kcal, 95 % UI: –18, –3; tiered tax: –13 kcal, 95 % UI: –23, 1), with smaller reductions across education and income quintiles. These trends were mirrored across the proportion of daily energy intake from sugary drinks, with additional reductions ranging between 0·1 and 0·9 %.
Table 2 Difference of reduction in per-capita energy intake and proportion of daily energy intake from sugary drinks between sociod-emographic groups for each modelled taxation scenario, Canadian Community Health Survey-Nutrition (n 19 742)

We assessed per-capita mean energy intake from sugary drinks targeted by each tier (tier 1 – lowest, tier 2, tier 3 – highest) in the tiered tax scenario by socio-demographic characteristics (Fig. 3). Across socio-demographic characteristics, groups who consumed more energy from sugary drinks overall consumed more energy from beverages with higher sugar concentration and were estimated to reduce energy intake by a larger scale under a tiered tax scenario.
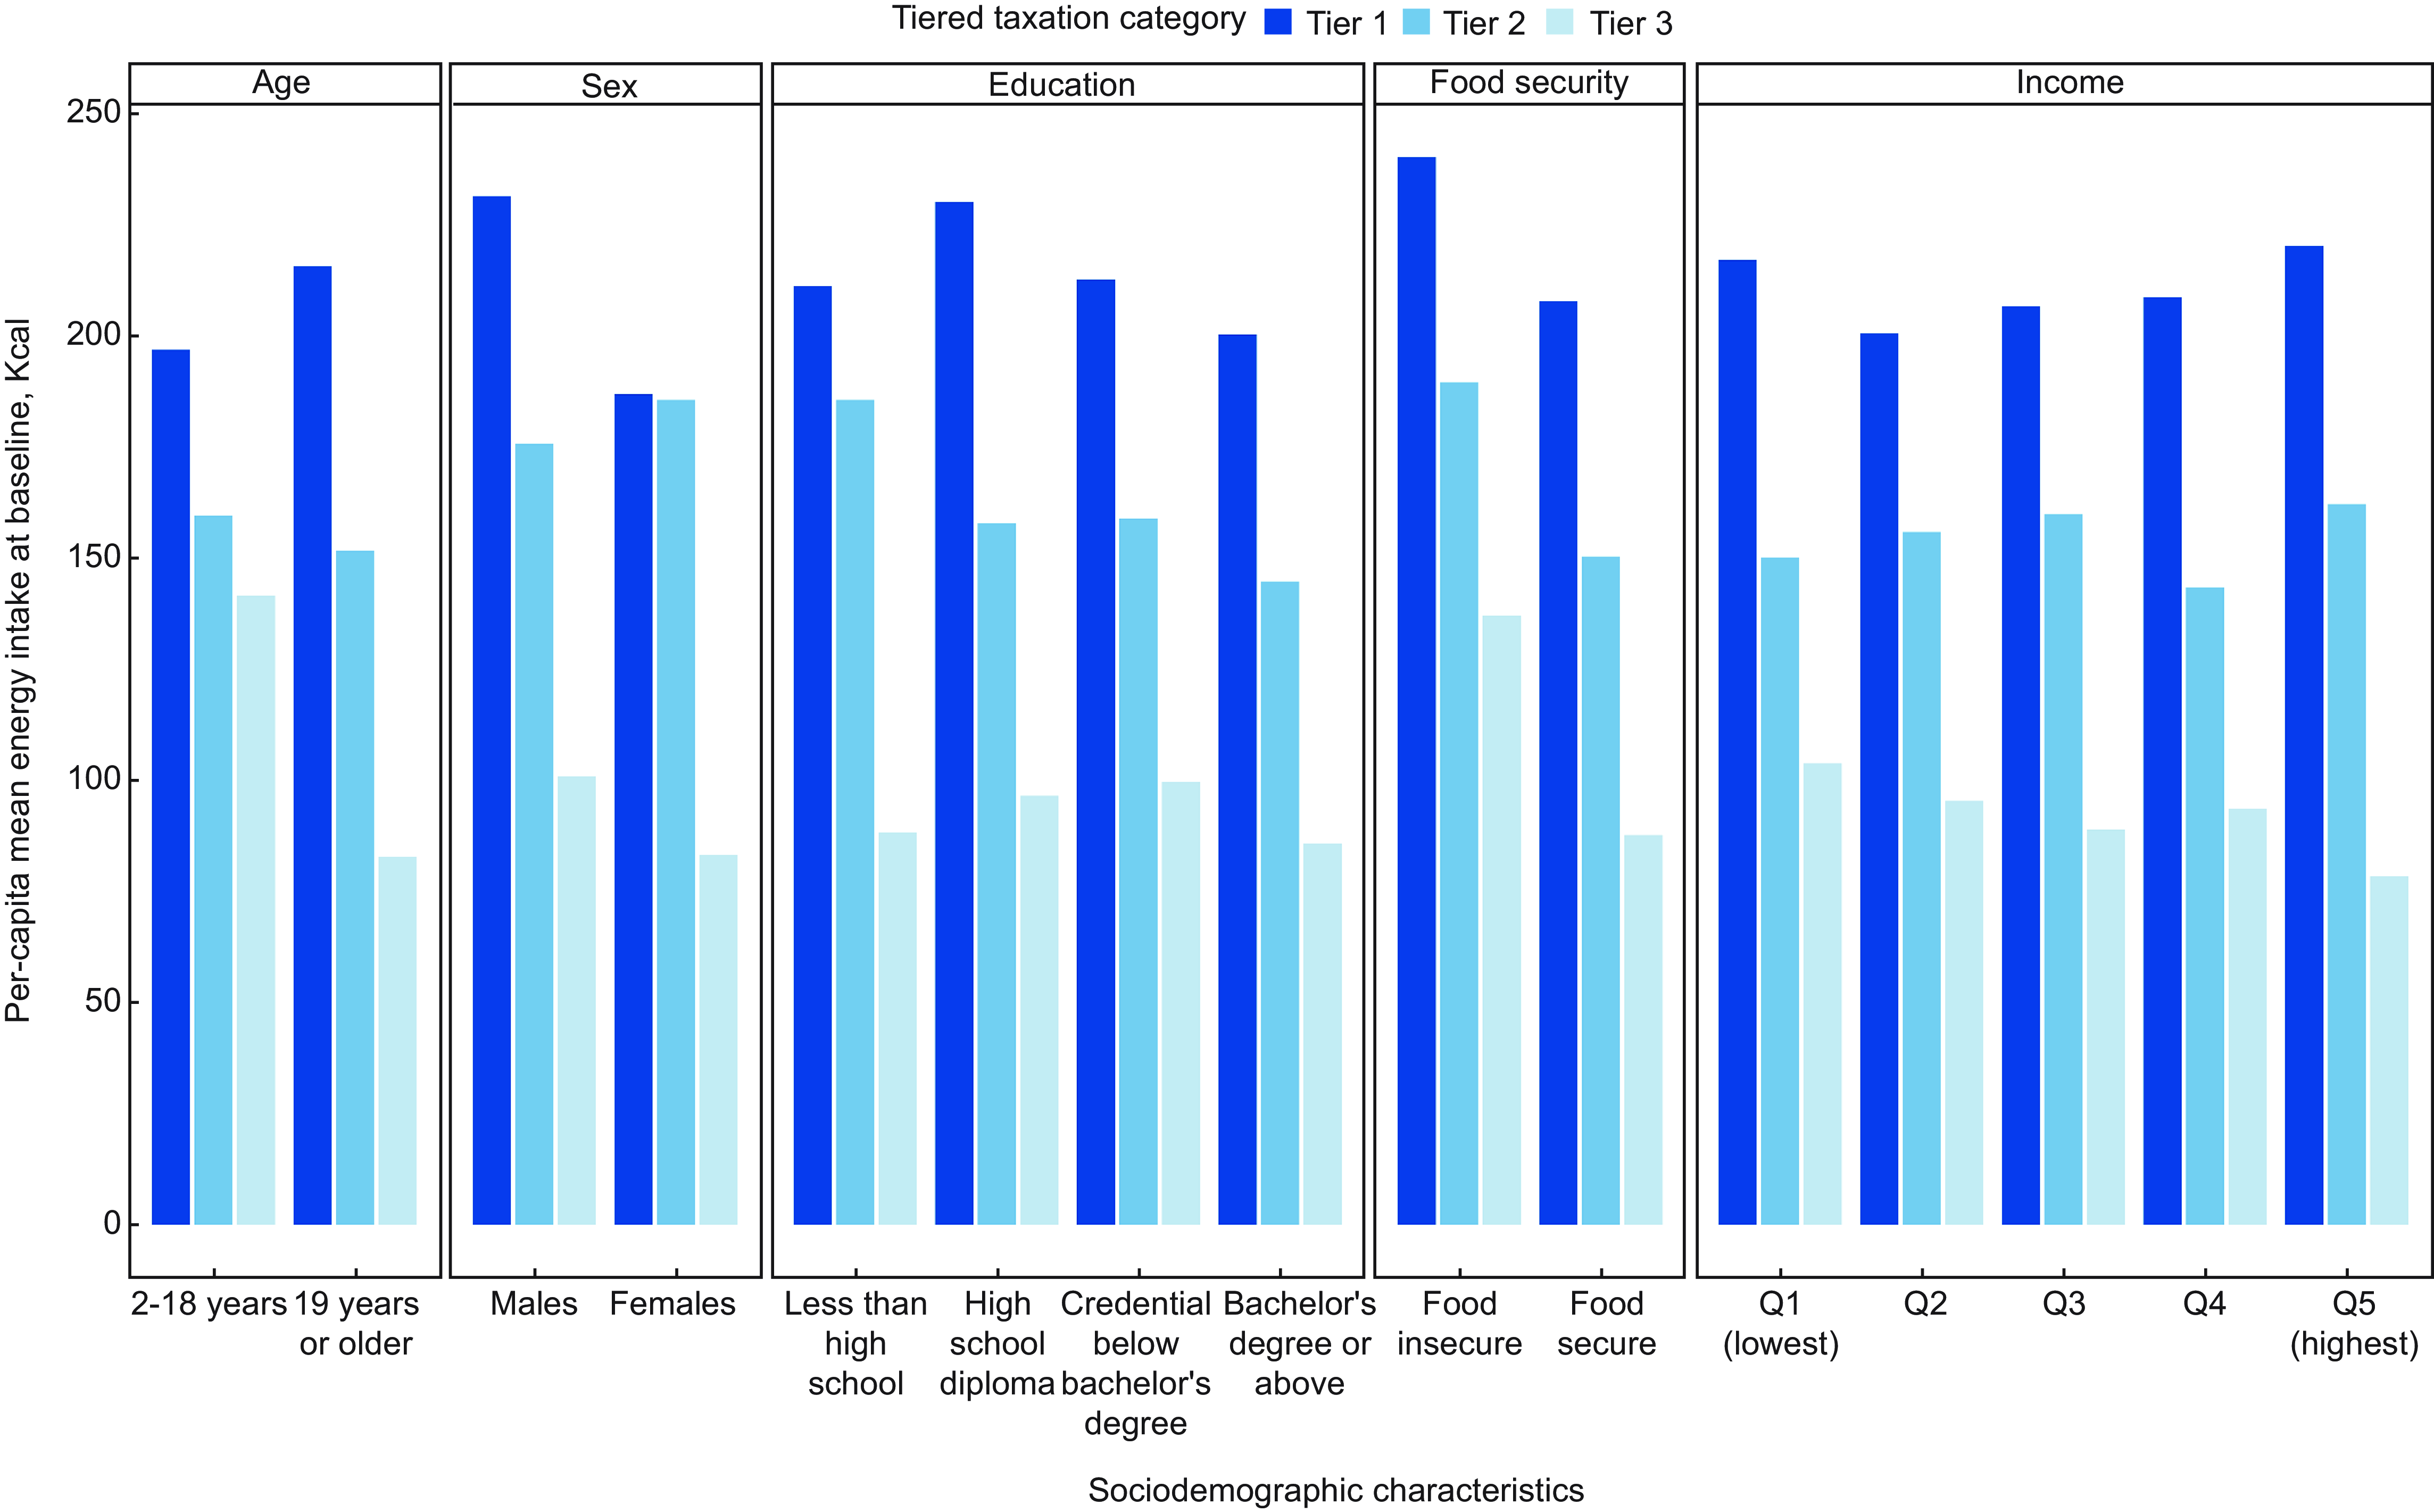
Fig. 3 Baseline distribution of energy intake from sugary drinks within each modelled tiered taxation level by sociodemographic characteristic, Canadian Community Health Survey-Nutrition (n 19 742).
Sensitivity analyses
Analyses using a homogenous own price elasticity across income groups did not change our results (see online supplementary material, Supplemental Table 5). Using a lower own price elasticity (–1·00) reduced the benefit of the modelled taxation scenarios compared with the estimates used in our main result (–1·39); however, the overall patterns of sugary drink consumption across socio-demographic characteristics remained (see online supplementary material, Supplemental Table 6). Assuming a 100 % pass-through of both a flat-rate tax and tiered tax resulted in further reductions of overall intake and inequities across equity groups (see online supplementary material, Supplemental Table 7).
Discussion
Using the most recent Canadian nationally representative dietary intake survey, we modelled the impact of implementing a sugary drink tax – a widely implemented policy internationally that is under consideration in Canada – on energy intake from sugary drinks. We estimated a sugary drink tax would reduce both mean energy intake and the proportion of daily energy intake from sugary drinks, with the tiered tax associated with a potential small additional but meaningful reduction in energy intake compared with the 20 % flat-rate tax scenario. Additionally, we estimated both taxation structures would reduce inequities in mean energy intake from sugary drinks measured in the CCHS-N, through a greater reduction in energy intake in children/adolescents, males, lower education, food insecure and the low-income quintile groups. However, in each sugary drink taxation scenario, inequities in sugary drink consumption remained after modelled tax implementations. Moreover, 100 % juice contributed an additional 34 kcal to per capita or 1·9 % of daily energy intake, demonstrating the potential benefit of considering policies that reduce the consumption of beverages containing both added and natural sugars(Reference Popkin and Ng8,Reference Kao, Jones and Ohinmaa17) . Overall, our study highlights the potential of sugary drink taxation, including the additional benefit of taxing 100 % juice, for reducing overall inequities in energy intake from sugary drinks in Canada.
Our findings from Canada add to the emerging international literature suggesting that tiered tax structures may be more effective than flat-rate taxes for reducing SSB consumption. For example, a US modelling study estimated a tiered tax to be more cost-effective than a flat-rate tax, with nearly double the health gains and savings(Reference Lee, Mozaffarian and Sy9). In our study, reductions in mean per-capita energy from sugary drinks were greater in the tiered compared with the 20 % flat-rate scenarios (40 v. 29 kcal, respectively), with greater per-capita mean energy intake from beverages with higher sugar concentration (tier 2 and 3 tax targets); however 95 % uncertainty intervals were overlapping after incorporating uncertainties related to OPE and CPE values. Additionally, our estimates are likely conservative, as shifts in consumer choice to lower sugar products and incentivized manufacturer product reformulation to reduce sugar content observed in real-world tiered sugary drink taxes were not modelled. For example, following the implementation of the two-tiered United Kingdom (UK) soft drinks industry levy [high tier: £0·24/l in the high tier (≥ 8 g/100 ml) and £0·18/l in the low tier (5–7·9 g/100 ml)], the purchased volume of drinks in the high levy tier decreased 44 % (95 % CI: 29–60), and the percentage of drinks with sugar in the high tier was reduced by 30 %(Reference Lee, Mozaffarian and Sy9,Reference Scarborough, Adhikari and Harrington29) . Similarly, in Portugal, product reformulation following the introduction of a two-tiered SSB tax in 2017 (<8 g/100 ml: €0·08/l and ≥8 g/100 ml: €0·17/l) decreased the average energy density of SSB by 3·1 kcal/100 ml(Reference Goiana-da-Silva, Cruz-e-Silva and Gregório30,Reference Goiana-da-Silva, Severo and Cruz E Silva31) . Tiered tax structures are consistent with the public health rationale for the implementation of sugary drink taxation, in that it can target both specific beverages and sugar content of these beverages(Reference Hattersley and Mandeville6). However, their limited implementation outside of high-income economies highlights potential implementation barriers, for example, the challenges in verifying and monitoring the sugar content of SSB(Reference Hattersley and Mandeville6).
Our findings suggest the introduction of a sugary drinks tax in Canada could reduce sugary drink consumption with the potential to reduce inequities in energy intake from sugary drinks. These findings are consistent with the international literature from empirical studies in the USA(Reference Bleich, Lawman and LeVasseur32) and Mexico(Reference Ng, Rivera and Popkin33) as well as modelling studies from Canada(Reference Kao, Jones and Ohinmaa17) and Australia(Reference Lal, Mantilla-Herrera and Veerman18) which suggest that SSB taxes reduce SSB purchases more among individuals with lower incomes and educational attainments. Further, sugary drink taxes have the potential to reduce social inequities in the prevalence and healthcare costs of associated health conditions. Modelling studies in Canada and elsewhere estimate larger potential health benefits among lower SEP groups with minimal additional financial burden concentrated among lower-income groups(Reference Kao, Jones and Ohinmaa17–Reference Briggs, Mytton and Kehlbacher19,Reference Andreyeva, Chaloupka and Brownell34–Reference Caro, Ng and Bonilla36) . For example, a Canadian study modelling estimated the annual financial burden associated with the implementation of a 20 % flat-rate sugary drink tax would be larger in the lowest income quintiles ($43·52 CAD) compared with the highest income quintile ($38·74 CAD)(Reference Kao, Jones and Ohinmaa17). While this suggests the sugary drink tax was regressive, because price increases would represent a larger percentage of income from low compared with high-income earners, the tax difference was offset by the increase in averted DALYs (156 000 v. 125 000 DALYs) and increased lifetime healthcare savings ($2·27 v. $1·98 billion) in the lowest compared with highest income quintile, respectively(Reference Kao, Jones and Ohinmaa17).
Although our study estimated a sugary drink tax would reduce inequities in sugary drink consumption in Canada, it is critical that policymakers consider the wider impacts of the design and implementation of a sugary drink tax. While from a public health perspective implementing a sugary drink tax can have health benefits and generate revenue, critics have argued these taxes can be paternalistic and regressive, unfairly and disproportionately impacting lower-income consumers(Reference Grignon37,Reference Riediger and Bombak38) . Appropriately balancing the ethical concerns raised by proponents and critics alike is important to the design of a sugary drink tax(Reference Mackay and Huber-Disla39). Transparency about the rationale for and anticipated benefits of the tax – health benefit, revenue generation, countering manipulation of consumers by sugary drink manufacturers(Reference Backholer, Vandevijvere and Blake7,Reference Mackay and Huber-Disla39) – and how tax revenues will be equitably invested to balance the unfair tax burden for low SEP sugary drink consumers are critical considerations for assessing the degree to which a sugary drink tax is just (3,Reference Petimar, Gibson and Roberto40) . For example, the seven US cities with SSB taxes raise $134 million annually from SSB taxes and contribute 85 % of revenues towards supporting projects and programmes in impacted communities, for example, early childhood programmes ($58 million) and community improvements including recreation centres and libraries ($21 M), and increasing healthy food and beverage access ($17 million)(Reference Krieger, Magee and Hennings41). Considerations for the design, implementation and evaluation of a just sugary drink tax go beyond ‘to tax or not to tax’ and require insights from multiple disciplines and stakeholders, including constructive collaboration between finance and health policymakers(Reference Ng, Colchero and White42).
Sugary drink taxation policies are an important first step for reducing sugar consumption and related adverse health conditions. However, no single policy will reduce sugary drink consumption to healthy levels and additional interventions should be considered(Reference Valizadeh, Popkin and Ng43,Reference Andreyeva, Marple and Moore44) . A recent Canadian study estimated that targeting SSB with taxation would be insufficient on its own to effectively reduce the health and economic burden of chronic diseases associated with excess sugar consumption from additional products(Reference Liu, Munasinghe and Maximova13). Moreover, it is imperative to consider taxation in the context of an embodied policy approach, with additional considerations for improving access (i.e. availability and affordability) to safe nutrient-dense items(Reference Valizadeh, Popkin and Ng43) and reducing health inequities associated with material deprivation(Reference Kirkpatrick, Dodd and Parsons45). A recent systematic review found that food subsidy programmes are associated with increased purchasing of subsidised goods; however, there was uncertainty about associated shifts in consumption(Reference Andreyeva, Marple and Moore44). Moreover, food subsidy programmes(Reference Niebylski, Redburn and Duhaney46) have existed for decades but are inadequate in alleviating material deprivation (food insecurity) in Canada(Reference Kirkpatrick, Dodd and Parsons45), wherein 2022, 6·9 million Canadians in the ten provinces lived in food-insecure households, with further inequities across geography, race/ethnicity and income(47). Recent economic shifts associated with reductions in food access (among other necessary goods and services)(48) reflect a timely need for broad policy action. Comprehensive monetary policies such as guaranteed annual income may provide autonomy in regard to accessing healthy and safe food options and reduce barriers associated with targeted food subsidy programmes, such as enrolment criteria and longevity(Reference Niebylski, Redburn and Duhaney46). Further research on this topic should be considered in Canada.
This study is not without limitations. Social desirability bias in self-reported data may have attenuated inequities towards the null as lower compared with higher SEP groups may be more likely to underreport the unfavourable consumption of sugary drinks(Reference Garriguet49). However, our previous analysis of sugary drink consumption in the CCHS-N found minimal impact on outcomes when adjusting for energy misreporting(Reference Warren, Hobin and Manuel12). We utilised single-day 24-h dietary recalls which are prone to random error associated with the within-person variation. However, single-day 24-h dietary recalls are sufficient for estimating mean intake on a given day(Reference Garriguet11). Our analyses required several assumptions for modelling inputs. Price elasticity estimates vary across modelling studies(Reference Andreyeva, Marple and Marinello5,Reference Kao, Jones and Ohinmaa17,Reference Teng, Jones and Mizdrak28) . For example, a recent systematic review estimated average SSB price elasticity estimates of –1·00 (95 % CI: –1·47, –0·50)(Reference Teng, Jones and Mizdrak28), while income-specific price elasticities utilised in previous Canadian research ranged from –0·87 to –0·92(Reference Kao, Jones and Ohinmaa17). We leveraged the most recent meta-analysis which estimated a larger price elasticity of –1·39 from high-quality studies(Reference Andreyeva, Marple and Moore44). Despite the variability in price elasticities, our estimates align with other studies(Reference Kao, Jones and Ohinmaa17). We assumed consistent price elasticities for all sugary drinks, and the tax effect on different beverage types (e.g. soft drinks v. 100 % juice) may differ overall and across equity stratifiers. However, due to the heterogeneity of beverage options included in modelling price elasticity estimates, we assumed that the average impact represents an appropriate measure for our study. For the tiered taxation scenario, we assumed that cross-price elasticities would be reflected by a 20 % price increase which may not directly reflect the replacement related to low and high sugar beverage products.
Our study has several strengths. We leveraged the most recent population-representative nutrition survey, which contains the only data on consumption, to estimate the impact of sugary drink taxation on intake in the population and across equity stratifiers. Our comprehensive list of sugary drinks included traditional and novel types, including 100 % juice(Reference Czoli, Jones and Hammond50). We estimated the impact of two taxation structures in Canada, both of which have been implemented in real-world policies(Reference Backholer, Vandevijvere and Blake7). We tested the robustness of including both income-specific (primary analysis) and homogenous price elasticity estimates and found similar impacts of both taxation scenario across equity stratifiers. Finally, our socio-demographic-specific trends highlight the importance of population-level interventions to consider differential impacts across important equity stratifiers.
Conclusion
We estimated that sugary drink taxation would reduce overall intake from sugary drinks, SSB and 100 % juice and would reduce but did not eliminate, inequities in energy intake across age, sex and SEP among Canadians. The tiered tax scenario was estimated to a have small but meaningful reduction in mean energy intake from sugary drinks compared with a 20 % flat-rate scenario. Future research should consider how best to design and implement a sugary drinks tax in Canada that both maximises the health benefits and reduces social inequities in consumption.
Acknowledgements
We thank Salma Hack for providing nutrition-related analytical support using the Canadian Community Health Survey-Nutrition 2015.
Financial support
This research was funded by the Canadian Institutes of Health Research (CIHR Project Grant #391 602). CIHR had no role in the design, analysis or writing of this article.
Conflict of interest
None.
Authorship
B.T.S. and E.H. contributed to the conception and design of this work. B.T.S. and D.G.M. acquired funding for this work. C.M.W. and S.H.F. contributed to the formal analysis. B.T.S., C.W. and S.H.F. contributed to the interpretation of data and results. B.T.S., C.M.W., L.N.A., D.H., D.G.M., Y.L., A.T.A., L.C.R., S.H.F. and E.H. contributed to this study’s methodology. B.T.S. led this work’s supervision. B.T.S. and C.W. contributed to the writing of the original draft. All authors contributed to the review and editing of this work and have read and approved the final manuscript.
Ethics of human subject participation
This study was conducted according to the guidelines laid down in the Declaration of Helsinki, and all procedures involving research study participants were approved by the Ethics Review Board at Public Health Ontario (Protocol Code: 2018-046.01). The project involved the secondary use of non-identifiable data; therefore consent was not required as per Canada’s Tri-Council Policy Statement: Ethical Conduct for Research Involving Humans – TCPS 2 (2022) Article 5·5B, which states that ‘Researchers shall seek REB review, but are not required to seek participant consent, for research that relies exclusively on the secondary use of non-identifiable information’.
Supplementary material
For supplementary material accompanying this paper visit https://doi.org/10.1017/S1368980024000545.


 Open access