


Introduction
In a previous paper by one of the authors (Reference WardWard, 1980) the main characteristics of the snow cover in the Cairngorm Mountains, Scotland, were described and contrasted with snow conditions in alpine areas. The primary aim of this paper is to present the data on which that summary was based, so that more quantitative comparisons may be drawn than were previously. In addition, new information is presented on the stratigraphy, temperature profiles, and grain sizes of the Cairngorm snow-pack. The second aim of the paper is to relate Scottish snow-cover conditions to the likelihood of avalanche activity.
Source of data
The only area in Scotland in which a large number of snow-pit studies have been made is on the north side of Cairngorm, a 1245 m high mountain in central Scotland, lat. c. 57° N. Cairngorm forms the northern part of an extensive plateau with an elevation between 1000 m and 1300 m that lies 40 km from the nearest coastline (Fig. 1). All but three of the snow-pits were dug at an altitude of c. 1000 m, and their locations are shown in Figure 1. The site codes L (for Langmuir), B1 to B4 (for Beattie), and W1 to W8 (for Ward) indicate where the profiles shown in Figures 9 and following were measured.

Fig. 1. The location of snow-pits dug on the north side of Cairngorm by Beattie (B1 to B4), Langmuir (L), and Ward (W1 to W8).

Fig. 9. Snow profiles preceding cold-climax avalanche activity. Ram resistance is in kiloponds for the top two profiles.
Between 1968 and 1970 Langmuir made 30 sets of measurements, chiefly in the months of January to April. Subsequently, between 27 March and 17 April 1975, Beattie made a further eight sets of measurements, and finally Ward made another 16 sets between 1978 and 1980, chiefly in the months of January to April. Altogether this amounts to 54 snow-pits over the 12 year period 1968 to 1980. Langmuir published a brief summary of his work in 1970 (Reference LangmuirLangmuir, 1970), whilst Beanie’s and Ward’s data exist in unpublished theses (Reference BeattieBeattie, unpublished, Reference WardWard, unpublished).
Whenever possible, each of the authors measured snow temperature, ram penetration resistance, stratigraphy, grain-size, wetness, and hardness. Beattie and Ward also made some density measurements. Tables I and II list the instruments, manual tests, and stratigraphical terminology used by each author. The most important difference in the choice of instrument is the Czech penetrometer used by Langmuir, which does not give results which are easily comparable with those obtained by Ward and Beattie using a Swiss instrument. Beattie found that his hardness measurements, made with a hand-held penetrometer, gave high scatter and unreliable results. Therefore they are not discussed here.
Table I. Equipment and Manual Tests Employed by the Authors

Table II. Stratigraphical Terminology Used by the Authors and their Equivalence

Climatic data from the Cairngorms
The chief control on snow characteristics is the local climate, since this determines the type and amount of snow which falls and its subsequent meta-morphism. Unfortunately reliable long-term meteorological data are not available for the high plateaux of the Cairngorms. Prior to the winter of 1977/78 almost all the weather data in existence came from (Table 1 and Table 2) low-altitude (c. 350 m) weather stations located in the major river valleys around the periphery of the mountains. In 1977 the Physics Department of Heriot Watt University installed an experimental weather station at 1245 m on the summit of Cairngorm, which records temperature, wind-speed, and wind direction. Technological improvements enabled an almost complete set of data to be obtained with this instrument by the winter of 1979/80. At no time have winter precipitation amounts been recorded at high elevation.
This limited amount of data makes it difficult to characterize a “typical” or “average” winter on the Cairngorm plateau. In fact, the three winters during which high-altitude data were obtained from the Heriot Watt station proved to be amongst some of the most extreme since records began. Thus the blizzard of 27 January to 3 February 1978 was the worst since 1955, March 1978 was the wettest on record, April 1978 was the coldest since 1936, January 1979 was the coldest since 1963, and the winter 1978/79 was one of the coldest since 1900 with spring being particularly cold. By contrast the winter of 1979/80 was very mild, although not remarkably so.
Figures 2 and 3 show temperature and snow-fall data for the winters 1977/78 to 1979/80. As stated above these represent two unusually cold winters and one warm winter and thus whilst not permitting average conditions to be discerned they give a good impression of the total range. It will be noted that:
-
(1) Thaws occur throughout each winter although in January and early February they are short-lived and marginal.
-
(2) Maximum temperatures are mostly in the range −6° C to 2° C, although they may fall to −15° C. Minimum temperatures usually stay below −4° C, and are frequently below −8° C.
-
(3) Snow-falls are frequent although they rarely exceed about 500 mm water equivalent during a single storm as measured at low altitude.
-
(4) Wind-speeds are usually high, exceeding 18 m s−1 50% of the time and reaching maximum speeds well in excess of 40 m s−1. Days with light winds are very few.

Fig. 2. Maximum and minimum daily temperatures at 1245 m on Cairngorm during the Winters 1977/78, 1978/79, and 1979/80. A dot represents a measured value. All other values are estimates based on regression equations using data from Glenmore Lodge.

Fig. 3. Major snow-falls during the three winters as measured at Glenmore Lodge (altitude 300 m, 5.5 km to the north) and Lagganlia (altitude 260 m, 14 km to the west).
Snow Data
Ram penetration resistance
Figure 4a shows a number of ram profiles taken from each of the years in which data were collected including both typical and extreme profiles. Turning first to Langmuir’s data, which do not include the basal snow layers, typical values lie in the range 50 to 20 kiloponds (kp), with extreme values of 1 kp for very soft snow and 40 or more kp for ice layers. During 1968 and 1969 the overall tendency was for resistance to increase as winter proceeded towards mid March, after which resistance fell in the surface layers. In 1970, resistances were higher than in the previous years and by spring a hard surface layer had been established above a region of low resistance. This surface layer had a resistance of 32 kp.

Fig. 4. A. Selected ram penetration profiles. Note that profiles measured between 1968 and 1970 are in kiloponds. B. Selected temperature profiles.
Beattie’s measurements cover only a three-week period over March and April 1978. During this time the resistance of the basal layers was always in excess of 70 kg, but the upper snow layers, except on 3 April, at no time exceeded 35 kg and were frequently less than 20 kg in resistance. These are fairly typical spring values reflecting the impact of thawing.
Ward also found resistant basal snow layers and high resistance snow at intermediate depth occurred more frequently in the profiles he measured. In 1978 for example, snow with a resistance of over 60 kg was recorded at a depth of 40 cm while in 1979 and 1980 resistances above 100 kg were found at similar depths. Again, in April and late March it was typical to find weaker surface snow layers, and low resistance surface layers of about 10 to 20 kg resistance occurred after snow-falls. An interesting feature of the 1979 profile was a persistent layer of low-resistance (10 to 20 kg) snow just above the base of the profile. The origin of this layer is unknown. The highest resistance measured related to ice layers which occur frequently throughout the profile at all times during the winter.
Snow temperature
A range of temperature profiles are shown in Figure 4b which demonstrate the main profiles that typically occur. Those obtained by Langmuir can be classified into three groups: (a) Isothermal profiles were normally measured when air temperatures were at or above freezing, although on 3 May 1968 the snow was (figure 4) isothermal at −1° C when the air temperature was −3° C; (b) Profiles with temperature inversions are common, and the inversion consistently occurs at a depth of about 20 cm; (c) The third type of profile shows a regular increase in temperature with depth, with the gradient often becoming strongest in the top 20 cm of the profile. It should be noted that most of Langmuir’s pits were dug before midday.
Beattie’s temperature profiles show one or more temperature inversions on all days except 15 April 1975 when the whole profile was isothermal at 0° C. Minimum temperatures were measured at −10 and/or −40 cm depth in the snow cover and did not fall below −7° C (measured on 17 March). Generally temperatures did not fall below-3° C during the three-week period.
Ward’s temperature profiles are similar to those of Langmuir with inversions occurring at a depth of 20 cm. During 1979 and 1980 warm temperatures raised snow temperatures and the profiles were often completely or almost isothermal.
The coldest snow temperature recorded at Cairngorm is −11.5° C, measured at the surface by Langmuir on 16 February 1970 and Ward on 15 February 1978, although it is likely that nocturnal minima may be lower by a few degrees. The strongest temperature gradients measured were 0.25 deg/cm found on 15 February 1978 and 15 January 1969. These gradients are exceptional and occur only in the top 20 cm of the snow cover where absolute temperatures are low. Also they are not sustained for long periods. Typical temperatures in the basal snow layers are within one or two degrees of the melting point, whilst surface snow layers are mostly between 0° C and −5° C.
Stratigraphy
Some difficulty is caused by the three authors’ use of different stratigraphical terms. Some profiles are shown in Figure 5a. Langmuir’s profiles show the following major stratigraphical components:
-
(1) An upper layer of small granules with grain diameters not exceeding one millimetre.
-
(2) An intermediate layer, extending at times to the base, consisting of angular firn. Langmuir regarded this as incipient temperature-gradient snow.
-
(3) Basal layers of spherical firn. Surface layers were also of spherical firn on some occasions when thaws occurred.
-
(4) Crust of various kinds, presumably icy, occurred at various levels in the snow.

Fig. 5. A. Selected stratigraphical profiles. B. Selected grain sizes and types. C. Selected density profiles.
Beattie’s stratigraphy shows two basic elements:
-
(1) An upper layer of felt-like snow or broken snow, which represents accumulation during windy periods.
-
(2) A basal layer of fibrous firn which probably refers to melt-freeze grains.
Ward’s stratigraphical profiles show the following:
-
(1) Surface layers of wind-blown snow forming either hard or soft slab.
-
(2) Basal layers of coarse granular snow with grain diameters usually greater than 2 mm, intercalated with ice layers.
In addition, four layers occur which are important in the profile:
-
(3) Layer boundary. These occur within single units of windslab and form natural fracture surfaces parallel to the slope. Blocks of snow can be easily quarried along these planes and although they may occasionally appear as low-penetration horizons they are usually missed since they are effectively of infinite narrowness. Speculatively, their origin may be a break in the depositional sequence forming the windslab, either as a result of sudden reduction in wind-speed or a decrease in the momentary snow-fall intensity.
-
(4) Ice layers. In certain sections multiple bedded ice layers were found (e.g. 13 March 1980) and single layers reached 5 cm thick. Thicker layers were often dirty with vegetation fragments and are thought to result from major thaws.
-
(5) Slush layers. These were common in 1979 and on one occasion formed a sheath around the penetrometer. They appear to be supported by impermeable ice layers.
-
(6) Basal weak layer. These occurred, as mentioned earlier, throughout 1979 at the very base of the snow cover. Although no visible change occurred within the basal layers, a region occurred where resistance and hardness values fell quickly.
Grain-sizes
Grain diameters in the Cairngorm snow-pack are generally between 0.5 and 3.0 mm and most commonly between 1.0 and 2.0 mm. The most detailed measurements are those by Langmuir and Beattie. Figure 5b shows a number of profiles in which grain-sizes and crystal type are shown. Each author’s stratigraphical terminology has been retained (see Table II).
Fresh snow and broken powder snow have grain diameters between 0.5 mm and 1.0 mm. However, the smallest grain-sizes are associated with Langmuir’s “small granules”, which probably correspond to equi-temperature grains, decreasing grain-size, in Reference SommerfeldSommerfeld’s (1969) classification. These grains range in size from a minimum measured of 0.2 mm to 1.0 mm. Grains of spherical firn are typically about 1.5 mm in diameter, whilst grains of angular firn range from 0.5 mm to a maximum of 3.0 mm, measured by Langmuir in January 1969. The data suggest that angular firn remains fairly constant in size throughout the winter, once it has reached a typical diameter of 1.5 to 2.0 mm. The term spherical firn as used by Beattie refers to equi-temperature snow, whilst Langmuir’s use of the term includes both equi-temperature and melt-freeze grains. Beattie’s fibrous firn represents melt-freeze grains. Equi-temperature snow grains appear to remain constant in size throughout the winter once they have achieved a diameter of about 1.5 mm. However, melt-freeze metamorphism produces large-diameter grains at the base of the snow-pack, and these may reach 3.0 mm to 4.0 mm towards the beginning of spring. By May, the entire snow-pack is comprised of coarse-grained melt-freeze snow, except after fresh snow-fall.
Hardness
Each author assessed hardness manually and found this parameter to vary between 1 for fresh snow or slush, to 5 for ice layers and basal snow layers. Typical values were near to 3.
Wetness
Langmuir rarely recorded snow wetter than about 3 and Beattie’s figures are usually 2 to 4. Ward noted a strong contrast between 1978/79 and 1979/80. In the former year cold temperatures encouraged dry mid-winter profiles whilst in the latter year warmer temperatures produced much wetter profiles. Although there is a tendency for the profile to become wetter towards spring, the occurrence of thaws during a winter can produce very damp snow at any time.
Density
Beattie and Ward measured density and some of their results are shown in Figure 5c. Beattie’s values ranged from 70 kg m−3 in the softest layer to a maximum of 530 kg m−3 in the most dense layer, with most values above 300 kg m−3. Beattie found an increase of density both with depth and time. The lowest density measured by Ward was 130 kg m−3 in a softish slab on a ridge crest. Measurements at lower elevation on the same day gave readings of 380 kg m−3. The highest figure obtained was 680 kg m−3 for a slush layer, but average figures were typically between 350 kg m−3 and 500 kg m−3. The highest densities are probably too low, as it was usually physically impossible to obtain a complete core in high-density icy snow, since the cylinder buckled.
Discussion: the Cairngorm Mountains and Other Areas Compared
In order to put these data in perspective, and indicate the type of metamorphism found in Scotland, it is instructive to compare the profiles described above with those obtained from other areas. The choice for comparison depends partly on the availability of published data and partly on the intention to highlight the processes by contrast. The comparison is confined to mid-winter conditions, since the dominance of thaw as spring approaches makes the alpine and Scottish snow covers very similar.
Temperature
Temperature is the most important variable governing metamorphism in the snow-pack.
Figure 6 shows temperature profiles from Japan (Reference Huzioka, Huzioka, Shimizu, Akitaya, Narita and ŌuraHuzioka and others, 1967, fig. 3), the San Juan Mountains (Reference Armstrong, Armstrong, LaChapelle, Bovis and IvesArmstrong and others, 1974, appendix, p. 107), the T’ien-shan (Reference Zhang Xiangsong, Hsiang-sung, Yanlong and Yen-lungZhang and Wang, 1980, figure from conference preprint) and the Weissfluhjoch, Switzerland (Reference Quervainde Quervain, 1975, fig. 2). Each profile shows a strong temperature gradient, with minimum surface temperatures of between −16° C and −26° C. In Colorado, minimum surface temperatures may fall to −22° C. Temperature gradients of 0.1 deg/cm occur throughout the San Juan profile, whilst at the Weissfluhjoch in the surface layers they reach between 0.2 and 0.3 deg/cm. The T’ien-shan profile is exceptional, showing a mean gradient of 0.45 deg/cm. The strongest gradients occur early in the season in shallower snow-packs.

Fig. 6. A comparison of mid-winter temperature profiles in the cairngorms and elsewhere. 1980 China refers to the work of Zhang and Wang.
By contrast the lowest measured snow temperature in the Cairngorms is −11.5° C, although it is probable that −15° C is reached. Although temperature gradients of 0.1 deg/cm have been measured, they do not persist, and occur after mid-January when the snow cover is already quite deep.
Density and ram resistance
Figure 7a shows density data from Alta in Utah, United States (Reference KeelerKeeler, 1969, fig. 3), from the San Juan Mountains of Colorado (Reference Armstrong, Armstrong, LaChapelle, Bovis and IvesArmstrong and others, 1974, appendix, p. 107) and from Sapporo, Hokkaido, Japan (Reference Huzioka, Huzioka, Shimizu, Akitaya, Narita and ŌuraHuzioka and others, 1967, fig. 3). The densities shown in Figure 7a are from rather late in the season and show values that are rather higher than true mid-winter figures. They lie mainly in the range 200 to 300 kg m−3, with a maximum, rarely achieved, of 400 kg m−3. In contrast to these figures, Scottish snow densities are frequently above 300 kg m−3, and even in mid-winter basal layers have densities up to 500 kg m−3. Only after recent fresh snow-fall does Scottish snow exhibit lower densities, although these may persist if the temperature remains low over several days.

Fig. 7. A. A comparison of mid-winter density profiles in the Cairngorms and elsewhere, B. A comparison of mid-winter ram-penetration profiles in the Cairngorms and elsewhere.
As would be expected, ram resistances show a similar contrast. Figure 7b shows ram profiles from the Weissfluhjoch (de Reference QuervainQuervain, 1975, fig. 2), the San Juan Mountains (Reference Armstrong, Armstrong, LaChapelle, Bovis and IvesArmstrong and others, 1974, appendix, p. 106), the Berthoud Pass area of Colorado (Reference Judson and ŌuraJudson, 1967, fig. 6) and from alpine Italy (Reference VenetoVeneto, 1980, appendix, station 10 SP, profile for 18 February). The profiles show a good deal of variability between very low values of a few kilogrammes up to a maximum of 80 kg measured at the Weissfluhjoch. However, ram resistance does not usually exceed 40 kg, with the uppermost snow layers less than 20 kg and frequently less than 10 kg. In contrast, ram penetration values in Scotland, except in fresh snow, are usually above 20 kg and in mid-winter it is not uncommon to find large thicknesses of snow with resistances of well over 100 kg.
Stratigraphy
Figure 8 shows some typical profiles, standardized as much as possible since different authors use (figure 8) different terminology. These are from Japan (Reference Huzioka, Huzioka, Shimizu, Akitaya, Narita and ŌuraHuzioka and others, 1967, fig. 2), the United States (Reference Perla and MartinelliPerla and Martinelli, 1976, fig. 84; Reference Armstrong, Armstrong, LaChapelle, Bovis and IvesArmstrong and others, 1974, appendix, p. 107), and Switzerland (Reference Quervainde Quervain, 1975, fig. 2). The major elements in these profiles differentiating them from Cairngorm counterparts are:
-
(1) The presence of temperature-gradient snow, including well developed depth hoar at or near the base of the snow-pack and occasionally at intermediate depth. Meteorological conditions in Scotland preclude the development of advanced temperature-gradient snow, unless it be under very unusual conditions.
-
(2) The general absence of ice layers. These are very common in the Cairngorms.
-
(3) The lack of coarse granular snow at the base of the snow-pack. This is an important element in Scottish snow conditions.
-
(4) Grain diameters generally are smaller than those measured in the Cairngorms, with the exception of depth-hoar grains which reach large sizes in alpine snow-packs. Typical grain diameters measured at Cairngorm are between 1.0 and 2.0 mm for equi-temperature snow. Melt-freeze grains may grow to 4.0 mm in diameter.

Fig. 8. A comparison of mid-winter snow-cover strati-graphies in the Cairngorms and elsewhere.
Snow metamorphism in Scotland
The above section has made it clear that there are major differences between the Scottish snow cover and that found in colder, more alpine areas. Scottish snow in mid-winter is denser, icier, and harder. Clearly the main reason for this is found in the temperature conditions that occur throughout the Scottish winter.
In Scotland, incursions of warm maritime air may occur at any time, producing thaws and the release of melt water in the snow cover. The effect of this is to encourage equi-temperature metamorphism, the formation of ice layers and the rapid densification of the snow cover. Coarse granular snow at the base of the snow-pack is encouraged by melt-freeze metamorphism for the base of the snow cover is usually at or close to the freezing point.
The only interruption to the process of rapid densification and settlement occurs when temperatures remain low for an extended period, in which case the upper snow layers, about the top 50 cm or so, remain comparatively weak, with penetration values of about 20 kg and densities between 200 and 300 kg m−3. However, the basal snow layers are unaffected by cold spells and retain their high density and ram resistance. In a deep snow-pack the temperature of the bottom snow layers rarely falls below −2° C.
For a number of reasons depth-hoar formation can be discounted in Scotland. Depth-hoar formation is encouraged by strong temperature gradients in low-density snow at temperatures close to the melting point. These conditions do not occur in Scotland, where vapour gradients are unlikely to exceed 0.05 mbar/cm, which is below the probable limit suggested by Reference ArmstrongArmstrong (1980) for temperature-gradient snow to form. The low altitude of the hills further impedes depth-hoar formation as barometric pressure is somewhat higher. It may be that radiation recrystallization occurs to form thin layers of depth hoar, but this has not been demonstrated.
Equi-temperature metamorphism in damp snow and melt metamorphism dominate the Cairngorm snow cover after February and also at the beginning of winter. They also control the development of the basal layers throughout the entire winter. The frequent occurrence of ice layers may be due to repeated melting and refreezing of surface snow, possibly on a diurnal cycle when maximum temperatures rise above 0° C, or may be formed when surface melt water drains through the snow cover and freezes at a temperature inversion a few centimetres below the surface. The other important effect of warm temperatures is the formation of slush layers in spring.
Snow Characteristics and Their Relation to Avalanche Release
This final section is concerned with the relationship between the snow properties that occur in Scotland and the likelihood and type of avalanche activity associated with them. This is done by describing the snow-pack conditions at times when extensive avalanching was taking place and at times when no avalanches were recorded.
Of the many hundred avalanches which have been recorded in the Cairngorms, antecedent weather conditions could be established for 98, whilst snow-pit data were available for a smaller number. Three basic types of avalanche were differentiated in the Cairngorms: climax avalanches following a prolonged cold spell after heavy snow-fall, climax avalanches during thaws, and direct-action avalanches during storms. Examples of the snow-cover properties at such times will be illustrated in turn, and antecedent weather is shown in Table III.
Table III. Meteorological Data (Maximum Air Temperature and Minimum Air Temperature at 1245 m a.s.l., Fresh Snow-Fall at 300 m a.s.l.) For Fourteen Days Preceding the Release of Avalanches Described in the Text

(1) Cold climax avalanches
During the period 1977-80 Ward noted thirty dry-slab avalanches of cold climax type. Langmuir also noted a large avalanche from the headwall of Coire Cas in February 1969, which, along with another from the same slope in February 1978, are very typical of the cold climax type. The meteorological precursors to these events were remarkably similar, each comprising a week of cold sunny weather (maximum temperatures about −5° C) which had followed a moderate snow-fall in cold conditions. The snow-pit data available before these events are: (a) Pits by Langmuir in Coire Cas on 14 February 1969 and 17 February 1969. Avalanche on 19 February 1969. (b) Pit by Ward in Coire Cas on 15 February 1978. Avalanches on 19 February 1978 and 21 February 1978.
These pits are shown in Figure 9, and show obvious similarities. The profiles are extremely dry, and the topmost 50 cm of the snow has low ram resistance and is soft. There are quite strong temperature gradients in the uppermost snow of between 0.1 and 0.2 deg/cm, and the actual values are low. The surface snow is close to −10° C and the top 50 cm is colder than −4° C. A crust at a depth of 20 cm is a recurring feature. Whether or not this is a significant horizon in terms of avalanche activity is not known.
(2) Thaw climax avalanches
By mid April avalanche activity in the Cairngorms is almost entirely of thaw climax type, and becomes a major part of the disappearance of the snow cover. For example, between 17 and 19 April 1979 alone, hundreds of wet sluffs and cornice falls occurred in the Cairngorms.
Snow-pits were dug on 11 and 19 April, the latter while a slow avalanche was in progress a few yards away. The profiles are shown in Figure 10.
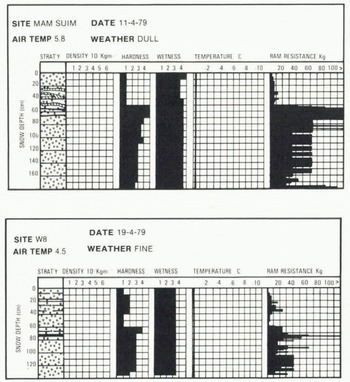
Fig. 10. Snow profiles preceding the release of thaw-climax avalanches. Mam Suim is a spur running Just north of the area shown in Figure 1.
It is clear that there are fundamental differences between the snow covers prior to cold releases and prior to wet avalanche release in thaws. The snow cover is very wet, and may be slushy in places. The temperature profile is isothermal at the melting point. The ram profile is weak at the surface, but, unlike the cold climax avalanches, has greater strength at depth. Ice layers are common in the profile, and in the case of the 11 April pit appear to affect the position of the slush layers.
(3) Direct-action avalanches
Although climax avalanches account for roughly 90% of all recorded avalanches, it is likely that direct-action avalanches form a large proportion of all actual occurrences. The problem of observing during blizzards is a perennial one (Reference Föhn, Föhn, Good, Bois and ObledFӧhn and others, 1977). As a result, only one example of a direct-action avalanche can be described. This occurred on 27 January 1978, when 34 mm of snow fell at the start of a prolonged storm (number 7 in Fig. 3). The previous storm had deposited 352 mm of new snow between 21 and 24 January, of which 236 mm fell on 24 January. This had not consolidated due to cold weather. A pit was dug on 25 January, the day after the main snowfall had occurred (Fig. 11). The profile shows some similarities to those shown in Figure 9 in that it is very dry and ram resistances are low because the snow is fresh, and has not begun to consolidate. Temperatures are intermediate. The dominant feature is the mass of new snow shown in the stratigraphy.

Fig. 11. Snow profile preceding the release of a direct-action avalanche in the Cairngorms.
(4) Summary
To summarize the above, the profiles associated with avalanche activity have a single common element, which is a thick surface layer of snow, about 50 cm or more deep, with very low ram resistance. The other characteristics are:
-
(1) Extremes of water content, either very wet or very dry.
-
(2) In the case of climax avalanches, extremes of temperature, either very low with large gradients, or isothermal at the melting point.
In contrast, profiles associated with stable conditions (i.e. when no avalanches are occurring), show rain resistances which are far higher, often over 100 kg. Other important differences include:
-
(1) Wetness, as would be expected, is intermediate, with values around three.
-
(2) Temperatures are intermediate, between 0° C and about −3° C. Probably this range is rather conservative.
-
(3) Densities are noticeably higher than in unstable pits, at least in the surface layers, with values above 300 kg m−3, compared with values closer to 200 kg m−3.
Examples are shown in Figure 12 which shows pits dug at a time when no avalanches were observed throughout the Cairngorms, despite wide ranging observations over two or three days.

Fig. 12. Snow profiles occurring during periods of no known avalanche activity.
One difficulty with apparently stable snow-packs is that a weak horizon occasionally occurs within an otherwise stable profile. These may be the layer boundaries described earlier (see Stratigraphy) or of some other origin. These produce anomalous avalanches such as one on 23 February 1979, which occurred on a profile showing the typical “stable” characteristics described above. A weak horizon existed near the surface at a depth of 50 cm, as shown in Figure 13, and the pit was dug the day after the avalanche had fallen Anomalies such as this account for 18% of all avalanches; i.e. out of a total of 98 avalanches analyzed 17 occurred in “non-avalanche” weather and in snow-packs which were stable but for this type of horizon. These anomalies apart, the differences outlined above between stable and unstable conditions seem to be reliable indicators of avalanche and non-avalanche conditions.

Fig. 13. Anomalous avalanche activity caused by a weak zone at intermediate depth in the snow-pack.
Conclusions
The paper has presented data on the snow cover of the Scottish Highlands and in the process has shown that this differs in many ways from the snow covers of more continental and alpine areas. Mainly as a result of higher temperatures, rapid densification occurs which tends to cause a stable snow-pack comprised largely of coarse-grained equi-temperature and melt-freeze snow, with soft and hard slabs of wind-damaged snow at the top. A fairly deep snow-pack coupled with the infrequency of prolonged cold spells with temperatures below −10° C limits the effect of temperature-gradient metamorphism, and depth hoar is very unlikely to develop in an average winter. Ice layers are common in the snow profile.
Avalanche activity occurs in response to cold periods during which maximum temperatures do not exceed −4° C. Snow density remains relatively low in the surface layers (about 200-250 kg m−3 ) and ram penetration resistance may be only 20-30 kg. In addition, thaw periods may result in the development of slush zones supported above ice layers and ram resistance may fall below 15 or 20 kg. Wet-snow avalanches fall at such times. Direct-action avalanches are also common in the Cairngorms although there is a paucity of observations. Finally, the occurrence of planes of weakness in otherwise stable snow-packs lends a large element of uncertainty to the prediction of avalanches in Scotland.
Acknowledgements
The authors wish to express their appreciation for assistance received from staff at Glenmore Lodge Outdoor Sports Centre over several years. R.G.W. Ward carried out his research whilst he was in receipt of a grant from the United Kingdom Natural Environment Research Council, David E. Sugden made many useful suggestions for improving the manuscript.


