1. Introduction
The Tibetan Plateau and surroundings have the largest number of glaciers outside the polar regions (Reference YaoYao, 2008). As a result of climate warming, many Tibetan glaciers have retreated in recent years (Reference Ren, Jing, Pu and QinRen and others, 2006; Reference Yao, Pu, Lu, Wang and YuYao and others, 2007; Reference Du, Qin, Liu and WangDu and others, 2008; Reference Zhang, Xiao and QinZhang and others, 2009). Glaciers are an important source of water (Reference HockHock, 2005), especially in arid regions (Reference Mayer, Lambrecht, Smiraglia and DiolaiutiMayer and others, 2006), and a loss of glacial mass balance has impacts on local water resources. The surface energy balance (SEB) physically describes the melting process, and the relationship between climate change and glacier ablation can be established using SEB models (Reference OerlemansOerlemans, 1991). It is important to understand how glaciers respond to climate change and how glacier ablation influences water resources. To investigate the effect of climate change on glaciers, SEB experiments have been carried out on the Antarctic ice sheet (e.g. Reference Van den Broeke, Van As, Reijmer and Van de WalVan den Broeke and others, 2004a; Reference Hoffman, Fountain and ListonHoffman and others, 2008; Reference Kuipers Munneke, Van den Broeke, King, Gray and ReijmerKuipers Munneke and others, 2012), the Greenland ice sheet (e.g. Reference OerlemansOerlemans, 1991; Reference Van AsVan As, 2011) and on mountain glaciers in other parts of the world (e.g. Reference Wagnon, Sicart, Berthier and ChazarinWagnon and others, 2003; Reference Favier, Wagnon, Chazarin, Maisincho and CoudrainFavier and others, 2004; Reference Mölg and HardyMölg and Hardy, 2004).
There are many glaciers in the high-altitude regions of China, and, to date, SEB experiments have been conducted in the Tien Shan (Reference Li, Liu and ZhangLi and others, 2007), the Tanggula mountains (Reference Zhang, Yao, Pu, Ohata, Yabuki and FujitaZhang and others, 1996), the Qilian mountains (Reference ChenChen and others, 2007; Reference JiangJiang, 2008), the Himalaya (Reference Yang, Qin, Zhang, Kang, Qin and LiuYang and others, 2010) and on the southeastern Tibetan Plateau (Reference YangYang and others, 2011). Results of these studies have shown that glacial SEB differs in different regions, depending on characteristics of the local climate. The SEB experiment conducted as part of the present study will help us to understand the relationship between changing climate and glacial melt in the western Qilian mountains.
Many different parameterization schemes for bulk transfer coefficients have been used in studies of turbulent fluxes (Reference AndreasAndreas, 1987; Yang and others, 2002; Reference Sheng, Mao, Li, Zhang, Sang and PanSheng and others, 2003), but the bulk-aerodynamic method for calculating sensible and latent heat fluxes can introduce errors in the calculation of the SEB. It is therefore important to measure the turbulent exchange between the atmosphere and glacier surfaces using an eddy-covariance system (Reference HockHock, 2005). To improve understanding of melting on a continental glacier in the arid and high-altitude region of northwestern China, we carried out a SEB experiment at 4550 ma.s.l. in the ablation zone of Laohugou glacier No. 12, Qilian mountains.
In this study, turbulent fluxes calculated using the bulk-aerodynamic method were corrected by observations from an eddy-covariance system, and the simulation of the SEB was validated with ablation data. We quantify the components of the glacier surface energy budget in the ablation zone during the observation period 1 June–30 September 2011. We discuss the impact of daily positive accumulated temperature, albedo, precipitation and incoming and reflected shortwave radiation fluxes on glacier melt. We also conduct a climate sensitivity test using changed meteorological variables in the SEB model. The results of our research quantify the error in turbulent fluxes at the glacier surface induced by the bulk-aerodynamic method and are used to analyze the characteristics of components of SEB in the ablation zone of the glacier in the arid and high-altitude region of northwestern China.
2. Study Area
The Laohugou valley is situated in an area outside the monsoon region, is characterized by a typical continental climate and is influenced by westerly winds all year round. Summer is short, the mean annual air temperature is >0°C and precipitation occurs mainly from May to September (Reference Wang, Liu, You, Pu, Yang and TianWang and others, 1981). Recent studies have shown that the regional climate tends to become warmer and moister, and the glaciers are shrinking (Reference Du, Qin, Liu and WangDu and others, 2008). Laohugou glacier No. 12 (39826.40 N, 96832.50 E; Fig. 1) is the largest valley glacier in the Qilian mountains. It has two tributaries and is 9.85 km long, with a total area of 20.4 km2 (Reference Du, Qin, Liu and WangDu and others, 2008) and an altitudinal range of 4260–5481 ma.s.l. (Reference Liu, Qin, Du, Sun and HouLiu and others, 2010). The physical characteristics of Laohugou glacier No. 12 make it the most typical continental glacier in the Laohugou valley (Reference Wang, Liu, You, Pu, Yang and TianWang and others, 1981).
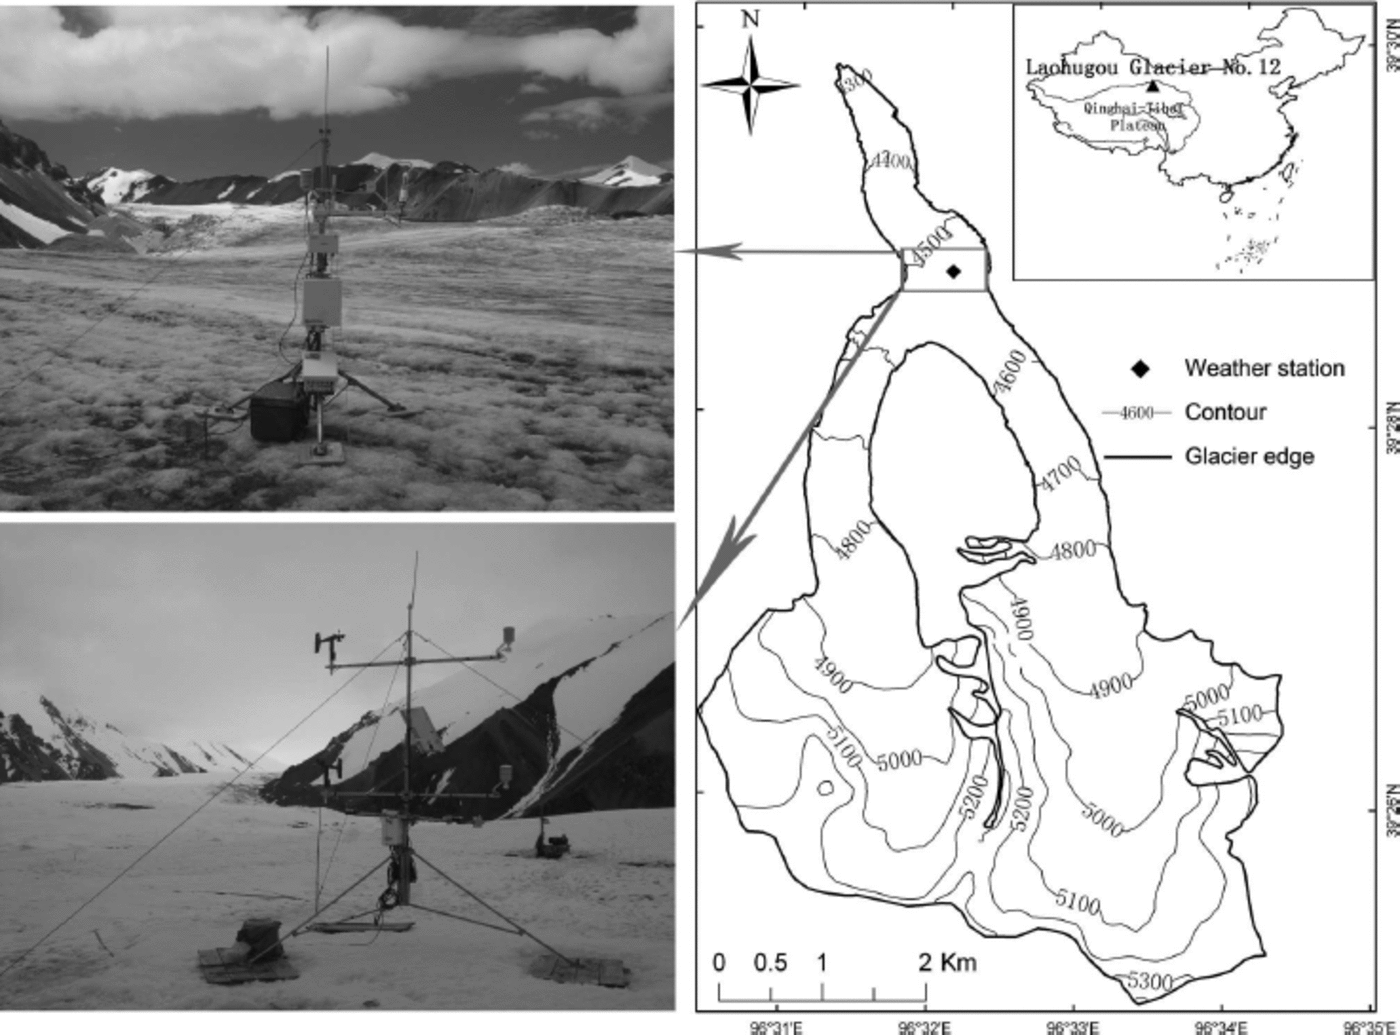
Fig. 1. Location of the AWS and the eddy-covariance system on Laohugou glacier No. 12, Qilian mountains. Contours are in meters.
3. Materials and Methods
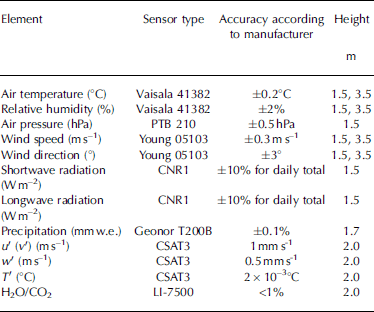
An automatic weather station (AWS; Table 1) was set up on a relatively flat surface in the ablation zone of Laohugou glacier No. 12 (39828.70 N, 96832.10 E; 4550m a.s.l.; Fig. 1), and the station was visited every 3–5 days during the field investigation period. We recorded air temperature, humidity and wind speed and direction at two levels (1.5 and 3 m height), and air pressure, incoming and reflected shortwave radiation, and incoming and outgoing longwave radiation at one level (1.5 m). Precipitation (mm w.e.) was measured using an all-weather precipitation gauge (Geonor T-200B) without heating. Sensors were connected to a data logger (CR1000, Campbell Scientific Inc., USA) with a low temperature resistance (–55°C), which recorded the half-hourly mean of the measurements taken every 10 s. The eddy-covariance turbulence was measured by a CSAT3 three-dimensional sonic anemometer (Campbell Scientific Inc.) and a LI-7500 open path gas analyzer (Li-Cor Inc., USA), which were connected to a data logger (CR3000, Campbell Scientific Inc.) with a low temperature resistance (–55°C). All raw turbulence data were collected at 10 Hz. Nine plastic ablation stakes were installed near the AWS to measure glacial ablation, and measurements were made each time the AWS was checked. We also carried out intensive observations during late July and throughout August 2011. Observations were made at 08:00 Beijing Time (BJT; 1 h 34 min earlier than local time at the AWS) and BJT was used throughout this study. All measurements were converted to mm w.e. using a density of 890 kg m– 3 for ice (Reference Mölg and HardyMölg and Hardy, 2004).
Table 1. Technical parameters and installation heights of sensors on the AWS
The SEB can be expressed as follows (all fluxes are in Wm– 2 , and defined as positive when directed towards the surface):
where Q M is the melting energy (positive) or freezing energy (negative). S is the incoming shortwave radiation, S is the reflected shortwave radiation, and L j and L ↑ are the incoming and outgoing longwave radiation, respectively. H and LE are sensible and latent heat fluxes, respectively, and Q G is subsurface heat flux. The SEB was calculated at half-hourly intervals.
The components of radiation were measured directly from the AWS. Snow cover and rime formation on the dome of radiation sensors and low sun angle can affect radiation measurements (Reference Van den Broeke, Van As, Reijmer and Van de WalVan den Broeke and others, 2004b). Therefore, the components of radiation were corrected using the method of Reference Van den Broeke, Van As, Reijmer and Van de WalVan den Broeke and others (2004b). The cloud factor n (nondimensional), representing diurnal values of cloudiness from 6:30 to 18:30 BJT, was estimated using the method described by Reference SicartSicart (2002) and Reference Favier, Wagnon, Chazarin, Maisincho and CoudrainFavier and others (2004). The value of n was calculated from the ratio of S . to solar radiation from the top of the atmosphere (S TOA; W m–2) using n = 1.3-1.4(S ↓ /S TOA). S T OA was calculated using the method of Reference Duffie and BeckmanDuffie and Beckman (1991).
In the present study, the turbulent fluxes measured at the glacier surface were used by the eddy-covariance system. Using the software EdiRe developed by the University of Edinburgh, UK (http://www.geos.ed.ac.uk/abs/research/micromet/EdiRe/), the raw eddy-covariance data were corrected. The correction involved despiking, coordinate rotation, time delay correction, frequency response correction and Webb-Pearman-Leuning (WPL) correction (Kyaw and others, 2000). We carried out a series of quality-control steps, stationarity and steady-state tests, and classified the data quality (Reference Lee, Massman and LawLee and others, 2004). Highly accurate turbulent fluxes were acquired, and the mean diurnal variation method was used to fill data gaps (see Reference SunSun, 2012). The calculated turbulent fluxes were obtained using the bulk-aerodynamic method (e.g. Reference OkeOke, 1987), including stability correction (Reference DyerDyer, 1974; Reference Holtslag and de BruinHoltslag and de Bruin, 1988), based on the Monin-Obukhov similarity theory (Reference SunSun and others, 2012). The calculated turbulent fluxes were used to investigate the SEB on Laohugou glacier No. 12.
During the melting period, the glacier surface was predominantly ice, and became rough because surface dust caused the ice to melt unevenly. The monthly mean values of the surface roughness length for momentum Z 0m determined from the eddy-covariance system were 1.2, 1.8, 1.4 and 1.3 mm for June, July, August and September, respectively. In addition, the surface roughness lengths for temperature Z0t and humidity Z0q were parameterized using the method of Yang and others (2002), which was recommended by Reference GuoGuo and others (2011) and evaluated by three candidate approaches separately suggested by Reference AndreasAndreas (1987), Yang and others (2002) and Reference Smeets and Van den BroekeSmeets and Van den Broeke (2008).
The subsurface heat flux Q
G is estimated from the temperature-depth profile and is given by ![]() where kT
is the thermal conductivity, 0.4Wm–1 K–1 for old snow and 2.2Wm–1K-1 for pure ice (Reference OkeOke, 1987). The observed temperature of –4.2°C at 15 m depth was relatively stable from 1 June to 30 September 2011. At half-hourly intervals, condensation and sublimation/evaporation MS
was calculated from the latent heat flux LE, and the surface melt M was computed from the melting energy Q
M (Reference SunSun and others, 2012). Measured precipitation was corrected following the method of Reference Yang, Ishia, Goodison and GuntherYang and others (1999). According to the daily mean air temperature, precipitation type was classified as snow (<-2°C), mixed (-2 to 2°C), or rain (>2°C) (Reference Yang, Shi, Kang, Zhang and YangYang and others, 1991; Reference Zhang, Ohata, Yang and DavaaZhang and others, 2004).
where kT
is the thermal conductivity, 0.4Wm–1 K–1 for old snow and 2.2Wm–1K-1 for pure ice (Reference OkeOke, 1987). The observed temperature of –4.2°C at 15 m depth was relatively stable from 1 June to 30 September 2011. At half-hourly intervals, condensation and sublimation/evaporation MS
was calculated from the latent heat flux LE, and the surface melt M was computed from the melting energy Q
M (Reference SunSun and others, 2012). Measured precipitation was corrected following the method of Reference Yang, Ishia, Goodison and GuntherYang and others (1999). According to the daily mean air temperature, precipitation type was classified as snow (<-2°C), mixed (-2 to 2°C), or rain (>2°C) (Reference Yang, Shi, Kang, Zhang and YangYang and others, 1991; Reference Zhang, Ohata, Yang and DavaaZhang and others, 2004).
4. Results
4.1. Meteorological conditions
Meteorological data for the observation period are shown in Figure 2. The mean air temperature and the standard deviation were –0.4°C and 2.9°C, respectively. The daily mean air temperature remained relatively low in early June and increased gradually after 12 June, to >0°C. There were 56 days when the daily mean air temperature was >0°C, mainly in July and August. Air temperature decreased rapidly in September, and was <0°C after 3 September. Relative humidity fluctuated more than air temperature. The maximum relative humidity was 100%, the minimum was 29% and the daily mean was 65%, with a standard deviation of 18%. Daily mean wind speed varied between 0.7 and 3.7ms– 1 , with a standard deviation of 0.6m s–1, and there was a negative correlation between wind speed and relative humidity (r = –0.51, p < 0.01). Precipitation, which affected glacial surface albedo and ablation, occurred on 50 days and totaled 225.6 mmw.e. during the observation period. Mixed precipitation and rain predominated, accounting for 80% of total precipitation, and the snow accumulation was only 44.2 mmw.e., occurring mainly in June and September. Incoming shortwave radiation is affected by cloud, and values during the observation period ranged from 72 to 404Wm– 2 , with a daily mean of 246Wm– 2 . The cloud factor, which varied between 0.12 and 1, also influenced surface energy budget and glacier ablation.

Fig. 2. Daily mean values of air temperature (a), relative humidity (b), wind speed (c), precipitation (d), incoming shortwave radiation (e) and cloud factor (f) in the ablation zone of Laohugou glacier No. 12 from 1 June to 30 September 2011.
4.2. Simulated validation of glacial ablation
The turbulent heat fluxes calculated using the bulk-aerodynamic method were validated with measurements from the eddy-covariance system. Comparisons of the calculated and measured daily mean values of H and LE are shown in Figure 3 . The calculated values were closely correlated with the measured values, with r = 0.88 for both sensible and latent heat fluxes. Through comparison with absolute values for turbulent fluxes, the calculated H and LE were underestimated slightly by 3.4 and 1.2 W m–2, respectively, less than the root-mean-square errors (RMSE) for H and LE by 5.4 and 6.5 W m–2, respectively. Generally, glacial surface roughness lengths are considered to be constant in the calculation of turbulent fluxes using the bulk-aerodynamic method. However, there were obvious changes on the glacial surface during the ablation period, which may explain the differences between the calculated and measured values of H and LE.

Fig. 3. Relationship between calculated and measured sensible and latent heat fluxes. The solid lines are the 1 : 1 line.
To validate the SEB simulation, we compared the observed and modeled daily accumulated mass balance (Fig. 4). Ablation was estimated using the aperiodic measurements at nine ablation stakes. From 1 June to 14 July 2011, mass balance decreased slowly and then decreased rapidly because of strong ablation. On 3 and 4 August, ablation on the glacier was halted by a precipitation event. After 3 August, glacial ablation increased rapidly, and after 3 September the changes in mass balance were minimal because of weak ablation. During the ablation period, the total modeled mass balance was –1703mmw.e. at the the AWS location, exceeding the mass balance measured at the surrounding stakes by 90 mmw.e. This difference is acceptable given the standard deviations of the ablation measurements from the nine ablation stakes (Fig. 4). The SEB model can therefore generate an acceptable simulation of mass balance. Compared with the measured values, the calculated turbulent heat fluxes (H+ LE) were underestimated by 2.2 W m–2, and this led to the underestimation of mass balance by 51 mmw.e. which was smaller than for the measured mass balance at the surrounding stakes. Therefore, the underestimation of turbulent fluxes had little effect on the estimation of mass balance.
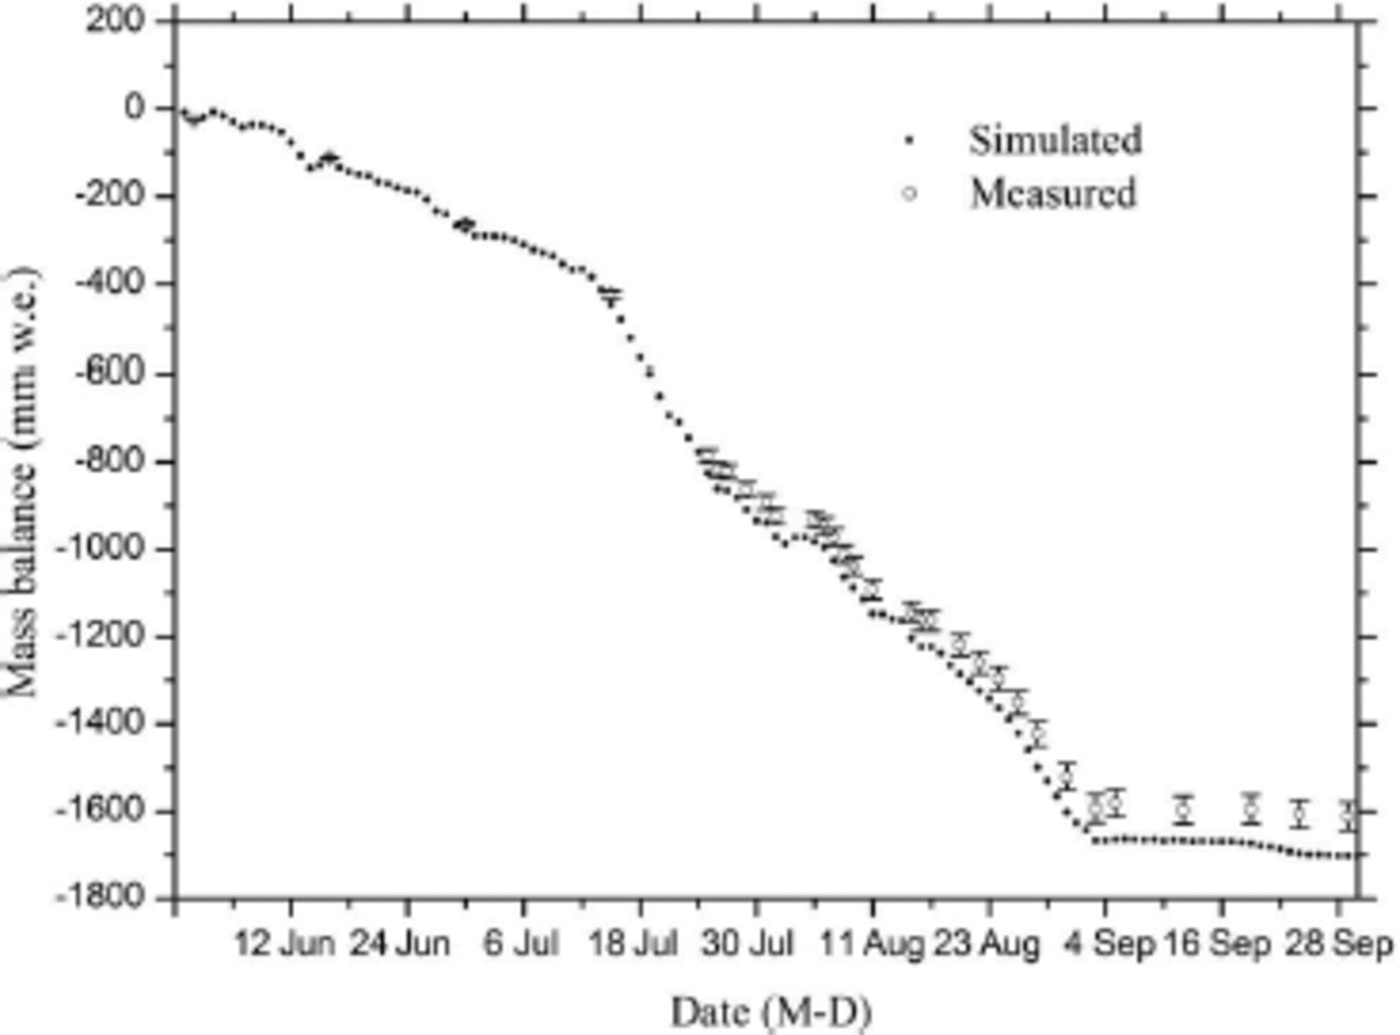
Fig. 4. Simulated and measured daily accumulated mass balance from 1 June to 30 September 2011. Error bars indicate the standard deviations of measured mass balance.
4.3. Glacial surface energy fluxes
The diurnal variations in incoming shortwave radiation S ↑ and reflected shortwave radiation S ↑, incoming longwave radiation L ↓ and outgoing longwave radiation L ↑, and net radiation Compared to L ↓ and L ↑ , which varied little across the day, S ↓ and S ↑ and Rn at the glacier surface are shown in Figure 5. Compared to L ↓ and L ↑, which varied little across the day, S ↓ and S ↑ and Rnfollowed a characteristic diurnal cycle. Shortwave radiation fluxes reached maximum levels between 12:00 and 14:00 BJT then decreased slightly until sunset. Net radiation became negative at night and reached a maximum at 14:00 BJT, showing a lag compared with the shortwave radiation fluxes. Under the influence of air temperature and surface glacial temperature, the values of incoming longwave radiation L ↓, and outgoing longwave radiation L ↑ during the daytime were larger than during the night, following a trend similar to air temperature and surface temperature.
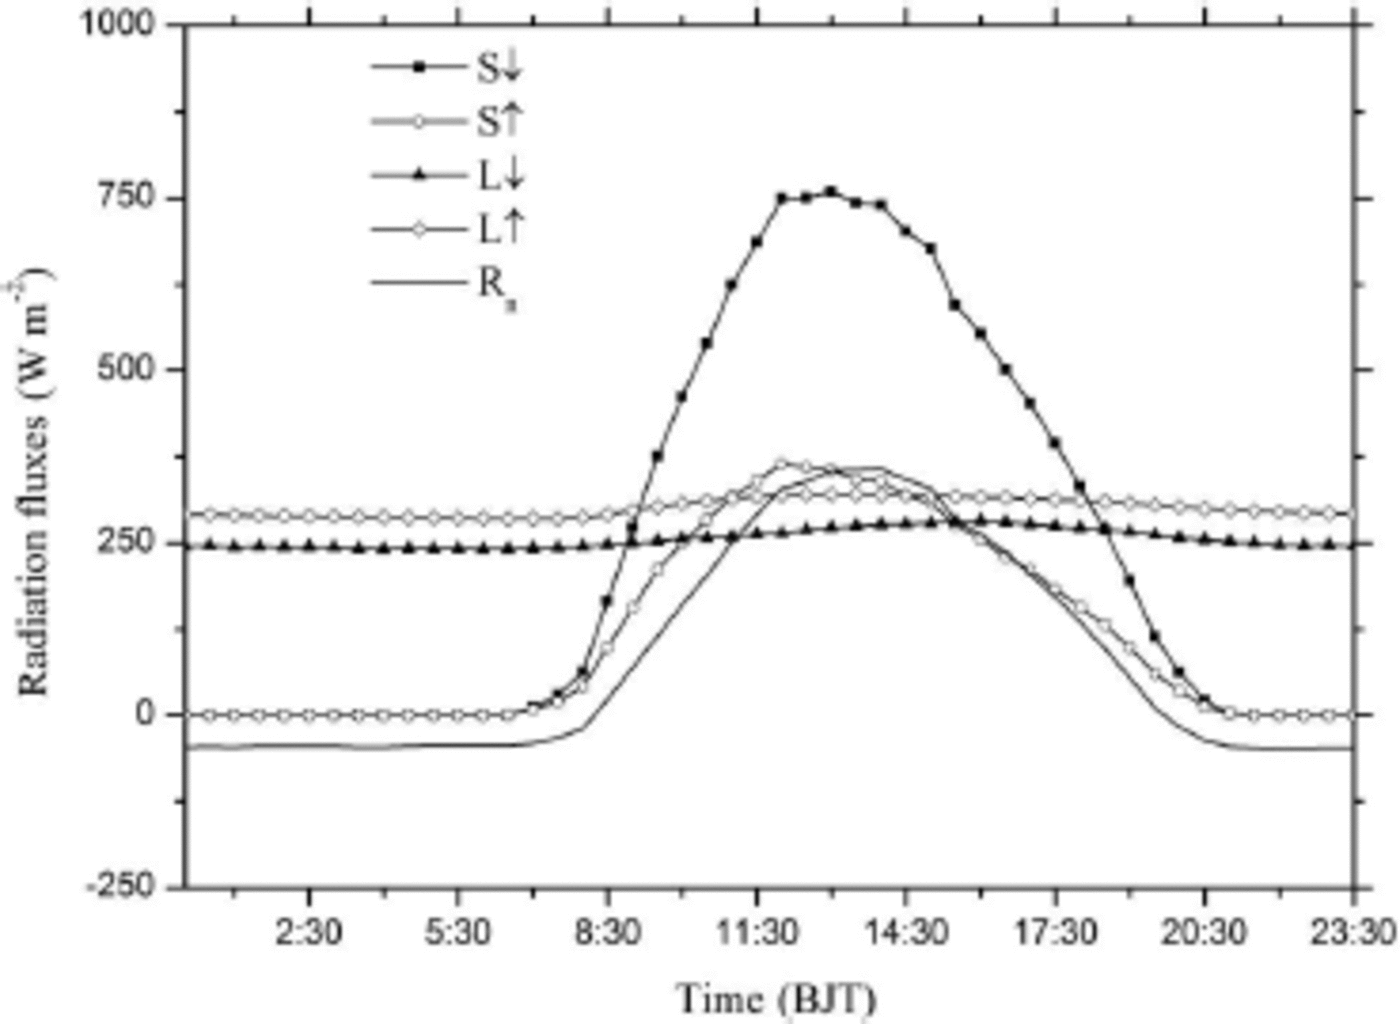
Fig. 5. Diurnal cycles of mean incoming and outgoing shortwave radiation (S ↓ and S ↑), mean incoming and outgoing longwave radiation (L ↓ and L ↑) and mean net radiation (R n) in the ablation zone of Laohugou glacier No. 12 from 1 June to 30 September 2011.
Mean diurnal cycles of temperature, relative humidity, wind speed, Richardson number and turbulent fluxes are shown in Figure 6. After sunrise, S ↓ increased, and the increase in glacial surface temperature was larger than the increase in air temperature, meaning that the difference between them decreased (Fig. 6a). Because specific humidity depends on temperature, the increase in glacial surface specific humidity after sunset was larger than the increase in air specific humidity, which gave rise to an increased difference between glacial surface and air humidity (Fig. 6b). Wind speed had a clear diurnal cycle, and reached a maximum at 17:00 BJT (Fig. 6c). The stratified atmosphere over the glacier surface is generally stable (Rib≥0.02), and tended to a neutral condition as the glacial surface temperature increased (Fig. 6d). The effect of wind speed on the sensible heat flux H was evident (r=0.86, p<0.01), and H reached a maximum of 11 Wm– 2 at the same time as wind speed reached a maximum (Fig. 6e). The latent heat flux LE reached a maximum of 36Wm– 2 at 13:30 BJT, under the influence of the difference between air and glacial surface specific humidity (Fig. 6e). The turbulent exchange between the glacial surface and the atmosphere reached a maximum of 30 Wm– 2 at 12:30 BJT (Fig. 6f). LE varied markedly compared with H. Although H and LE can cancel each other out, the turbulent fluxes on the glacier followed an obvious diurnal cycle, which was controlled by LE.
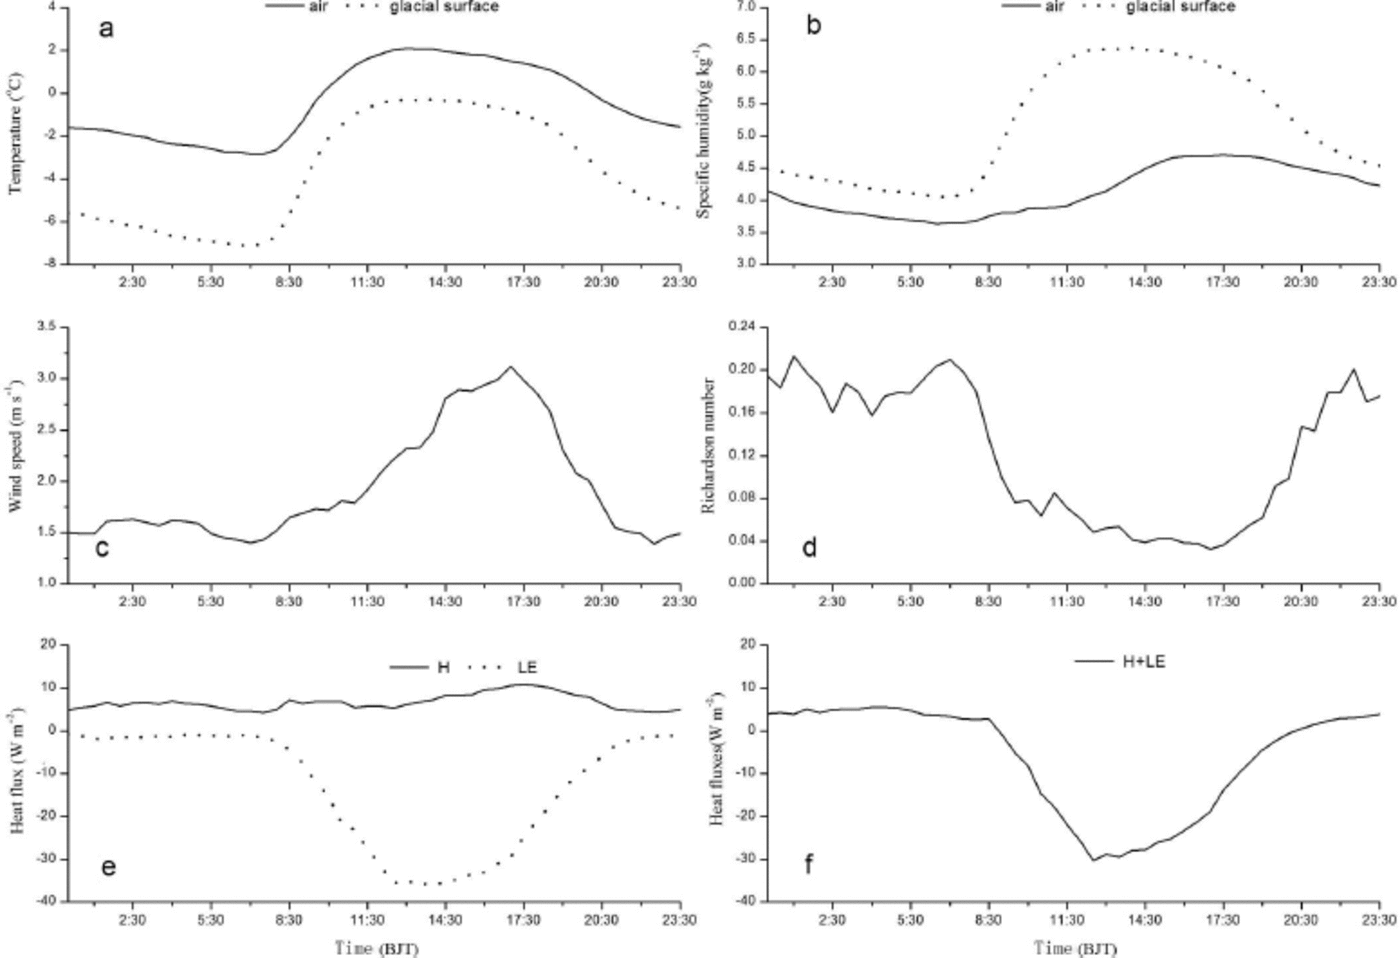
Fig. 6. Mean diurnal cycles of air and glacial surface temperature (a), air and glacial surface specific humidity (b), wind speed (c), Richardson number (d), sensible (H) and latent (LE) heat fluxes (e) and the sum of sensible and latent heat fluxes H + LE (f) in the ablation zone of Laohugou glacier No. 12 from 1 June to 30 September 2011.
4.4. Glacial surface energy budget
The daily mean values of the surface energy components net shortwave radiation (S) and net longwave radiation (L), sensible (H) and latent heat fluxes (LE), subsurface heat (Q G) and melting energy (Q M) are shown in Figure 7. The mean values of S varied more than the mean values of L, and the standard deviation of S was 69 W m–2, twice as large as the standard deviation of L. Mean values of S were larger than mean values of L, averaging 126 and –45 W m–2, respectively. The maximum value of S was 308Wm–2, and the minimum value of L was –98Wm–2 . Most of the time during the experiment, the atmosphere transported heat towards the glacier surface in the form of H. Turbulent heat transport in the opposite direction occurred only on 3 and 4 June. Values of LE were negative almost continuously, and evaporation/ sublimation predominated. During the observation period condensation/sublimation occurred rarely, only on 2 and 3 July. The standard deviations of H and LE were 4.3 and 9.7Wm–2 , respectively, and the daily means were 6.5 and –12.7 W m–2, respectively. The melting energy Q M, which was largest in July and August, fluctuated markedly. The maximum of 254Wm–2 occurred on 25 July, and the daily mean during the observation period was 76 W m–2. After 3 September, glacier melting almost ceased. Compared to other energy components, Q G was very small, with a daily mean of –0.2Wm–2 and a maximum and minimum of 1.4 and –0.9 W m–2, respectively. Generally, the Q G can be neglected in the calculation of glacial SEB.
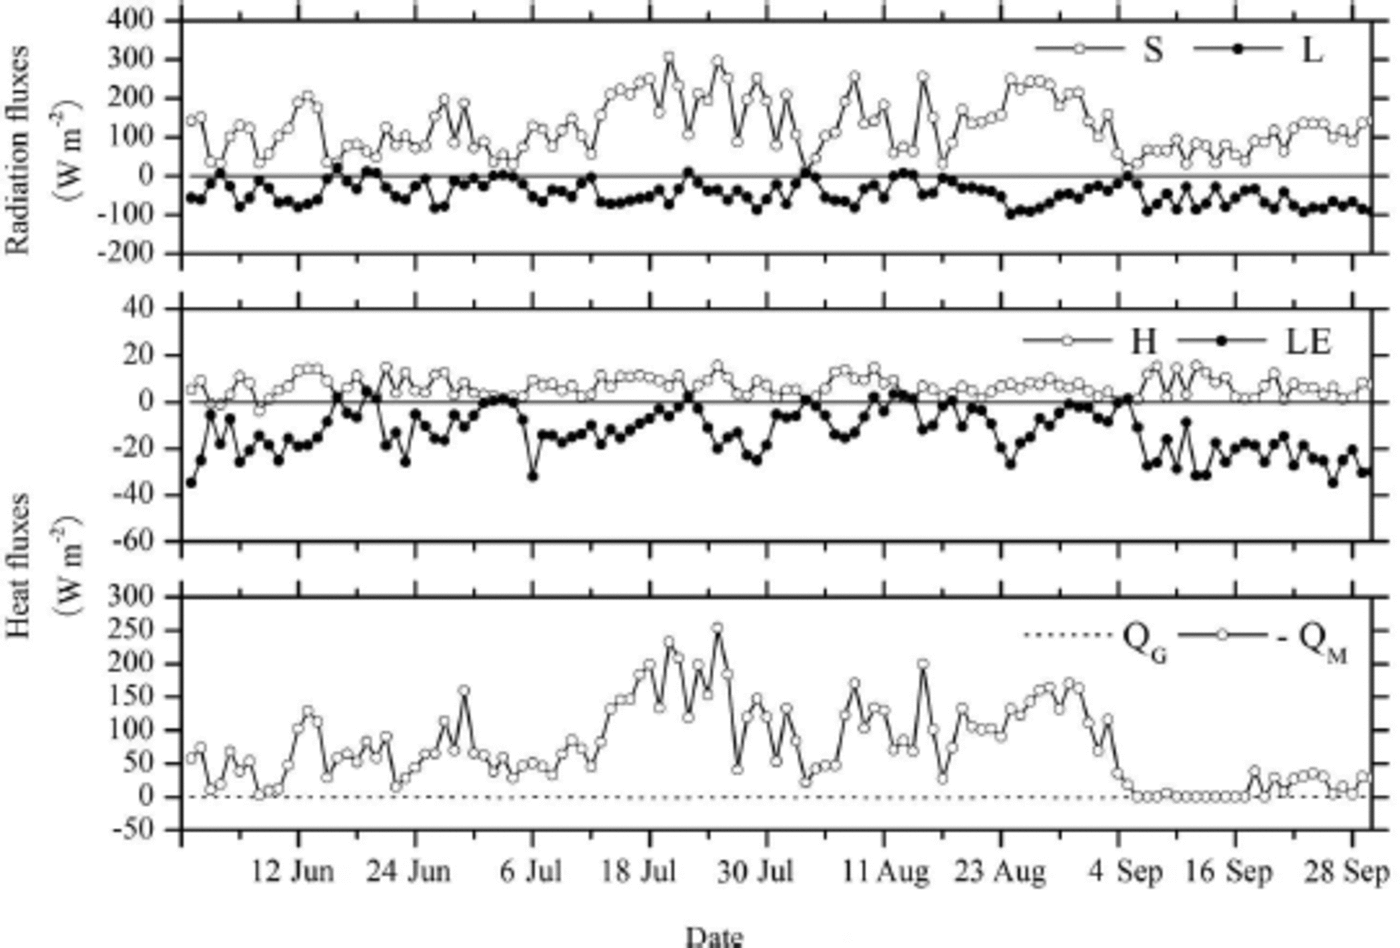
Fig. 7. Daily mean variations of net shortwave radiation (S), net longwave radiation (L) sensible and latent heat fluxes (H and LE), subsurface heat flux (Q G) and melting energy (Q M) in the ablation zone of Laohugou glacier No. 12 from 1 June to 30 September 2011.
Based on the SEB model and the values of the individual energy components, the glacial surface energy budget was estimated (Table 2). Of the inputs to the surface energy budget, net shortwave radiation S was higher in July and August than in other months, exceeding 150Wm– 2 . In all months of the observation period, S represented >90% of the energy sources, complemented by sensible heat flux H, with a share of <10%. Therefore, S was the principal heat source, followed by H. Of the energy sinks in the surface energy budget, net longwave radiation L ↓ varied little in June, July and August. In September, L ↑ was more negative because incoming longwave radiation L ↓ decreased relative to outgoing longwave radiation L ↑ , as a result of decreasing air temperature, specific humidity and cloud cover. Compared with L, the monthly means of latent heat flux LE were small and varied between –7 and –19.7Wm–2 . LE therefore represented the smallest energy sink. During the intensive ablation period in July and August, the mean melting energy Q M exceeded 100Wm–2 , and made up 68% of the total energy, greater than the contributions of L and LE combined.
Table 2. Surface energy budget (Wm–2) in the ablation zone of Laohugou glacier No. 12 from 1 June to 30 September 2011

Glacial melt is a complex process affected by many factors. To understand the response of Laohugou glacier No. 12 to climate forcing, the influence of several meteorological quantities and energy components (daily sum of positive temperature at half-hourly intervals, albedo, precipitation, net shortwave radiation S and net longwave radiation L) on the melting energy Q M was investigated. The results are shown in Figure 8. Glacial melt was generally controlled by air temperature, and there was a close relationship between the Q M and positive accumulated temperature (r= 0.86, n= 122, p< 0.01). The Q M increased as positive accumulated temperature increased. For instance, on 21 July, the Q M reached a high value of 208Wm–2 when daily positive accumulated temperature reached a maximum of 254.5°Cd–1. However, strong melting also occurred when positive accumulated temperature was low. For instance, on 15 August, when the daily positive accumulated temperature was just 47.6°C d–1, the Q M reached 199Wm– 2 . This can be explained by a low albedo with large net radiation of 206Wm–2.
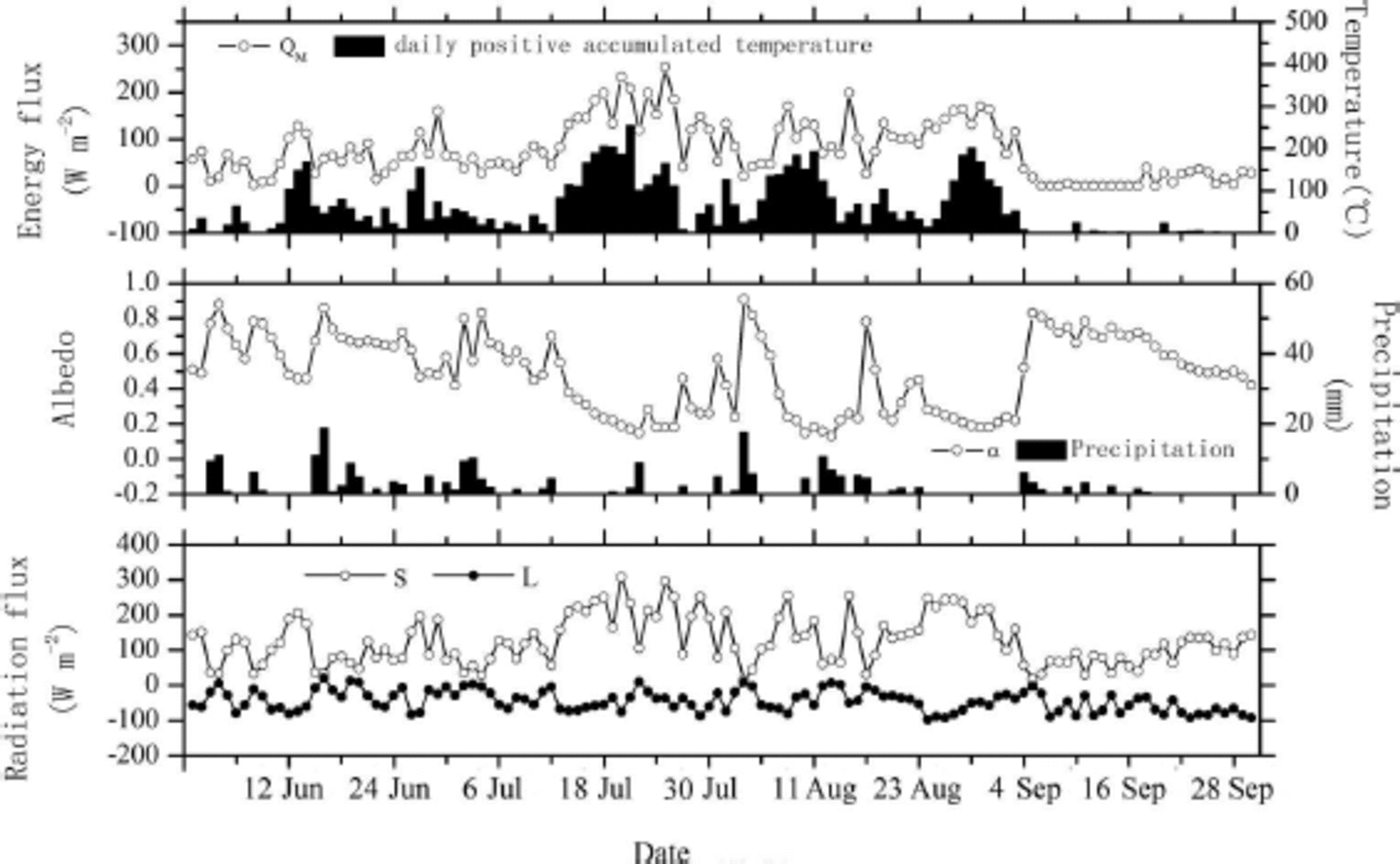
Fig. 8. Daily positive accumulated temperature, precipitation and daily mean values of melting energy (Q M), albedo (a), net shortwave (S) and longwave (L) radiation in the ablation zone of Laohugou glacier No. 12 from 1 June to 30 September 2011.
S was significantly larger than L (Fig. 8), and S was the principal heat source of the surface energy budget (Table 2). We can therefore conclude that the energy used for melting Q M was also influenced by net shortwave radiation S, and there was a significant positive correlation between melting energy and net shortwave radiation (r = 0.87, n = 122, p < 0.01). Figure 8 also shows that albedo on the glacial surface had an impact on S, which increased as albedo decreased, and there was a significant negative relationship between albedo and shortwave radiation (r = –0.76, n= 122, p< 0.01). Albedo therefore influenced the Q M by controlling S. There was a significant negative correlation between glacier melting and albedo (r = –0.80, n= 122, p < 0.01), with an increase in glacier melting with decreasing albedo.
After solid or mixed solid–liquid precipitation occurred, air temperature decreased, albedo increased sharply and S decreased, causing the melting energy to decrease. For example, the albedo rose from 0.49 on 2 June to 0.88 on 4 June, which reduced the S from 151 Wm– 2 to 33Wm–2, and at the same time, the Q M decreased from 74Wm–2 to 19W m–2. However, after rain events, there was only a small change in the surface albedo or the melting energy. For example, on 12 and 1 3 August, albedo decreased from 0.16 to 0.13 and Q M increased from 71 Wm– 2 to 85 Wm– 2. During the observation period, the maximum glacial melting occurred on 25 August, when Q M reached 254 Wm– 2 with a daily positive accumulated temperature of 166.3°C d–1 and an albedo of 0.18. Under the influence of dust on the glacial surface, the minimum albedo of 0.13 occurred on 13 August. It was the low albedo caused by dust on the glacier surface that led to rapid glacial melting.
5. Discussion
Turbulent fluxes are important variables in the calculation of glacial SEB (Reference Brock, Mihalcea, Kirkbride, Diolaiuti, Cutler and SmiragliaBrock and others, 2010). Instrumentation errors can lead to errors in the measurement of radiation fluxes of up to 10%, which can have a significant effect on mass-balance calculations (Reference Van den Broeke, Van As, Reijmer and Van de WalVan den Broeke and others, 2004b). We changed meteorological variables in the model to estimate uncertainties in the calculation of mass balance. The sensitivity of mass balance to uncertainties in the meteorological variables is presented in Table 3. Based on information on the accuracy of instruments provided by the manufacturer, values for the different input parameters for the SEB model were adjusted as shown in Table 3. Changes in air temperature T a, glacier surface temperature T s and relative humidity RH lead to changes in turbulent fluxes of <10% and changes in mass balance of <2%. On the other hand, H was sensitive to changes in wind speed ws. Changes in ws resulted in maximum changes in mass balance, ±33.5mmw.e., although the mass balance only varied by 2%. The selection of roughness lengths is critical for the calculation of turbulent fluxes. When we assumed that the surface roughness length for momentum Z 0m increased by 1 mm (or by a factor of 3), H and LE increased by up to 22%. However, the effects on mass balance were still small, with a variation of <1%, because the changes in H and LE cancelled each other out. When we hypothetically changed net shortwave radiation S, net longwave radiation L and net total radiation Rn by 10%, the largest variation in mass balance (18.6%) was caused by the change in S and the smallest (<10%) was caused by L. When albedo was varied by 0.1, S changed by 24.6 Wm–2 and mass balance changed by 620 mmw.e., which was up to 36.4% of the total mass balance.
Table 3. Sensitivity of mass balance to uncertainty in parameter values and meteorological variables
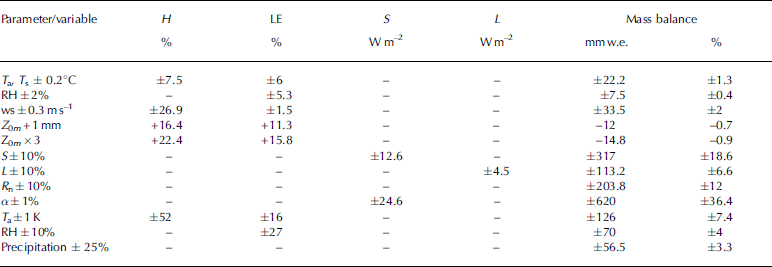
We also carried out a climate sensitivity test on the model (Table 3). When T a was changed by 1 K, H changed by up to 52% and mass balance changed by 126 mmw.e. (<10%). Based on RH changed by 10%, the perturbations of mass balance were only 70 mmw.e. (4%). When precipitation was varied by 25%, there was no obvious change in mass balance because the effect of glacier melting on mass balance during the summer observation period was larger than that of precipitation.
The surface energy budget in the accumulation zone differed from the surface energy budget in the ablation zone. The net radiation R n and the melting energy Q M in the ablation zone were three times larger than in the accumulation zone. The reasons for these differences are the higher air temperatures, lower snowfall and lower albedo in the ablation zone. Although there was little difference in LE, the turbulent heat fluxes (H+LE) in the ablation zone were stronger than those in the accumulation zone. This was a result of the atmospheric instability caused by non-uniform heat distribution between T a and T s.
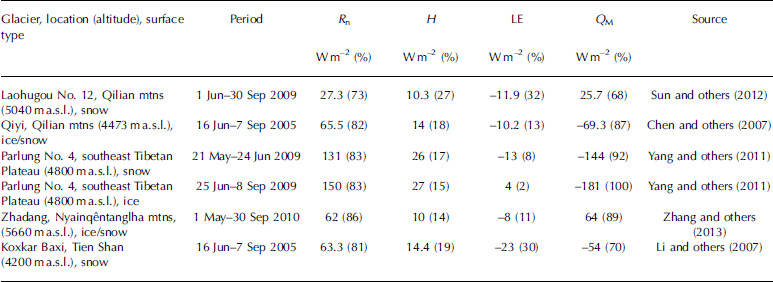
Although direct comparisons with studies of other glaciers are difficult because the observation periods do not overlap, some general statements can be made. The results of the present study showed that Rn was the most important energy source for melting at Laohugou glacier No. 12. Net radiation provided 93% of the energy for melting, a value that agrees well with the results of studies carried out on other valley glaciers (Table 4): 82% for Qiyi glacier, 83% for Parlung No. 4 glacier, 86% for Zhadang glacier and 81% for Koxkar Baxi glacier. The values of R n and turbulent heat fluxes on Laohugou glacier No. 12 were similar to those on Qiyi, Zhadang and Koxkar Baxi glaciers but smaller than on the Parlung No. 4 glacier, a result of the higher latitude, lower temperature and smaller incoming shortwave radiation on Laohugou glacier No. 12.
Table 4. Comparisons of surface energy budget on different glaciers of China
6. Conclusions
To better understand the melting processes on a continental glacier in the arid region of northwestern China, we carried out a surface energy budget experiment at 4550 m a.s.l. in the ablation zone of Laohugou glacier No. 12. Variations in the components of the surface energy budget were analyzed, and turbulent fluxes calculated using the bulk-aerodynamic approach were corrected by observations from an eddy-covariance system. The main factors affecting glacial melting were identified, and climate change sensitivity tests were carried out. The simulated mass balance was –1703 mm w.e., 90 mmw.e. more than the observed value. Sensible and latent heat fluxes derived from the bulk-aerodynamic method underestimated fluxes directly measured from the eddy-covariance system by 3.4 and 1.2Wm–2, respectively. The results of this study indicate that net shortwave radiation S was the principal heat source (95%), followed by sensible heat flux H (5%), which agrees well with the results of studies carried out on other valley glaciers. Net longwave radiation L was the principal energy sink (37%), followed by latent heat flux LE (11%). Components of the surface energy budget varied significantly during the 4 month study period. High values of S resulted in rapid melting in July and August. In addition to daily positive accumulated temperature, low albedo was one of the most important factors causing accelerated glacier melting, and the minimum mean daily albedo of 0.13 occurred under the influence of glacial surface dust. Mass balance varied by 36% when albedo changed by 0.1. A climate change sensitivity test showed that the perturbations of mass balance were 126 and 56.5 mmw.e. respectively when air temperature and precipitation changed by 1K and 25% respectively.
Although turbulent fluxes calculated using the bulk-aerodynamic approach were corrected by measurements from the eddy-covariance system in this study, analysis using data from longer time series of directly observed turbulent fluxes is desirable. The process of energy exchange between the atmosphere and glaciers is complex, and to improve our understanding of this process, similar observations of energy balance should be carried out on other glaciers in the same and different areas.
Acknowledgements
We thank the scientific editor, Peter Kuipers Munneke, for English editing and suggestions. We thank Wei Yang and an anonymous reviewer for helpful comments on the manuscript. This study was supported by the Natural Science Foundation of China (No. 41071046, 41201067, 41201025 and 41371091), the Project from the State Key Laboratory of Cryospheric Sciences (SKLCS-OP-2013-01), the Doctoral Program Foundation of Higher Education, Ministry of Education of China (No. 20133704120006 and 20123704110006), National Training Programs of Innovation and Entrepreneurship for Undergraduates (201310445096), and the Opening Fund of Key Laboratory of Land Surface Process and Climate Change in Cold and Arid Regions, Chinese Academy of Sciences (LPCC201205).


