Previous studies have shown the relevance and importance of routinely monitoring dietary intake in patient care settings( Reference Monacelli, Sartini and Bassoli 1 – Reference Mowe, Bosaeus and Rasmussen 3 ). The objective of doing so is to minimise adverse clinical implications such as prolonged length of stay, increased health-care costs, inadequate dietary intakes, increased mortality and unnecessary food waste. There is therefore a clear rationale for the routine monitoring of dietary intake in hospitals. A range of policy documents such as the guidelines of the European Society for Parenteral and Enteral Nutrition recommend routine nutritional screening of patients at admission( Reference Kondrup, Allison and Elia 4 , Reference Kondrup, Rasmussen and Hamberg 5 ). This is to ensure that they are offered optimal levels of protein and energy. However, routine monitoring of dietary intakes of hospitalised patients, especially those at nutritional risk, remains a challenge in terms of the workload involved. Routine monitoring of food intake and the subsequent work involved when developing individual nutrition action plans is a time-consuming undertaking that risks being neglected in the busy everyday life of a hospital.
Traditional methods or tools for assessing dietary intake, such as 24 h recalls, FFQ and the weighed food method (WFM), have numerous drawbacks. These include the length of time involved, inaccurate data entry and patient recall, and difficulty estimating portion sizes. As a consequence, these methods are often neglected in hospital wards( Reference Ofei, Dobroczynski and Holst 2 , Reference Ngo, Engelen and Molag 6 ).
Recent developments in information and communications technology have created a range of new opportunities for automatising accurate data collection for food selection, food intake, plate waste analysis and simplifying the process of estimating portion size( Reference Ofei, Dobroczynski and Holst 2 , Reference Ngo, Engelen and Molag 6 – Reference Ashman, Collins and Brown 8 ). Information and communications technology has previously been applied in manual dietary assessment tools for the making of easy-to-use devices. This is believed to be an essential requirement for health-care professionals when choosing dietary assessment methods. Previous research has revealed that nurses, dietitians and other allied health professionals often neglect manual tools for monitoring, thereby limiting the possibility to identify patients with a poor food intake for nutritional care( Reference Mowe, Bosaeus and Rasmussen 3 ). Kubena explored the feasibility of using a barcode to improve the WFM( Reference Kubena 9 ). With this method, a food item is placed on a scale in a codebook and the barcode is scanned, automatically identifying the type of food and registering its weight( Reference Kubena 9 ). However, barriers relating to logistics, cost and the portability of the device were identified as limitations for developing this as a preferred method for widespread use in a hospital setting. Another method, which seems to have gained much interest from researchers conducting large-scale dietary assessment in an institutional setting, is the digital photographic method( Reference Monacelli, Sartini and Bassoli 1 , Reference Pouyet, Cuvelier and Benattar 10 , Reference Williamson, Allen and Martin 11 ). With this approach, a digital video camera captures and stores images of plate content before and after the meal. The images are then transferred to a screen and, using reference weights, experts can subsequently estimate portion sizes.
Several studies have reported the validity of using the visual observation and photographic methods for estimating protein and energy intakes against the WFM as suitable options for monitoring food intake in the health-care setting( Reference Monacelli, Sartini and Bassoli 1 , Reference Pouyet, Cuvelier and Benattar 10 , Reference Williamson, Allen and Martin 11 ). However, the process of estimating portion size from an image is tedious and can hinder the routine monitoring of food intake in the health-care setting. Researchers and clinicians have acknowledged that it is difficult to estimate portion size and that this constitutes the largest source of error in dietary intake assessment( Reference Cypel, Guenther and Petot 12 ). Hence, the lack of an accurate and easy-to-use monitoring tool or system for collecting and analysing food intake data can decrease the possibility of informing appropriate nutritional care interventions.
In an attempt to address the drawbacks of existing methods, we developed the Dietary Intake Monitoring System (DIMS), an integrated technology based on imaging, a weighing scale, an infrared thermometer, radio-frequency identification technology (RFID) and WIFI technology for real-time data acquisition( Reference Ofei, Dobroczynski and Holst 2 , Reference Ofei, Holst and Rasmussen 13 , Reference Ofei, Dobroczynski and Mikkelsen 14 ). The DIMS automatically captures a combination of total weights and images of food before and after consumption, respectively. The DIMS approach of using combined total weight-image data for estimating portion size and food intake offers a relevant alternative dietary assessment method. However, accuracy and validity of the DIMS approach is crucial. Against this background, the aim of the present pilot study was to test the inter-assessor reliability, accuracy and validity of the DIMS method for estimating intake of food, energy and protein compared with the WFM in a hospital setting.
Materials and methods
The Dietary Intake Monitoring System
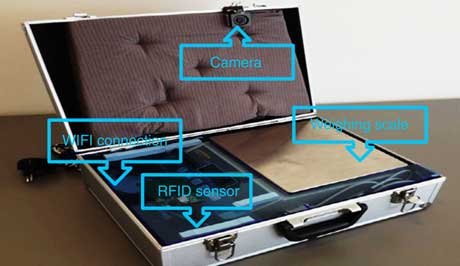
The DIMS digital technology can assess dietary intake using the combination of a weighing scale, imaging and RFID technology. The DIMS 2.0( Reference Ofei, Dobroczynski and Mikkelsen 14 ) used in the current study is an improved version of the DIMS 1.0( Reference Ofei, Holst and Rasmussen 13 ) and consists of a suitcase-style box (Fig. 1) with an integrated camera, weighing scale, RFID and WIFI connection for real-time photo and weight dietary data acquisition and analysis. The digital camera and weighing scale respectively captures a digital photograph and measures the weight of a patient’s plate contents both before and after consumption. The integrated wireless connection allows online transmission of the image to a mobile tablet as it is being captured for real-time analysis. The DIMS has a software program that can be installed on a computer and a handheld tablet device for the food intake analysis. In addition, the application offers the functionality of being used in a co-creational mode in which user inputs can be added from a mobile tablet to improve accuracy.

Fig. 1 (colour online) The Dietary Intake Monitoring System (DIMS) 2.0 for capturing photographs and weights of plate contents (RFID, radio-frequency identification)
Measurement procedures for plate contents before and after food consumption( Reference Ofei, Holst and Rasmussen 13 )
1. Each patient is assigned an RFID card with a unique code for identification of the individual’s before and after plate contents.
2. The card is placed on to the RFID reader active zone of the DIMS device to open up the system for identification and measurement.
3. The plate is placed on the scale before consumption. As soon as the weight stabilises, the system automatically measures the weight and takes a picture via the camera.
4. The plate and the RFID card are removed and the system is ready to record another measurement.
5. For plate measurement after consumption, the same procedure in steps 2–4 is repeated using the same patient-assigned card.
Estimation of food portion size using image-weighed data
The DIMS software program automatically generates folders containing the before and after images and weights of each plate measurement. The before and after data are automatically paired using the patient’s RFID code, date and time of measurement, making comparison very easy. To estimate portion size from the image, the visual technique is employed. With the visual technique, an assessor mentally separates the meal into its individual food items. Each food item portion size is assigned a weight based on the reference weight obtained from the kitchen. Once the weight of each food item portion is estimated, the total weight of all the food items should be equal to the total weight measured by the DIMS. If the visual estimated total weight is different from the total weight captured by the DIMS, the assessor re-estimates and adjusts the weight until it corresponds. Estimating the weight of each food item on the plate in this manner enhances the accuracy of visual portion size estimation from photographic images for energy and protein intake calculation. Four non-trained assessors independently estimated the portion size of each food item using the DIMS image-weighed data from seventeen patient meals. The assessors had no experience in estimating portion size using the image-based method.
Weighed food method
The WFM was used as the gold standard comparison. Using the WFM, participants’ meals were evaluated by weighing each food item in the composite meal to determine the portion size weight both before and after consumption. The weight of each food item consumed was calculated by subtracting the measurement after consumption from the measurement before food consumption.
Energy and protein estimation
The corresponding energy and protein content of each food item by weight was calculated using ‘Master Cater’. This is a system that contains all hospital food items, recipes of each meal and corresponding nutrient contents.
Study setting and participant selection
The study was conducted in the geriatric ward of the 1000 bed-capacity Odense University Hospital, Denmark, in November 2016. Study participants were patients whose lunch meals were served directly from the hospital food buffet trolley. On the study day, interested participants were informed of the experiment and the recording of their food intake. This included the application of the DIMS for collecting pictures of plate contents and clarifying that no physical images of the patient would be taken. Participants provided oral consent to participate in the study. As the study aim was simply to validate the DIMS method, patients’ demographic data, nutritional status and health conditions were not recorded.
Ethics
The study was presented to the local ethics committee, which found that the study was not covered by the Committee Act’s definition of a health science research and therefore had no objection. The patients were given written and oral information about the study. The participants were informed that they could withdraw from participation at any time during the study.
Statistical analyses
A two-sample t test was performed to test whether the DIMS method estimated energy and protein intake accurately against the WFM. Percentage deviation from the mean was computed for the DIMS and WFM. Pearson’s product-moment correlation was performed to assess the relationship between energy and protein intake estimated using the DIMS and WFM. Inter-assessor reliability for each food item before and after intake was assessed using intraclass correlation coefficients (ICC) at alpha level (P=0·01), two-way random and at the 95 % CI. To test the validity of the DIMS, agreement of energy and protein intake between the two methods was assessed using Bland–Altman plots. Statistical analyses were performed using the statistical software package IBM SPSS Statistics version 24.
Results
The two-samples t test revealed no statistically significant difference in energy intake estimated by DIMS 2.0 and the WFM (Table 1). Energy was slightly underestimated by DIMS 2.0 compared with the WFM, but the mean difference (13·48 (sd 104·57) kJ) was not statistically significant. The difference in protein intake estimated by DIMS 2.0 compared with the WFM yielded similar results, and again the mean difference (0·04 (sd 1·34) g) was not statistically significant. Pearson correlation coefficients for the two methods are presented in Table 1. Energy intake estimates from DIMS 2.0 were highly correlated with those from the WFM. Similarly, a high correlation between the two methods was recorded for protein intake. The percentage mean variation of energy and protein intake of the seventeen meals estimated by the WFM and DIMS 2.0 is presented in Table 2.
Table 1 Difference in estimated energy and protein intake between the Dietary Intake Monitoring System (DIMS) 2.0 and the weighed food method (WFM), and corresponding correlations, for patient meals in a hospital setting (n 17), Denmark, November 2016
Correlation is significant at the **P<0·01 level (two-tailed).
Table 2 The percentage deviation from energy and protein mean intake estimated by the Dietary Intake Monitoring System (DIMS) 2.0 and the weighed food method (WFM) for patient meals in a hospital setting (n 17), Denmark, November 2016
ICC were used to test the reliability of estimating the portion size of each food item in grams, before and after consumption, among the four independent non-trained assessors and showed highly significant agreement. The ICC for the estimated portion size of each food item were 0·88 (P<0·001) before consumption and 0·99 (P<0·001) after consumption. Additionally, for a single food item in grams consumed, the results showed very strong agreement among the assessors (ICC=0·99, P<0·001). Moerover, a significant agreement was found among the four non-trained assessors for energy content (ICC=0·99) and protein content (ICC=0·99; Table 3).
Table 3 Inter-assessor reliability of energy and protein intake from the Dietary Intake Monitoring System (DIMS) 2.0 with the weighed food method, and intraclass correlation coeffcients (ICC) among four non-trained assessors, for patient meals in a hospital setting (n 17), Denmark, November 2016
**P<0·01.
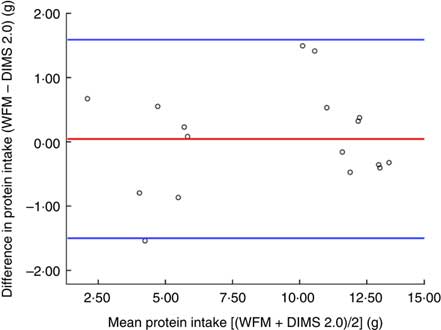
The agreement between the estimates of energy and protein intake determined by the two methods is presented using Bland–Altman plots (Figs 2 and 3, respectively). The mean difference (bias) in energy measured by DIMS 2.0 and WFM was 13·48 kJ. This indicates that the DIMS method underestimated energy and the estimates were within acceptable limits of agreement of −75·05 to 102·01 kJ (Fig. 2). The mean bias for protein was 0·04 g and the limits of agreement of DIMS 2.0 compared with WFM ranged from −1·50 to 1·59 g (Fig. 3).
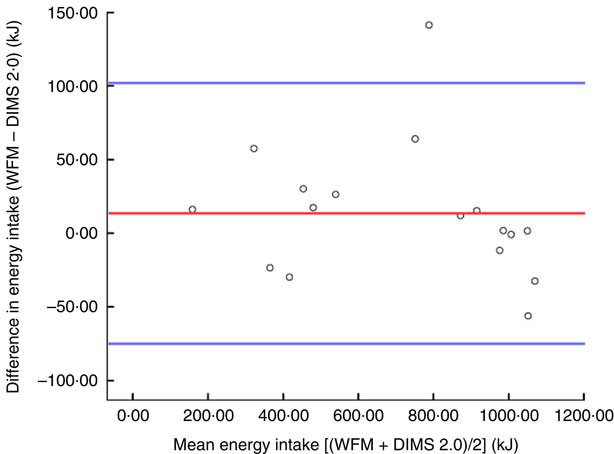
Fig. 2 (colour online) Bland–Altman plot assessing the relative validity of the Dietary Intake Monitoring System (DIMS) 2.0 against the weighed food method (WFM) for determining the energy intake from patient meals in a hospital setting (n 17), Denmark, November 2016. ![]() represents the mean difference (bias; WFM – DIMS) and
represents the mean difference (bias; WFM – DIMS) and ![]() represent two standard deviations of the difference (limits of agreement)
represent two standard deviations of the difference (limits of agreement)
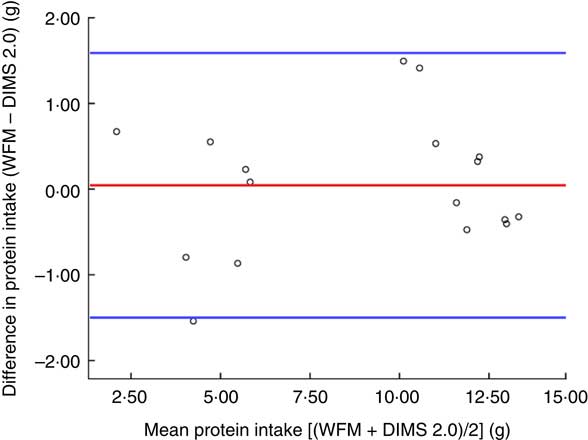
Fig. 3 (colour online) Bland–Altman plot assessing the relative validity of the Dietary Intake Monitoring System (DIMS) 2.0 against the weighed food method (WFM) for determining the protein intake from patient meals in a hospital setting (n 17), Denmark, November 2016. ![]() represents the mean difference (bias; WFM – DIMS) and
represents the mean difference (bias; WFM – DIMS) and ![]() represent two standard deviations of the difference (limits of agreement)
represent two standard deviations of the difference (limits of agreement)
Discussion
In the present study, we validated the DIMS 2.0 against the WFM in a hospital setting. The results showed that estimated values from DIMS were similar to values from the WFM. The mean difference in energy intake calculated by DIMS 2.0 and the WFM was not statistically significant. The mean difference for protein was also not statistically significant. In addition, a high correlation between the DIMS and WFM was found. These results could be partly due to non-trained assessors’ ability to use DIMS total weight as a reference for estimating portion size, although the mental process of assigning weights to individual meal components can be complex. Knowing the DIMS total weight helps an assessor to adjust the individual food item weight. In general, the non-trained assessors were able to use the combined total weighed-image to estimate the portion size of each food item. This was supported by the high agreement among the non-trained assessors using the DIMS method to estimate nutrient intake. This finding is in line with other studies reporting high inter-assessor reliability between non-trained assessors analysing food intake using photographic methods( Reference Pouyet, Cuvelier and Benattar 10 , Reference Budiningsari, Shahar and Manaf 15 ). Surprisingly, it has also been reported that the performance of non-trained assessors was comparable to their trained counterparts( Reference Parent, Niezgoda and Keller 16 ). Based on these findings, we can predict that staff with minimal training would be able to use the DIMS method to monitor food intake and produce accurate results. The results of the current pilot study have revealed that energy and protein intakes estimated by the DIMS were comparable to those from the WFM, as the estimates were within the limits of agreement. This is confirmation that the DIMS offers a valid alternative method of estimating food intake in the hospital setting.
The validated DIMS supports an easy-to-use tool requirement, which most health-care professionals consider relevant for the routine monitoring of food intake( Reference Mowe, Bosaeus and Rasmussen 3 , Reference Ofei, Holst and Rasmussen 17 ). If conducted manually by assessors, the process of matching weighed-image data for before and after measurements could be tedious, time-consuming and subject to errors. However, as the DIMS application software automatically matches before and after consumption plate contents to weighed-image data, this provides accurate data for easy comparison. The novelty of the DIMS lies in the combination of the repeated weighed-images to estimate portion size, an advantage this method has over other image-based dietary assessment methods( Reference Gemming, Utter and Ni Mhurchu 18 ).
The present study is not without limitations. The DIMS measures the total weight rather than the weight of single food items constituting the meal. Therefore, using the visual technique together with the DIMS total weight to estimate single food item portion size can result in inaccurate estimates of portion sizes and still obtain an estimated total weight equal to the DIMS total weight. However, this limitation was minimal in the current study. As a small sample size was used, a repeated study in an adequately sized sample will be needed to confirm this and also expand from energy and protein to other nutrients.
Conclusion
The DIMS 2.0 used in the present study innovatively combined photographic and total food weight methods as a single accurate and easy-to-use tool that addresses major drawbacks of traditional dietary assessment methods. The DIMS 2.0 was demonstrated to be a valid and reliable alternative system for monitoring food, energy and protein intake in a hospital setting. With the current DIMS method, portion size estimation using image and total food weight is not yet fully automatic, since it is partly carried out by a person with minimal training. The authors ultimately strive to automatise the process of collecting and analysing dietary data for the determination of accurate nutrient intakes. This is a major challenge confronting dietary assessment methods in general and particularly the image-based methods. This is because staff must be trained to estimate portion sizes from image-based data. It is on this basis that the present study proposes the development of a new algorithm capable of automatising nutrient intake analysis using combined weight and image data.
Acknowledgements
Acknowledgements: The authors wish to thank all assessors for their contributions. Financial support: This research received no specific grant from any funding agency in the public, commercial or not-for-profit sectors. Conflict of interest: None. Authorship: K.T.O., B.E.M. and R.A.S. contributed to the idea conception, study design and data collection. K.T.O. and R.A.S. contributed to the data collection. K.T.O., B.E.M. and R.A.S. contributed to analysis of the results and to the writing of the manuscript. Ethics of human subject participation: The local ethics committee found that this study was not covered by the Committee Act’s definition of a health science research. The patients were given written and oral information about the study and participants provided oral consent to participate in the study. Patients were informed that they could withdraw from participation at any time during the study.