

1. Introduction
The well-known Laguerre–Gaussian (LGpm) modes of paraxial light with integer radial and azimuthal, p and m, indices have a phase distribution of
 , where θ is the azimuthal angle. Here, m corresponds to the azimuthal or rotational order of the mode with a well-defined orbital angular momentum (OAM) of mℏ per photon [Reference Allen, Beijersbergen, Spreeuw and Woerdman1]. Such higher-order modes lead to twisted light by forming an optical vortex in the direction of propagation associated with the optical phase singularity. The spiral shape of the wavefront is formed by |m| interconnected helices; hence,
 beams are called helical beams.
These distinctive properties of higher-order Laguerre–Gaussian modes set forth to an ever-increasing amount of applications in different areas of optical communications, imaging techniques, quantum information technologies, and other topics; see [Reference Grier2–Reference Krenn, Handsteiner and Fink6] and references therein.
In recent years with the development of ultraintense multi-PW laser technology, Laguerre–Gaussian laser modes have other potential applications in the fields of plasma accelerators and inertial confinement fusion and in the generation of X-rays and γ-rays with OAM [Reference Zhang, Shen and Yin7–Reference Zhang, Chen and Luo14]. In particular, it has been shown that, in laser wakefields driven by LG01 helical pulses, the wakefield shows a donut-like structure with a ring-shaped hollow electron beam [Reference Zhang, Chen and Luo14]. Furthermore, for a lower-density plasma or a smaller laser spot size, besides the donut-like wakefield, a central bell-like wakefield forms in the center of the donut-like wake. On the contrary, further reducing the plasma density or laser spot size leads to an on-axis electron beam acceleration only.
It was also demonstrated that Laguerre–Gaussian beams transfer a part of their OAM to electrons through the dephasing process similar to the direct electron acceleration (DLA) in Gaussian beams [Reference Nuter, Korneev, Dmitriev, Thiele and Tikhonchuk15]. Furthermore, the propagation of optical beams with OAM leads to plasma waves that may also carry OAM which couple to the plasma electrons and involve Landau damping and particle acceleration accompanied with the generation of quasi-static axial and azimuthal magnetic fields [Reference Blackman, Nuter, Korneev and Tikhonchuk16]. When Laguerre–Gaussian plasma waves are subjected to Landau damping, a higher azimuthal mode number leads to a larger OAM transfer to particles traveling close to the phase velocity of the plasma wave [Reference Blackman, Nuter, Korneev and Tikhonchuk17]. Vacuum-based charge acceleration with Laguerre–Gaussian beams has also been studied very recently [Reference Vaziri, Golshani, Sohaily and Bahrampour18, Reference Akou and Firouzjaei19] showing that it is possible to generate GeV high-quality electron bunch with low spread in energy and radial deflection.
Motivated by these interesting results, in this paper, we will study direct electron acceleration in vacuum in various helical Laguerre–Gaussian LG0m laser pulses corresponding to helical modes m = {0,1,2,3,4,5}. Laser beams with p = 0 and m = 0 define the fundamental Gaussian mode, while beams with p = 0 and m ≥ 1 have a hollow ring-like transverse intensity profile with zero intensity at the center. The central hollowness corresponds to a potential well which confines/accelerates the electric charges through the transverse/longitudinal ponderomotive forces.
This type of ponderomotive trap is also realized using higher-order transverse electromagnetic modes (TEMs), i.e., the Hermite–Gaussian modes, such as TEM1,0 or the combination of TEM1,0 with TEM0,1. This ponderomotive potential is similarly axisymmetric and has a minimum on the axis [Reference Chaloupka, Fisher, Kessler and Meyerhofer20–Reference Li, Gu and Zhu24]. This is certainly expected since orthogonal Hermite–Gaussian modes may be decomposed into Hermite–Gaussian modes with a phase difference, and vice versa; see [Reference Allen, Beijersbergen, Spreeuw and Woerdman1, Reference Abramochkin and Volostnikov25] for the general formulas.
Here, we specifically focus our study on the energy gain in femtosecond lasers of low to very high intensity, thereby gaining valuable estimates about relevant parameters for lasers operating at ELI-NP [Reference Tanaka, Spohr and Balabanski26]. Our results are based on the 3-dimensional numerical solution of the relativistic equations of motion for free electrons in paraxial laser fields. Henceforth, similarly as in very low-density plasmas, in DLA, we also observe collimated and intertwining electron beams in the direction of the laser propagation, while in addition, we also show that the average energy gain increases with the azimuthal mode index m.
Furthermore, we found that the optimal beam waist leading to the most energetic electrons is more than twice smaller in case of higher-order Laguerre–Gaussian beams than in case of the fundamental Gaussian beam that was presented in [Reference Molnar, Stutman and Ticos27]. For lasers of P 0 = {0.1, 1,10} PW power, the optimal beam waists are Δw 0 = {6,11,19}λ0 and correspond to I 0 = I 0m × {0.76, 2.2, 7.6}1021 W/cm2 peak intensities, while taking into account the intensity profiles of the LG0m beams, these values are reduced by
 for m = {1,2,3,4,5}. Using these optimal values, we have observed that, for the same laser power, the average kinetic energy gain of electrons is about an order of magnitude larger in helical beams compared to the fundamental Gaussian beam.
This paper is organized as follows. In Section 2, we present some of the characteristic properties of helical beams, the equations of motion for electrons, and the initial conditions corresponding to our study. In Section 3.1, we have estimated the optimal values of beam waist leading to the most energetic electrons for given laser power. Applying these optimal values, we present and discuss the electron dynamics and energy gains in linearly polarized (LP) and circularly polarized (CP) helical beams in Section 3.2. The conclusions are summarized in Section 4.
2. Direct Laser-Driven Electron Acceleration in Helical Beams
2.1. Laguerre–Gaussian Beams
A well-known solution [Reference Siegman28, Reference Goldsmith29] to the paraxial wave equation is obtained in cylindrical coordinates (r, θ, z), with the help of generalized Laguerre polynomials. This solution is cylindrically symmetric around the axis of propagation z, with radius
 and azimuth
 , expressed in Cartesian coordinates. These are the Laguerre–Gaussian (LGpm) beams [Reference Allen, Beijersbergen, Spreeuw and Woerdman1, Reference Baumann and Pukhov10, Reference Chen, Hatsagortsyan and Keitel12], with radial index p and azimuthal index m. The general expression for the electric field distribution of a monochromatic LGpm pulse is
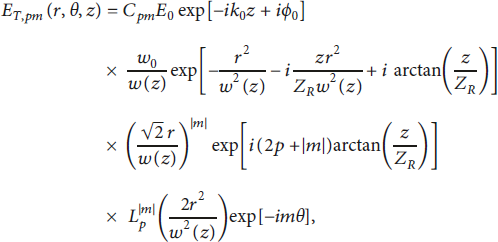
where k 0 = ω 0/c is the wavenumber,
 is the speed of light in vacuum, ω 0 is the angular frequency, E 0 is the amplitude of the electric field, and ϕ 0 is the initial phase. Furthermore,
 is the Rayleigh range,
 is the radius of curvature, and
 is the Gouy phase. The beam waist is defined as
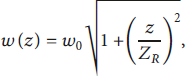
where the beam waist radius at focus is w 0 ≡ w(z = 0.
The Laguerre polynomials are denoted by
 , and the normalization constant,
 , follows from the orthonormality of the Laguerre polynomials [Reference González de Alaiza Martínez, Duchateau and Chimier30]. The fundamental Gaussian beam LG00 is obtained for p = m ≡ 0, where
 .
.
The components of the electric and magnetic fields are
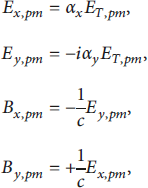
where
 and
and
 such that αP = 1 or −1 in case of linear polarization along the x-axis or y-axis, respectively, and αP = 0 for circular polarization, while elliptic polarization, otherwise.
The longitudinal components of the electric and magnetic fields are calculated from Maxwell’s equations,
 ; thus, in the paraxial approximation,
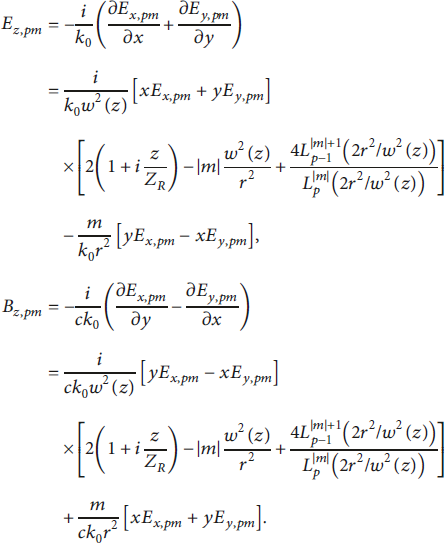
Therefore, the electromagnetic field of Laguerre–Gaussian pulses is given by


where the Gaussian temporal envelope with τ0 duration and peak intensity position at zF reads [Reference Robinson, Arefiev and Neely31]

Note that there are more appropriate choices for the temporal profile such as the hyperbolic secant
 ; see [Reference Kirk32–Reference Ong, Moritaka and Takabe34] for more details. Using this profile, we found that the energy gain may be reduced by as much as 30% compared to Gaussian.
2.2. Helical Beams
The Laguerre–Gaussian beams, LG0m, with nonzero azimuthal modes |m| ≠ 0 contain a phase change given by
 . Note, however, that, for all modes, the generalized Laguerre polynomials have a contribution equal to one, i.e.,
 . These type of Laguerre–Gaussian beams, LG0m, are the helical beams associated with the nonzero OAM of light [Reference Allen, Beijersbergen, Spreeuw and Woerdman1, Reference Longman and Fedosejevs35].
In Figure 1, the normalized intensity profiles of linearly polarized fundamental Gaussian and different helical beams are shown as a function of radial distance, in units of beam waist radius w 0. These plots represent
 using equation (1), for t = z ≡ 0 and k 0 = ω 0 = w 0 ≡ 1, while the intensity is
 .
.
The relative intensity profiles at constant power and beam waist as a function of the radius of an LP laser: the fundamental Gaussian beam LG00 with dotted black line and the helical beams LG01, LG02, LG03, LG04, and LG05 with green, magenta, red, blue, and black lines correspondingly.
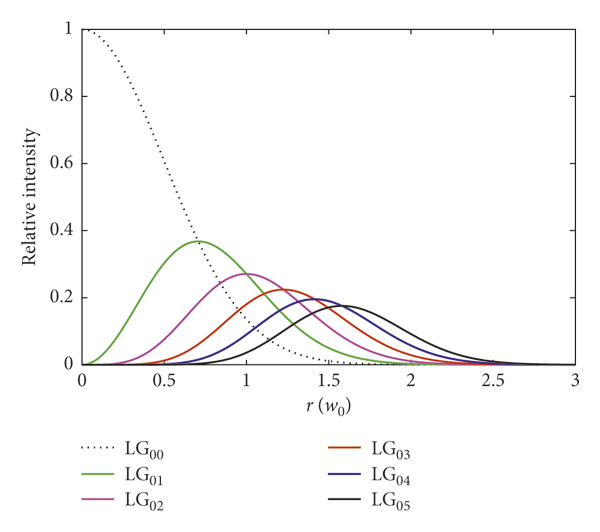
The intensity of LG0m-modes is largest for m = 0 corresponding to the fundamental Gaussian beam, and it is decreasing with an increasing number of azimuthal modes. Due to the
 factor, all modes with
 have zero intensity at the center, r = 0, that is known as an optical vortex or phase singularity on the axis.
The intensity profiles of Gaussian beams are concave functions on the whole interval. The intensity of helical beams is independent of θ and has a convex part with maxima at
 after which the functions change from convex to concave. The width of the convex part widens with increasing azimuthal index m, while using the positions of maxima, the intensity peaks of LG0m-modes relative to fundamental Gaussian lead,
 , as shown in Figure 1.
2.3. Electron Acceleration in the Electromagnetic Field
The motion of electrically charged particles in an external electromagnetic field is governed by the Lorentz force,
 , and leads to the following set of nonlinear differential equations [Reference Jackson36]:


Here, q = −e is the electron’s charge, the Cartesian coordinates and normalized velocity are denoted by
 and
and
 , while the Lorentz factor is
 .
.
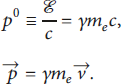
The four-momentum of the electron is
 , where
 is its invariant rest mass. The relativistic energy
 and momentum
 of electrons are expressed as
Laser-driven electron acceleration in vacuum is the consequence of the direct interaction of the laser pulse with electrons [Reference Hartemann, Fochs and Le Sage37–Reference He, Yu and Lu46]. At any given time, equations (8) and (9) are input for the electromagnetic field of the laser pulse, i.e., equations (5) and (6); hence, the trajectory of the propagating electric charge dynamically maps the laser pulse.
The 3-dimensional solutions to the electron trajectories and velocities are obtained by solving these coupled differential equations numerically by an adaptive time-step Runge–Kutta method with an accuracy and numerical precision up to 12 digits.
2.4. Initial Conditions
Unless stated otherwise, initially, all electrons are at rest, i.e.,
 and
and
 . These electrons at z 0,i = 0 coordinates are uniformly distributed in the orthogonal plane,
 , on a disk with a radius that is three times the beam waist radius, i.e., r 0 = 3w 0. Thus, initially, over 99% of the laser’s energy is contained within this disk. The initial position of the peak of the laser pulse is located on the longitudinal axis at
 behind the electrons, i.e., full pulse interaction, while all electrons are independent from each other and only interact with the laser pulse [Reference Molnar, Stutman and Ticos27].
For current purposes, we have fixed the laser wavelength to λ0 = 800 nm. The laser pulse duration at full width at half maximum (FWHM), Δτ 0 = 25 fs, corresponds to
 . Similarly, the beam waist at FWHM Δw 0 leads to
 waist radius.
The peak intensity and peak power for a monochromatic LP Gaussian laser are
 and
and
 , where the normalized electric field amplitude is
 . For P 0 = {0.1, 1,10} PW power and beam waists of Δw 0 = {6,11,19}λ0, these values are listed in Table 1. For helical beams, the field intensities at the local maxima are
 since the total power of the beam is constant,
 .
.

3. Results
3.1. Optimal Beam Waist
First of all, we are interested in the values of the beam waist for different laser powers that lead to maximal energy gains, in case of the Gaussian beam LG00 and the helical beams LG01, LG02, LG03, LG04, and LG05.
The energy gain of electrons interacting with an LG0m laser pulse is a function of the initial location of electrons, the laser spot size, and azimuthal mode m. To estimate the value of the beam waist that correspondingly leads to maximum energy gains for a given laser power, we have varied the initial position of electrons uniformly
 at z 0,i = 0 and calculated the respective energy gain of a single electron for each position:

where
 . Furthermore, for all discrete values of beam waist Δw 0 = {1,2, …, 200}λ0, we have also calculated the average of these energy gains,
 , where N = 50 corresponds to the number of the initial positions of electrons in the transverse plane.
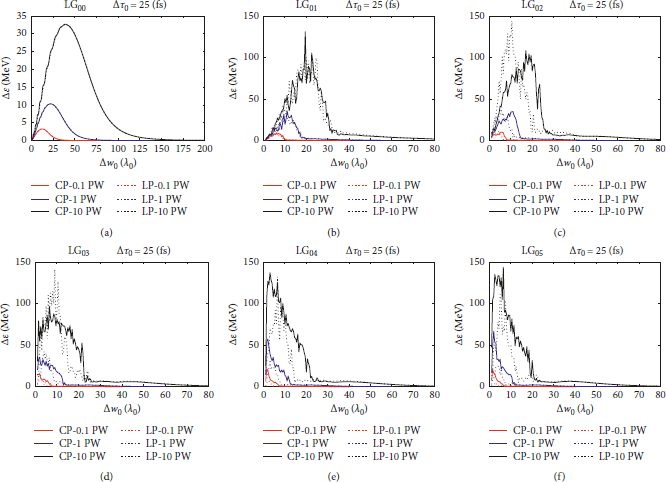
These weighted averages for different laser powers are shown in Figure 2 for both LP and CP pulses. Here, the average energy gains corresponding to laser powers of P 0 = {0.1, 1,10} PW are plotted with red, blue, and black, as a function of initial spot size. The full and dashed lines correspond to CP and LP lasers, respectively.
The average energy gain of an electron initially located at z 0 = 0 and x 0 = y 0 ≡ {0.05, 0.1, …,2.5} Δw 0 as a function of the beam waist. The red, blue, and black lines correspond to the weighted average energy of P 0 = {0.1, 1,10} PW laser powers, respectively. The full and dotted lines correspond to CP and LP lasers. (a–c) The Gaussian beam, LG00, and the helical beams LG01 and LG02. (d–f) The helical beams LG03, LG04, and LG05.
First, we discuss these results qualitatively. For a given laser power, the amplitude of the electron oscillations along the polarization direction increases with intensity. Increasing the beam waist decreases the intensity, and the scattering of electrons decreases; hence, they remain confined in the pulse being able to gain more energy from the laser, until the oscillations become larger than the waist and the electron scatters out from the pulse.
On the contrary, increasing the waist of the beam also decreases the longitudinal components of the electric field and the Lorentz force, i.e., Ez and
 , and therefore reduces the net kinetic energy gain of electrons. The electrons are accelerated to larger and larger velocities in the front part of the pulse, and thus, the electron trajectories are elongated in the direction of the laser propagation, while the deceleration in the back part of the pulse becomes less efficient.
This means that the beam waist corresponding to the highest average energy gain, i.e., the highest peaks of the averages in Figure 2, represents the optimal waist for the given laser power and polarization. For larger power lasers, a wider initial beam waist is more optimal to ensure that the electrons remain confined inside the pulse to gain more energy.
Therefore, using Figure 2, we can approximate the beam waists corresponding to the peaks in net energy gain. In case of the fundamental Gaussian beam, the optimal beam waist at FWHM corresponds to few tens of wavelengths, Δw 0 = {13,23,41}λ0, for laser powers of P 0 = {0.1, 1,10} PW, such that the net energy gain increases about
 for every order of magnitude increase in laser power. Even with those optimal values, the average energy gain of only a few MeV was observed in LG00 beams; see [Reference Molnar, Stutman and Ticos27] for more details. Note also that, in case of the Gaussian pulse, the outcome is independent on the polarization, and the averaged results overlap. This behavior is similar for the LG01 helical beam, but for higher modes, the distinction between CP and LP pulses becomes more apparent.
Now, averaging the energy gains
 of the helical beams LG01 and LG02 for a circularly polarized laser from Figure 2, we have approximated the optimal beam waists at FWHM. These optimal beam waists are Δw 0 = {6,11,19}λ0 corresponding to increasing laser power of P 0 = {0.1, 1,10} PW. These approximated values represent the chosen optimal values for direct electron acceleration in all helical beams of interest, LG01,…, LG05. Note, however, that the optimal beam waist also reduces slightly as the mode number increases (see Figure 2). Therefore, the previously chosen beam waists are suboptimal for LG04 and LG05 modes where even a smaller beam waist would be more favorable for larger energy gains.
The most important observation in case of CP beams is that the optimal spot sizes of helical beams are more than twice smaller than for the fundamental Gaussian beam. In case of LP beams, this difference further increases with the mode index |m| ≥ 1. Furthermore, for these relatively tight initial waists, of a few wavelengths, the helical beams might lead to almost an order of magnitude larger net energy gains compared to the fundamental Gaussian beam at high laser power.
A straightforward explanation can be formulated in terms of the ponderomotive force,
 , where the ponderomotive potential, the cycle-averaged oscillation energy, is directly proportional to the intensity,
 , shown in Figure 1. The ponderomotive force causes the charges oscillating in an inhomogeneous electric field to drift from where the electric field is larger to where it is smaller. Therefore, the immediate consequence of the transverse ponderomotive force is the scattering of charges from “regions” of higher to lower electric field intensity. Due to the fact that the intensity of the helical beams has a wide convex region, the charges found in this region are naturally driven to the beam center with zero intensity.
In other words, the transverse ponderomotive force in Gaussian beams is always positive; hence, the electrons are scattered outwards from the pulse. In helical beams, the transverse ponderomotive force of the convex region is negative, and hence, the electrons are effectively trapped inside the “hollow” pulse (see Figure 1). This leads to less spread, better focusing, and collimated electron trajectories confined near the axis of propagation. These captured electrons are accelerated further by the longitudinal ponderomotive force while continue to gain more energy through the phase synchronization process leading to larger energy gains; see [Reference Akou and Firouzjaei19] for more details.
3.2. Energy Gain for Optimal Beam Waists
Using the previously given initial conditions together with the optimal values listed in Table 1 for both CP and LP lasers of P 0 = {0.1, 1,10} PW power and initial beam waist of Δw 0 = {6,11,19}λ0, we have numerically calculated the direct laser-driven electron acceleration corresponding to the fundamental Gaussian LG00 and LG0m helical beams with azimuthal modes m = {1,2,3,4,5}.
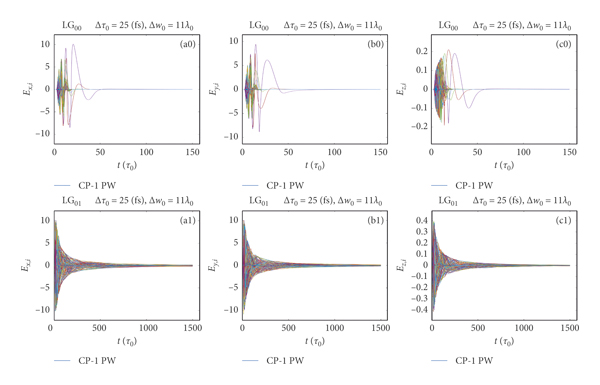
In Figure 3, we have plotted all Cartesian components of the electric field as a function of time in units of the normalized field intensity a 0 as mapped by Ne = 6000 accelerated electrons with lower index i. In LG00 beams, the electrons are accelerated at the front part of the pulse, but without reaching the available peak intensity of the pulse, the electrons are scattered out by the transverse ponderomotive force. In helical beams, e.g., LG01 and LG05, the available “peak” intensities are about 2.5 and 5.5 times smaller than in LG00. However, these intensity maxima are located further away from the midpoint, i.e., r = 0, the location of maximum intensity of the Gaussian beam and zero intensity for the helical beams (see Figure 1). Therefore, the electrons found in the convex part of the pulse are captured and accelerated for a much longer time, being clearly visible in Figure 3, where the time axes of the electric field components are an order of magnitude longer for the helical beams. This also means that the trajectories of some electrons captured by helical beams are up to an order of magnitude longer in the direction of the laser propagation. Furthermore, as apparent in Figure 3, the electrons also have a twisted circular motion with intertwining trajectories, similar as presented in [Reference Ju, Zhou and Jiang9].
CP lasers of P 0 = 1 PW power, with Δτ 0 = 25 fs and Δw 0 = 11 λ0. (a0, b0, c0) The electric fields seen by the electrons Ex,i, Ey,i, and Ez,i in units of a 0 as a function of time, corresponding to the LG00 beam. (a1, b1, c1) They are for the helical beam LG01.
To further elucidate these issues, in Figure 4, we have plotted the net energy gain of electrons as a function of the initial radial distance,
 , at the origin z i,0 = 0, for varying laser power. Here, all figures correspond to an initial beam waist of Δw 0 = 11λ0, while CP and LP pulses are plotted with “o” and “x,” respectively. Similar to the previously presented figures, red, blue, and black correspond to P 0 = {0.1, 1,10} PW laser power. Figures 4(a0) and 4(b0) correspond to Gaussian beams, while Figures 4(a1) and 4(b1) are for helical beams LG01. Similarly, the helical beams, LG02, LG03 and LG04, LG05, with different polarizations are shown.
The energy gained from laser pulses with Δτ0 = 25 fs and Δw 0 = 11λ0 of P 0 = {0.1, 1,10} PW power with red, blue, and black correspondingly as a function of the same initial radial position of electrons. (a0, b0) The energy gained from a Gaussian laser pulse corresponding to CP and LP pulses, which are plotted with “o” and “x,” respectively. (a1, b1) The energy gained as a function of the initial radial position in LG01 helical CP and LP beams, (a2, b2) LG02 and (a3, b3) LG03 helical CP and LP beams, and (a4, b4) LG04 and (a5, b5) LG05 helical CP and LP beams.
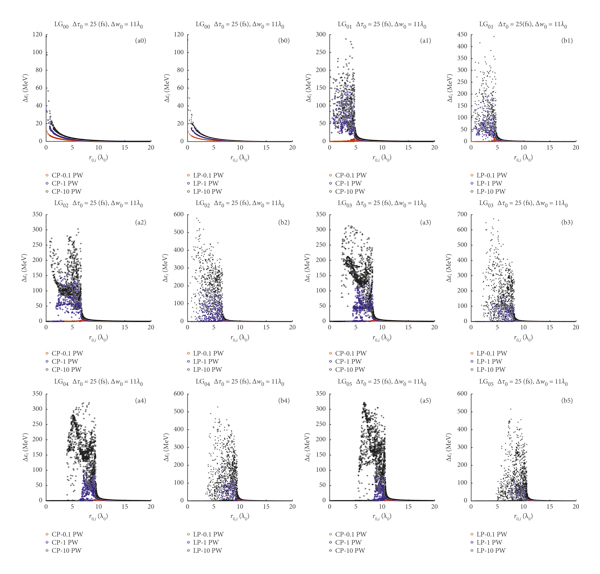
Here, we observe that the net energy gain as a function of the initial radial distance also reflects the initial intensity profiles shown in Figure 1. The intensity of the Gaussian beam falls off exponentially as a function of the radius; hence, the electric charges found further away from the center gain less and less energy. In the case of the helical beams, the largest acceleration occurs within the convex part of the intensity curves. Furthermore, as the distance between the center and the intensity peak widens with the azimuthal index, the peaks in intensity of the LG0m helical beams are also decreasing (see Figure 1). This explains why there is less and less net energy gained around the middle of the helical beams with increasing mode index m (see Figure 4).
In Figure 5, the histograms of the energy
 and the polar angle ϕi of electrons are shown after the interaction with the pulse. Here, the 3-dimensional polar angle is
 , where
 is the radial distance from the origin. All histograms correspond to a CP laser of P 0 = 10 PW power and Δw 0 = 11λ0 spot. In Figure 5, (a0), (b0) and (a1, b1) show the histograms of energy and polar angle corresponding to LG00 and LG01 beams. Similarly, Figures (a2), (b2), (a3), (b3) and (a4), (b4), (a5), (b5) show the outcome from the helical beams LG02, LG03 and LG04, LG05.
The logarithmic scale histogram of net energy gained
 and the polar angle histogram ϕi of electrons after interaction with a circularly polarized laser pulse with Δτ 0 = 25 fs, Δw 0 = 11λ0 beam waist, and P 0 = 10 PW power. (a0, b0) The energy gained from a Gaussian pulse and the corresponding angular distribution of electrons. (a1, b1) The energy gain and angular distribution in case of the LG01 helical beam, for helical beams LG02 (a2, b2) and LG03 (a3, b3), and for helical beams LG04 (a4, b4) and LG05 (a5, b5).
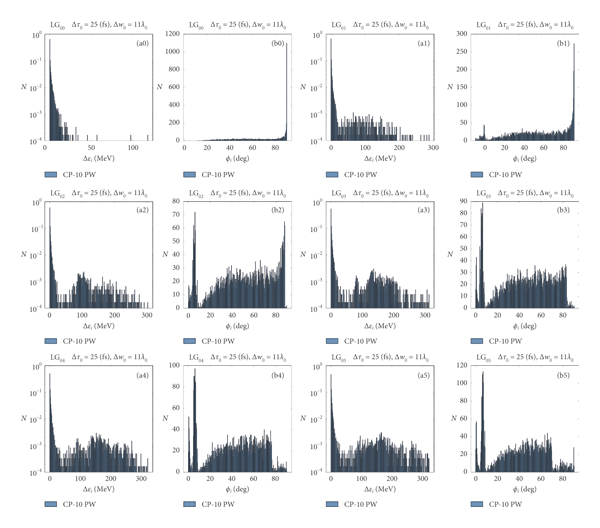
These histograms once again reflect the difference in the ponderomotive force and its influence on the energy gain as well as the angular distribution of electrons. Due to the interaction with the pulse, the electrons have scattered out with ϕi polar angle. In case of the fundamental Gaussian beam, this polar angle is predominantly in the direction orthogonal to the direction of laser propagation, i.e., ϕi ≥ 80 degrees. For helical beams with increasing azimuthal mode, we observe an increasing number of electrons that are scattered parallel to the longitudinal axis, at polar angles of
 degree, and, at the same time, fewer electrons in the orthogonal directions. This obviously means that helical beams lead to a larger number of collimated electrons than fundamental Gaussian beams, while their number is also increasing with increasing mode index.
Furthermore, the distribution of energy gain is also different in helical beams. The electrons are distributed following a multimodal distribution, leading to at least a second peak at finite energy at about 150 MeV energy for the helical beams, LG03, LG04, and LG05. Although, here, we have only shown the results for the P 0 = 10 PW laser, a very similar behavior is observed for the P 0 = 1 PW laser, with a peak at about 50 MeV energy. For a P 0 = 0.1 PW laser, the intensities of the helical beams are so weak such that these striking differences disappear.
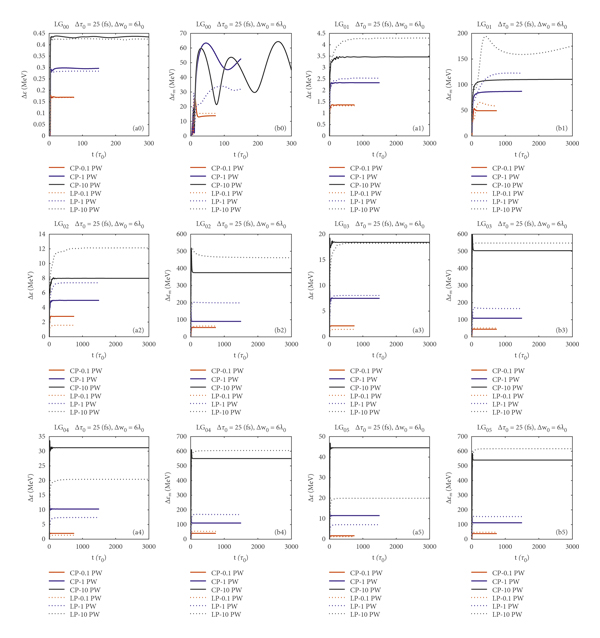
In Figures 6–8 corresponding to initial beam waists of Δw 0 = 6λ0, Δw 0 = 11λ0, and Δw 0 = 19λ0, we have plotted the average net energy and the largest energy gained,
 , both from circularly and linearly polarized LG0m pulses. Here, the average energy is calculated from
 , where Ne = 6000 is the number of electrons. These averages are shown with full lines for circularly polarized and with dotted lines for linearly polarized lasers. Similar as before, red, blue, and black, respectively, represent the power of the laser P 0 = {0.1, 1,10 PW. In Figures 6–8, (a0) and (b0) show the average energy gained within the fundamental Gaussian beams, while Figures (a1) and (b1) show the same for the helical beams LG01 with given waist. Figures (a2) and (b2) correspond to LG02, while Figures (a3) and (b3) correspond to LG03. Similarly, Figures (a4), (b4) and (a5), (b5) present the outcome for LG04 and LG05 helical beams.
Lasers with Δτ 0 = 25 fs pulse duration and Δw 0 = 6λ0 beam waist radius. The full and dotted lines correspond to a CP and LP laser of P 0 = {0.1, 1,10} PW power, with red, blue, and black, respectively. (a0) The time evolution of the mean net energy gain of electrons; (b0) the time evolution of the highest energy electron,
 ; both correspond to Gaussian pulses of different powers and polarizations. (a1, b1) The energy gains corresponding to the LG01 helical beam, (a2, b2) LG02 and (a3, b3) LG03 helical beams, and (a4, b4) LG04 and (a5, b5) LG05 helical beams.
Similar to Figure 6. All figures correspond to lasers with Δτ 0 = 25 fs and Δw 0 = 11λ0 beam waist radius. The full and dotted lines correspond to a CP and LP laser of P 0 = {0.1, 1,10} PW power, with red, blue, and black, respectively.
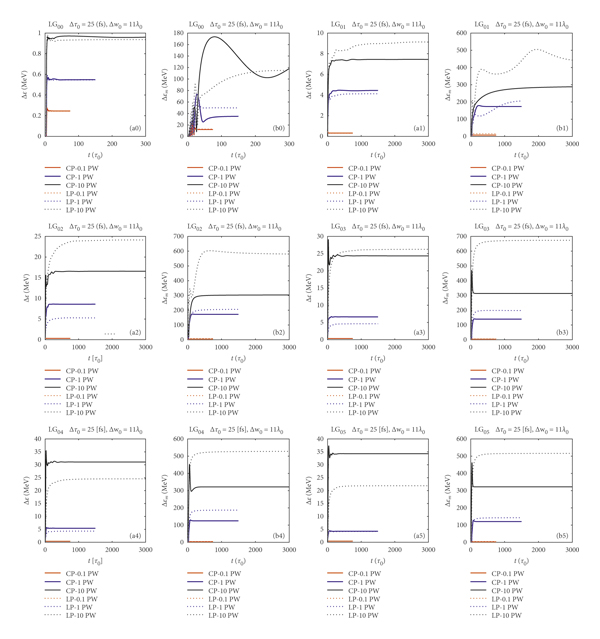

We observe that the mean energy gain of electrons for any given laser power is largest for an optimal waist, and this optimal waist is increasing with increasing laser power. Therefore, for a P 0 = 0.1 PW laser, the optimal waist size is Δw 0 = 6λ0, compare the mean energies, i.e., the red lines, in Figures 6–8. Similarly, by comparing the blue lines, for a P 0 = 1 PW laser, the waist size that leads to the largest energy gains is Δw 0 = 11λ0, while for a P 0 = 10 PW laser, the optimal waist size is Δw 0 = 19λ0, in accordance with the results of Section 3.1.
On the contrary, we also recognize that the average energy gain in helical beams is increasing with increasing azimuthal index
 . This is evident by comparing the blue and black lines in Figures 6–8. For a larger initial waist, there is larger energy gain for higher laser power. However, in Figure 8, we also observe that, for the largest waist and largest laser power, the average energy is increasing up to
 , while it is decreasing for higher modes. This was somewhat expected based on Figure 2, meaning that, for the highest power lasers with
 modes, the optimal waist should be smaller than
 .
.
The effect of laser polarization on energy gain is a delicate matter as already suggested by Figure 2. The average net energy gain in fundamental Gaussian beams is largely independent on the polarization. However, for helical beams, the outcome is different in each case depending on the beam waist and mode index, and therefore, the difference is from a few percent to up to 50%. We have also observed that a larger average energy gain slightly favors the circularly polarized helical beams with mode indices
 for any beam waist and laser power. For linearly polarized helical beams, the optimal waist size should be slightly smaller than in the circularly polarized case to obtain similar energy gains, as can be concluded from the results.
The average net energy gain in Gaussian pulses, for the highest laser power and largest waist, is less than 2 MeV, while the highest energy electrons are
 MeV (see Figure 8). As previously discussed, the energy gains in fundamental Gaussian pulses may be a little higher for optimal beam waists [Reference Molnar, Stutman and Ticos27], but even so, these values are easily surpassed in helical beams leading to an average of about a few and up to 45 MeV, and, in some cases, with highest energy electrons of
 MeV or more. Such energy gains are still below than the so-called ponderomotive limit
 [Reference Stupakov and Zolotorev21, Reference Dodin and Fisch47], where the intensity maxima of higher-order helical beams can be more than 5 times lower than those of Gaussian beams.
4. Conclusions
In this paper, we have studied and compared the direct laser-driven electron acceleration in Laguerre–Gaussian beams with azimuthal mode indices, LG00 corresponding to the fundamental Gaussian beam, and helical beams LG01, LG02, LG03, LG04, and LG05.
We have found that the acceleration of electrons from rest is vastly different in helical beams compared to the fundamental Gaussian beam, mainly due to the difference in ponderomotive forces. Most importantly, for relatively tight initial waists, the helical beams lead to at least an order of magnitude larger energy gain compared to the fundamental Gaussian beam, and this energy gain also increases with the azimuthal mode
 .
.
For laser powers of P 0 = {0.1, 1,10} PW, the optimal waist of helical beams leading to the most energetic electrons is more than twice smaller, Δw 0 = {6,11,19}λ0, than in the case of the fundamental Gaussian beam [Reference Molnar, Stutman and Ticos27]. This also means that the beam waist that is optimal for helical beams is suboptimal for the Gaussian beam, and vice versa.
Finally, compared to Gaussian beams, the electron trajectories in helical beams are confined in the direction of the laser propagation leading to collimated electrons with trajectories that are at least an order of magnitude longer in the direction of the laser propagation. These conclusions hold for both linearly and circularly polarized lasers.
Data Availability
The data used to support the findings of this study are included within the article.
Conflicts of Interest
The authors declare that they have no conflicts of interest.
Acknowledgments
The authors are thankful to S. Ataman, D. Doria, J. F. Ong, K. Tanaka, and S. Tzenov for corrections and suggestions. E. Molnár thanks H. S. Ghotra for the comparison of early results and valuable discussions. D. Stutman acknowledges the support by a grant of the Ministry of Education and Research, CNCS-UEFISCDI (project no. PN-IIIP4-ID-PCCF-2016–0164), within PNCDI III. The authors are thankful for the financial support from the Nuclei Project (PN 19060105).


 Open access

