


Hypertension (HTN) is a multifactorial clinical condition characterised by sustained high blood pressure levels. It affects 1·13 million people worldwide and is considered one of the main risk factors for CVD(1,2) . Moreover, the HTN is a recognised metabolic consequence of insulin resistance (IR), an impaired response to insulin stimulation in target tissues (liver, muscles and adipose tissue)(Reference Freeman and Pennings3). Among the various techniques used to assess IR, the triglycerides–glucose (TyG) index stands out as an easy-to-apply test with high sensitivity and specificity(Reference Simental-Mendía, Rodríguez-Morán and Guerrero-Romero4). The TyG index has already been associated with the presence of HTN or high blood pressure(Reference Irace, Carallo and Scavelli5–Reference Lee, Ahn and Lee8).
Excess weight and body fat also contribute to metabolic changes that lead to increased levels of insulin, IR and cardiometabolic risk(Reference Freeman and Pennings3). In a cross-sectional study with 1730 adults of both sexes, IR, assessed by the TyG index, was associated with the presence of HTN(Reference Bala, Gheorghe-Fronea and Pop9). In a cohort study of 6078 men and women that evaluated the role of the TyG index in predicting the development of CVD, it found that individuals in the higher TyG quartiles had higher systolic blood pressure (SBP) values and a higher risk for CVD(Reference Li, Guo and Chen10). However, few studies have evaluated the interrelationship between IR, assessed by the TyG index, excess body weight and food consumption(Reference Da Silva, Caldas and Hermsdorff11) on increased blood pressure.
Food is an important adjustable factor for the prevention of cardiometabolic disorders, such as HTN, and the reduction in the recurrence of cardiac events in secondary care patients in cardiology(Reference Yu, Malik and Hu12). The legume food group, which consists of beans, peas and lentils(Reference Mahan, Foster and Dahl13), has important bioactive components, such as folate, Fe, K, Mg, soluble fibre and amino acids. These components have beneficial effects on energy regulation and metabolic functions, helping to maintain an adequate weight and, consequently, blood pressure(2,Reference Reynolds, Mann and Cummings14,Reference Abete, Parra and Martinez15) . A higher consumption of vegetable protein (legumes and nuts) was associated with a lower incidence of the metabolic syndrome in disease-free adults followed for 11·2 years in Australia(Reference Shang, Scott and Hodge16). After 15 years of follow-up, there was a reduction in the blood pressure of men (70·1 (sd 4·6) years of age) with a higher consumption of vegetable protein(Reference Tielemans, Kromhout and Altorf-van der Kuil17). A cohort study that examined the associations of protein intake with mortality risk in adult men and women without CVD also found a lower risk of CVD mortality in individuals with a higher intake of plant protein(Reference Mingyang, Teresa and Frank18).
Amino acids can play an important role in CVD(Reference Jennings, MacGregor and Welch19–Reference Stamler, Brown and Daviglus21). Some amino acids with potential cardioprotective roles(Reference Jennings, MacGregor and Welch19), such as glutamic acid, arginine, glycine, cysteine, leucine and histidine, are present in meat, fish, eggs, dairy products, vegetables, fruits, legumes, whole cereals and nuts. They act through the nitric oxide synthesis pathway(Reference Reeds and Burrin22,Reference Toba, Nakamori and Tanaka23) , catecholamine synthesis control(Reference Fernstrom and Fernstrom24) and glycaemic control(Reference Gazit, Ben-Abraham and Vofsi25–Reference Magdalon and Festuccia27). However, studies that assess the relationship between the cardioprotective amino acids intake, their main dietary sources and cardiometabolic risk factors are scarce(Reference Jennings, MacGregor and Welch19,Reference Mirmiran, Bahadoran and Ghasemi28) . Therefore, further studies are needed to investigate the relationships between amino acids and food groups with blood pressure levels, mainly in secondary care patients in cardiology. Therefore, the objective of the present study was to evaluate the association between legume intake and blood pressure, as well as the mediating role of cardiometabolic factors in individuals in secondary cardiovascular prevention.
Methods
This study was conducted with the baseline data of the multicentre study Brazilian Cardioprotective Nutritional Program Trial (BALANCE Program Trial). The BALANCE Program Trial was designed and coordinated by researchers from the Instituto de Pesquisa of Hospital do Coração in partnership with the Programa de Apoio ao Desenvolvimento Institucional do Sistema Único de Saúde (PROADI-SUS) of Brazilian Ministry of Health, registered on the ClinicalTrials.gov (NCT01620398). The study was a multicentre project conducted throughout the country, with thirty-four collaborating centres spread across the five regions of Brazil. The main objective of this study was to investigate the effects of the Brazilian cardioprotective food programme on the secondary prevention of cardiovascular events. The methodology of this project is detailed elsewhere(Reference Weber, Bersch-Ferreira and Torreglosa29).
Subjects
Adult and elderly individuals of both sexes, aged 45 years or older, who had at least one CVD (coronary disease, stroke and/or peripheral vascular disease) within the last 10 years were included. All eligibility criteria are reported in the study protocol(Reference Weber, Bersch-Ferreira and Torreglosa29).
Among the 2535 participants of the BALANCE Program Trial, 2247 had complete baseline data on food consumption and were included. Individuals who had non-plausible daily energetic intake (<2092 or >25104 kj/d - <500 or >6000 kcal/d) were excluded from the analyses(Reference Andrade, Pereira and Sichieri30).
Ethics
The study was approved by the Hospital do Coração Ethics Committee (Protocol number nº: 1.171.748), Human Research Ethics Committee of the Universidade Federal de Viçosa (Protocol number nº: 882,612 and 1,020,056) and all the ethics committees of the other participating centres, following Brazilian and international ethical principles(31). The study began only after all centres approved the protocols(Reference Weber, Bersch-Ferreira and Torreglosa29) and the patients signed an informed consent form.
Food assessment
Energy intake, contents of carbohydrates, fibres, proteins, cardioprotective amino acids (arginine, glutamic acid, cysteine, glycine, histidine, leucine and tyrosine), branched amino acids (isoleucine, leucine and valine) and lipids, and food groups (cereals, vegetables, nuts and seeds, dairy products, legumes, fruits, eggs and meats, and fish) were evaluated by the mean food consumption recorded in two 24-h dietary recalls (R24h). The method used to apply the R24h was based on the Automated Multiple-Pass Method(Reference Moshfegh, Rhodes and Baer32). Quantitative analysis of the foods was performed on the Nutriquanti® software. The R24h were collected during the inclusion of patients in the study, and all seasons and periods of the year were considered. All centres participating in this study collected the same data.
Amino acid intake was estimated using the National Nutrient Database for Standard Reference (USDA)(33). The estimated composition of foods reported in the R24h, but not listed in the USDA table, was obtained by comparison with those that had similar nutritional compositions and cooking methods. The preparations were split into their constituent ingredients and, if no compositional match could be found for a prepared food, the composition of the raw ingredients was used instead. Amino acids intake was estimated with an electronic spreadsheet (Microsoft Excel®) developed especially for this purpose. Foods and preparations were categorised into food groups by compositional similarity(Reference Torreglosa34). All food intake variables were adjusted for daily energy intake using the residual method(Reference Willett, Stampfer and Willett35).
Demographic and behaviour variables
Data on demographic characteristics (sex and age), health-related behaviour such as physical activity (evaluated through the International Physical Activity Questionnaire)(Reference Avesani, Santos and Cuppari36,Reference Haskell, Lee and Pate37) and smoking, medication usage (anti-diabetic and antihypertensive drugs) and history of CVD (coronary disease and peripheral vascular disease) were collected by structured questionnaires applied by trained interviewers.
Anthropometry and blood pressure
Weight (kg), height (m) and waist circumference (cm)(38) were measured by trained professionals. The BMI was calculated as weight/height2 (kg/m2), and participants were classified with excess body weight when BMI ≥ 25 kg/m2 (adults – <60 years) or 27 kg/m2 (elderly – ≥ 60 years)(39,40) . The waist-to-height ratio was calculated by dividing waist circumference by height (cm)(Reference Ashwell and Hsieh41). Blood pressure was measured following the American Heart Association’s recommendations. HTN was diagnosed when SBP ≥ 130 mmHg and/or diastolic blood pressure (DBP) ≥ 85 mmHg and/or use of the antihypertensive drug(42).
Metabolic biomarkers
Blood samples were collected after 12–14 h of fasting. Classical cardiovascular risk markers, such as fasting glycaemia, TAG, total cholesterol and HDL-cholesterol, were evaluated. LDL-cholesterol was determined by the Friedewald formula. TyG index was calculated by the formula: Natural Logarithm (Ln) (fasting TAG (mg/dl) × fasting glucose (mg/dl)/2)(Reference Simental-Mendía, Rodríguez-Morán and Guerrero-Romero4). The LDL-cholesterol/HDL-cholesterol ratio was also calculated. Dyslipidaemia was defined as the presence of one or more of the following conditions: TAG ≥ 150 mg/dl; LDL-cholesterol ≥ 130 mg/dl; HDL-cholesterol ≤ 45 mg/dl and use of lipid-lowering medication(43). Type 2 diabetes mellitus was diagnosed when fasting blood glucose ≥ 100 mg/dl or the patient was using anti-diabetic drugs(44).
Statistical analysis
All descriptive statistics were analysed on the SPSS v.23 software for Windows (SPSS, Inc.). The normality of the data was evaluated by the Shapiro–Wilk test. The data are presented here as mean values and standard deviation, median (interquartile range) or absolute and relative frequency, when appropriate. Comparisons across quartiles of legume intake, histidine intake and TyG index were assessed by Kruskal–Wallis test or the χ 2 test, for continuous and categorical variables, respectively.
The MPlus® software, version 5.0, was used to explore the interrelationships between variables through path analysis. Path analysis, a subset of structural equation modelling(Reference Bentler and Stein45), is an extension of the regression analysis that simultaneously estimates the linear associations between all variables in a model(Reference Gamborg, Andersen and Baker46), which allows the evaluation of the total, direct and indirect effects of each variable on the outcome. Direct effects represent the direct relationships between two variables, interpreted similarly to a regression coefficient. Indirect effects, on the other hand, express a sequence of paths with at least one intermediate or mediating variable and are obtained by multiplying the direct effects between the variables belonging to that path. Finally, the total effect is calculated from the sum of direct and indirect effects between two variables(Reference Kline47,Reference Hair, Black and Babin48) . In this study, the term ‘effect’ is used to indicate association, not causality.
To evaluate the relationships of the intake of proteins, amino acids or source foods with blood pressure levels (SBP and DBP), several theoretical models were constructed according to the scientific literature on these relationships. All variables collected and available in the database that could mediate the relationship between food consumption and blood pressure were included in the models. The possibility of constructing latent variables or constructs (sets of variables)(Reference Hair, Black and Babin48), with food groups, branched amino acids and cardioprotective amino acids, was also evaluated; however, the construct variables showed excessively high correlations, indicating that, in this case, the indicators were measuring the same aspect of the constructs(Reference Kline47). Based on these findings, the intake of each amino acid was tested separately.
After finding a model with a good fit and with an amino acid (histidine) that was related to blood pressure, the correlation between histidine and groups of foods that are sources of protein and also had a relationship with the outcome (i.e. blood pressure) was evaluated. This procedure was implemented aiming at enriching the model and bringing more complex relationships between food consumption, the outcome and the potential mediators. Finally, the final model was constructed (Fig. 1), which presented a good fit and demonstrated the relationship of the consumption of legumes and histidine from food and blood pressure. Additional adjustments to the model were age, sex, physical activity, smoking, the use of anti-diabetic and antihypertensive drugs.
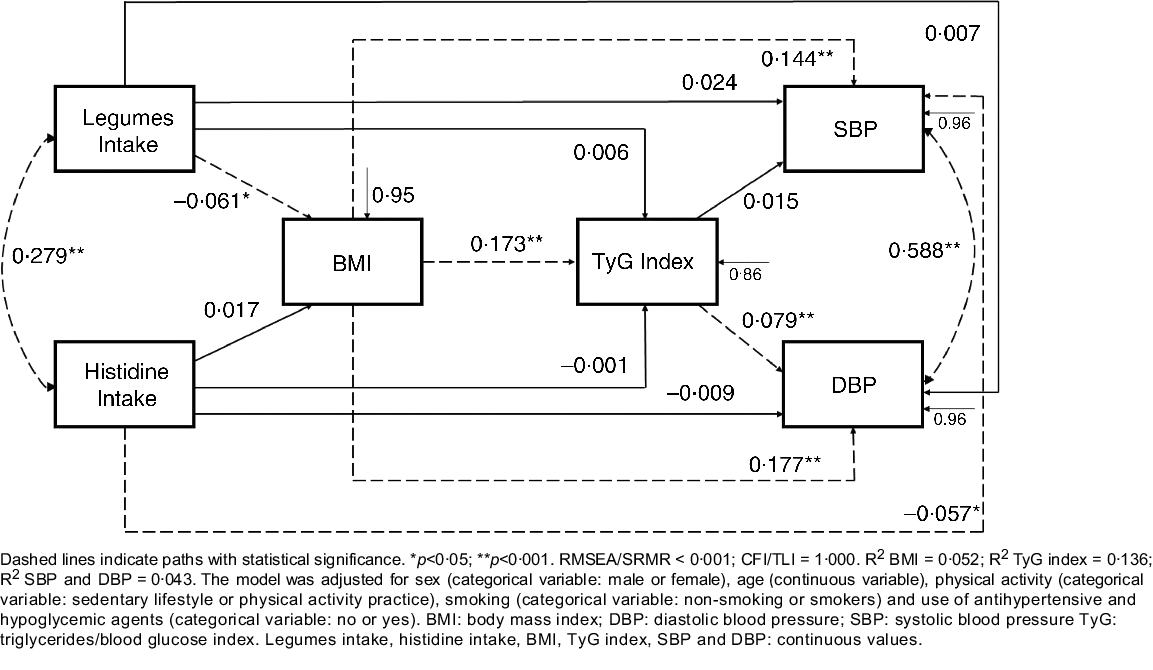
Fig. 1. Path model of relationships between food intake, cardiometabolic risk factors and blood pressure, constructed based on the baseline data from the BALANCE Program Trial (n 2247). Dashed lines indicate paths with statistical significance. *P < 0·05; **P < 0·001. RMSEA/SRMR < 0·001; CFI/TLI = 1·000. R 2 BMI = 0 052; R 2 TyG index = 0·136; R 2 SBP and DBP = 0·043. The model was adjusted for sex (categorical variable: male or female), age (continuous variable), physical activity (categorical variable: sedentary lifestyle or physical activity practice), smoking (categorical variable: non-smoking or smokers) and use of antihypertensive and hypoglycaemic agents (categorical variable: no or yes). DBP, diastolic blood pressure; SBP, systolic blood pressure; TyG, triglycerides/blood glucose index. Legumes intake, histidine intake, BMI, TyG index, SBP and DBP: continuous values.
The results are presented as standardised coefficients (SC), with their respective standard error and P values. The robust maximum likelihood method was used to estimate the parameters. This is a robust estimator that does not require the assumption of normal multivariate data distribution(Reference Kline47). To verify the fit of the model, the root mean square error of approximation and standardised root mean square residual were evaluated. These values are based on model residuals, with values <0·06 indicating that the theoretical model fits the data(Reference Hu and Bentler49,Reference Hooper, Coughlan and Mullen50) . Finally, the Tucker–Lewis index and comparative fit index were estimated, with values above 0·90 indicating a good fit(Reference Kline47). For all analyses, the significance level was set at 5 %.
Results
The sample included 2247 participants who underwent secondary care for CVD. The median age was 63·0 (45–91) years, 58·8 % (n 1321) of the participants were male and 96·5 % (n 2168) were diagnosed with HTN. The mean of the SBP and DBP was 129·6 (sd 22·7) mmHg and 78·6 (sd 4·36) mmHg, respectively. The mean of the TyG index, BMI, and legume and histidine intake was 8·6(sd 1·9), 29·1 (sd 4·9) kg/m2, 76·8 (sd 85·5) g/d and 1·79 (sd 0·96) g/d, respectively. The characteristics of the participants, according to quartiles of legume intake, histidine intake and TyG index (Q1 and Q4), are displayed in Table 1. Regarding legume intake, participants in the fourth quartile had lower BMI, waist-to-height ratio, total cholesterol and HDL-cholesterol than those in the first quartile. However, these individuals had higher values of LDL-cholesterol/HDL-cholesterol ratio compared with participants in the first quartile.
Table 1. Baseline characteristics of participants according to legume intake, histidine intake and TyG index quartiles, BALANCE Program Trial
(Medians and quartiles; frequencies and percentages)
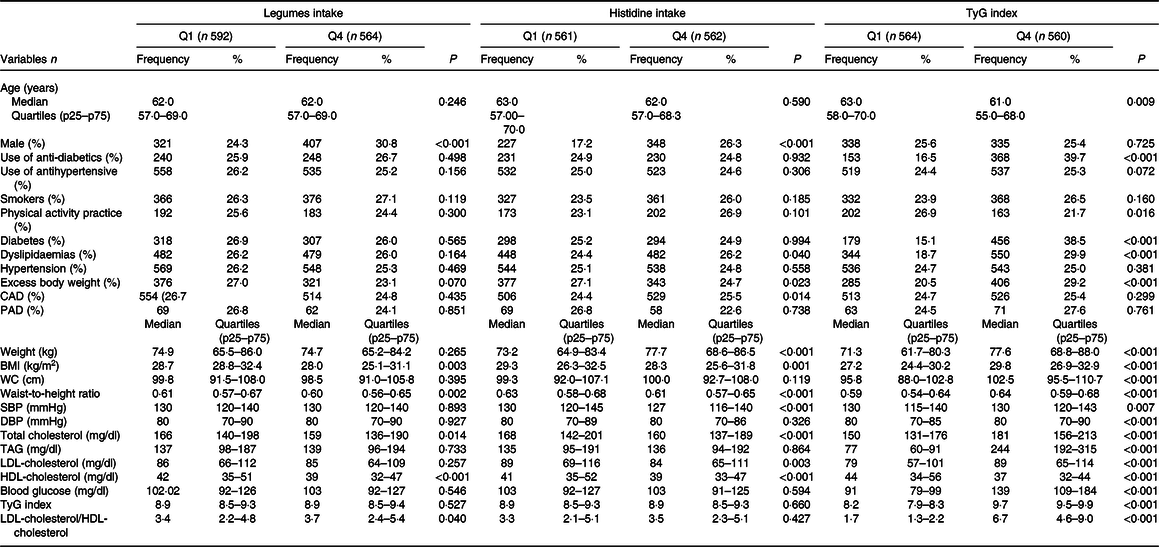
CAD, coronary disease; DBP, diastolic blood pressure; LDL-cholesterol/HDL-cholesterol, LDL-cholesterol/HDL-cholesterol ratio; PAD, peripheral artery disease; SBP, systolic blood pressure; TyG, triglycerides/blood glucose index; WC, waist circumference.
Data presented as frequency (%) or median and quartiles (p25–p75), when appropriate. P values according to χ 2 test for linear trends or Kruskal–Wallis test (by Mann–Whitney test of multiple comparison with Bonferroni correction). Legumes: Q1 (0·00–0·00 g/d) and Q4 (140·00–225·00 g/d); histidine Q1 (0·69–1·01 g/d) and Q4 (2·2·46–3·40 g/d); TyG index: Q1 (7·86–8·34) and Q4 (9·48–9·99).
Participants in the fourth quartile of histidine intake had lower BMI, waist-to-height ratio, SBP, total cholesterol, LDL-cholesterol and HDL-cholesterol compared with the first quartile, and those with excess body weight were more often placed in the first quartile of histidine intake. Moreover, those in the fourth quartile of the TyG index presented higher values of anthropometry, blood pressure and metabolic markers compared with the first quartile. The use of anti-diabetic drugs and individuals with diabetes, dyslipidaemias and excess body weight were most often found in the fourth quartile (Table 1). The participants in the fourth quartile of legume intake exhibited higher values of intake of energy content, carbohydrates, fibre, proteins, cardioprotective amino acids, branched amino acids, cereals, vegetables, eggs and meats, when compared with the first quartile (Table 2). Furthermore, the subjects in the last histidine intake quartile had higher values of energetic and macronutrient intake, compared with the first quartile. Additionally, the participants in the fourth quartile of the TyG index displayed only lower values of carbohydrate intake (Table 2).
Table 2. Nutrients and food consumption of participants at baseline according to legume intake, histidine intake and TyG index quartiles, BALANCE Program Trial
(Medians and quartiles)

Data presented as frequency (%) or median and quartiles (p25–p75), when appropriate. P values according to χ 2 test for linear trends or Kruskal–Wallis test (by Mann–Whitney test of multiple comparison with Bonferroni correction). Legumes: Q1 (0·00–0·00 g/d) and Q4 (140·00–225·00 g/d); histidine Q1 (0·69–1·01 g/d) and Q4 (2·2 ·46–3·40 g/d); TyG index: Q1 (7·86–8·34) and Q4 (9·48–9·99). Food intake variables were adjusted for daily energy intake using the residual method.
In the path analysis model (Fig. 1), histidine intake was negatively associated with SBP (SC = −0·057; P = 0·012) and legume intake was negatively associated with BMI (SC = −0·061; P = 0·006). Conversely, BMI was positively associated with TyG index (SC = 0·173; P < 0·001), SBP (SC = 0·144; P < 0·001) and DBP (SC = 0·177; P < 0·001). TyG index was positively associated with DBP (SC = 0·079; P = 0·001). Histidine and legume intake (r = 0·279; P < 0·05), and SBP and DBP (r = 0·588; P < 0·01) were positively correlated. In a second and third model (online Supplementary Material), additionally adjusted for fruit and vegetable intake, respectively, the present effects remained significant.
Table 3 presents the direct, indirect and total effects of the relationships between histidine and legume intake, BMI, TyG index, SBP and DBP. Significant negative indirect effects were observed for BMI-mediated relationships of legume intake with SBP (SC = −0·009; P = 0·011) and DBP (SC = −0·010; P = 0·011). An indirect negative effect of legume intake on DBP, mediated simultaneously by BMI and TyG index (SC = −0·001; P = 0·037), was also observed.
Table 3. Direct, indirect and total coefficients of the mediation relationships of the path model, using baseline data from the BALANCE Program Trial (n 2247)
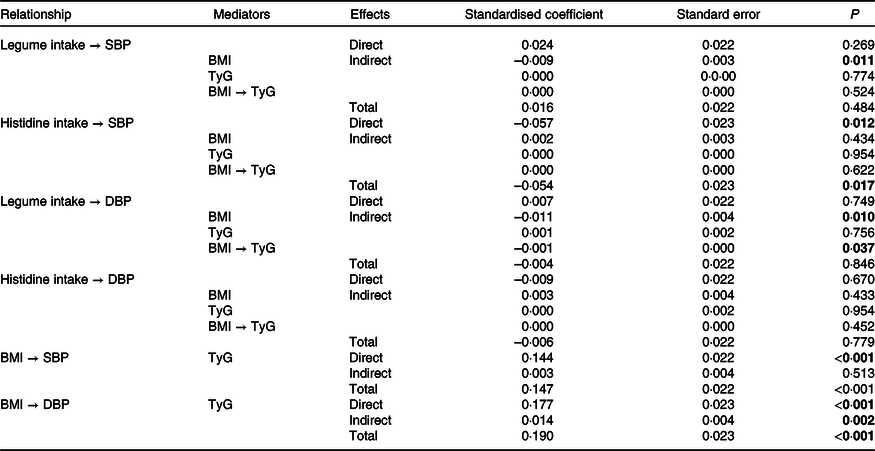
DBP, diastolic blood pressure; SBP, systolic blood pressure; TyG, triglycerides/blood glucose index.
P values in bold have statistical significance (P < 0·05).
Discussion
This study contributes to the understanding of the relationships of intake of legumes and cardioprotective amino acids with blood pressure levels, as well as the mediating role of metabolic risk factors for HTN, such as adiposity (BMI) and IR (TyG index).
The first relevant results in the study are the negative indirect association of legume intake with SBP, mediated by BMI, and with DBP, mediated by BMI and TyG. Besides, the intake of legumes is negatively and directly associated with BMI. In this sense, legumes, which are rich in fibre, can control body weight owing to their reduced energy density, favouring the reduction of energy intake. Furthermore, legumes require more chewing before ingestion, increasing satiety and, thus, contributing to reducing the size of the consumed portions. Finally, nutrients from legumes are absorbed slowly, contributing to a greater feeling of satiety(Reference Wanders, van den Borne and de Graaf51). Altogether, the consumption of legumes can directly influence body weight control, which in turn can prevent IR, both of which are important risk factors for the onset of uncontrolled blood pressure.
Additionally, legumes contain micronutrients, phytosterols and polyphenols, which bring other health benefits(Reference Briggs, Petersen and Kris-Etherton52,Reference Li, Mejia and Lytvyn53) . Isoflavones and anthocyanins, bioactive compounds of the flavonoids class (polyphenols), have high antioxidant activity and can act on IR control. Anthocyanins activate the AMP-activated protein kinase, which in turn promotes the translocation of GLUT4 on the membrane, facilitating the transport and uptake of glucose to the muscle and, consequently, improving insulin sensitivity. Furthermore, the activation of AMP-activated protein kinase contributes to the increasing of adiponectin in adipocytes. The adiponectin has documented anti-inflammatory and anti-diabetic effects. In turn, isoflavones can act on the adipose tissue by inhibiting the activity of the PPARγ, an essential regulator of adipocyte differentiation. PPARγ can decrease the accumulation of lipids in adipocytes, which contributes to glucose and lipid homoeostasis regulation. Also, isoflavones can act in the adipose tissue to reduce the concentration of resistin, an adipokine known to promote IR(Reference Clark, Taylor and Zahradka54).
Legumes are also good sources of proteins, including histidine, a recognised cardioprotective amino acid(Reference Kessler and Raja55). Based on that, another outstanding result was the direct and negative effect of histidine intake on SBP. Other authors have also found that a higher histidine intake was associated with lower values of SBP, DBP(Reference Jennings, MacGregor and Welch19) and risk of CVD(Reference Jennings, MacGregor and Welch19,Reference Mirmiran, Bahadoran and Ghasemi28) . The inverse association between serum concentrations of histidine and SBP has also been found(Reference Mels, Delles and Louw56). Histamine is a compound synthesised from histidine by the histidine decarboxylase. When the body release histamine, it can bind to the H3 receptor, a type of histaminergic receptor in the brain. As a consequence, the central nervous system signalling may result in increased nitric oxide concentrations(Reference Toba, Nakamori and Tanaka23), which has the effect of relaxing vascular smooth muscle, thereby reducing vascular resistance(Reference Cerqueira and Yoshida57).
Positive direct associations between BMI and the TyG index and between BMI and SBP/DBP were observed as well. Individuals with excess weight and body fat, mainly visceral fat, have a low-grade chronic inflammation, which inhibits insulin signalling in the adipocytes. Lipolysis is more sensitive to the action of insulin. A failure to suppress lipolysis through the effect of insulin, especially in insulin-resistant visceral adipose tissue, leads to increased concentrations of free circulating fatty acids. These higher concentrations directly affect liver and muscle metabolism, further contributing to IR(Reference Freeman and Pennings3,Reference Ye58,Reference Minihane, Vinoy and Russell59) . In addition, the interaction of alterations caused by excess weight, such as IR, inflammation, oxidative stress and increased activity of the sympathetic nervous system, can result in endothelial dysfunction, changes in body haemodynamics and increased blood pressure levels(Reference Jordan, Kurschat and Reuter60,Reference Cohen61) . Moreover, the TyG index showed a positive direct association with DBP; other studies had already found an association between the TyG index and HTN(Reference Mao, Zhou and Li62–Reference Zhu, Wang and Chen65). The IR may be involved in the molecular processes related to the development of HTN. Insulin, through the INSR-IRS1-PI3K-Akt-eNOS signalling pathway, stimulates the nitric oxide activation, favouring the vasodilation process of the vessels(Reference Beale66). However, there is a negative modulation of this pathway in IR conditions, reducing nitric oxide production. In this study, an association of IR (TyG index) was found only with DBP. This relationship can be justified by the fact that the increase in DBP or isolated diastolic HTN is mainly related to the rise in peripheral vascular resistance(Reference Luna and Luna67–Reference Ahmed, Pervin and Biswas69). It is known that IR favours the increase in peripheral vascular resistance through increased activity of the sympathetic nervous system(Reference Tack, Smits and Willemsen70).
The present study found relationships between legume intake and SBP (mediated by BMI) and DBP (mediated by BMI and IR). This finding was only possible through the application of path analysis, which allowed the verification of direct and indirect effects between two variables(Reference Amorim, Fiaccone and Santos71). It should be noted that both BMI and IR are important risk factors for HTN(2,Reference Freeman and Pennings3) , and because the variables of food consumption assessed here have a direct effect on these risk factors, they can also contribute to the development of HTN. It is also noteworthy that dietary strategies are very important during the treatment of secondary care patients in cardiology to control blood pressure, aiming at a better quality of life and the prevention of the recurrence of cardiovascular events(Reference Yu, Malik and Hu12).
The strengths of the present study are its multicentre design, which evaluated a large number of individuals with CVD in all five regions of Brazil, and the robust data analysis strategy, including the path model analysis, which allows a simultaneous assessment of linear associations between all variables in a single model. The use of the TyG index making it a good method to predict IR(Reference Simental-Mendía, Rodríguez-Morán and Guerrero-Romero4,Reference Vasques, Novaes and de Oliveira72,Reference Guerrero-Romero, Simental-Mendía and González-Ortiz73) and cardiometabolic risk(Reference Irace, Carallo and Scavelli5,Reference Mao, Zhou and Li62,Reference Zhou, Pan and Yan64,Reference Vega, Barlow and Grundy74) . This is one of the first studies to investigate the relationship between food intake and TyG index, and the first to indicate TyG as a metabolic pathway between food intake and blood pressure. However, there are also a few limitations. First, the cross-sectional design makes it hard to infer a cause–effect relationship between the results found here. Second, alcohol consumption and intake of Na, K, other nutrients related to cardiovascular health and use of dietary supplements were not evaluated. We really cannot rule out the possibility of residual confounding for these variables. Food consumption was assessed exclusively through the R24h; it does not provide an estimate of ‘usual or habitual intakes’, which would be important when investigating associations between food intake and health outcomes. However, when a study aims to determine the average intake for a group or population, only a single R24h can be performed, especially when the sample size is large enough(75). Additionally, this food survey has been used in epidemiological studies that evaluated the relation between food intake and cardiometabolic risk factors with promising results and acceptance by the scientific community(Reference de Almeida, Mayumi and Prado76–Reference Da Silva, Bersch-Ferreira and Torreglosa79). Finally, we did not measure serum histidine concentrations; however, plasma concentrations of amino acids may not directly reflect the consumption of these nutrients through the diet(Reference Jennings, MacGregor and Pallister20,Reference Mccormack, Shaham and Mccarthy80) .
Conclusion
The higher consumptions of histidine and legumes have direct and mediated effects, respectively, that promote lower blood pressure. These results may contribute to the planning of dietary strategies for individuals with CVD, considering the beneficial effects of amino acids and vegetable food sources of protein on cardiovascular health.
Acknowledgements
We thank all the patients for participating in this project, and all participating centres: Cristiane Kovacs – Instituto Dante Pazzanese de Cardiologia, São Paulo – SP. Annie S B Moreira – Hospital Universitário Pedro Ernesto, Rio de Janeiro – RJ e Instituto Nacional de Cardiologia, Rio de Janeiro – RJ. Rosileide S Torres – Hospital das Clínicas Gaspar Vianna, Belém – PA. Helyde A Marinho – Instituto Nacional de Pesquisas da Amazônia, Manaus – AM. Cristina H de Matos – Universidade Vale do Itajaí, Itajaí – SC. Renata T A Bertacco – Universidade Federal de Pelotas, Pelotas – RS. Gabriela C Souza – Hospital de Clínicas de Porto Alegre, Porto Alegre – RS. Gabriela S Shirmann – Universidade da Região da Campanha, Bagé – RS. Francisca E Z Nagano – Hospital de Clínicas da Universidade Federal do Paraná, Curitiba – PR. Maria E M Ramos – Hospital Universitário Associação Educadora São Carlos, Canoas – RS. Soraia Poloni – Instituto de Cardiologia do Rio Grande do Sul, Porto Alegre – RS. Raquel M El Kik – Hospital São Lucas da Pontifícia Universidade Católica do Rio Grande do Sul, Porto Alegre – RS. Naoel H Feres – Universidade Federal do Mato Grosso, Cuiabá – MT. Eliane S Dutra – Hospital Universitário de Brasília, Brasília – DF. Ana P P F Carvalho – Hospital das Clínicas de Goiânia, Goiânia – GO. Marta M David – Hospital Universitário Maria Aparecida Pedrossian, Campo Grande – MS. Isa G Rodrigues – Pronto Socorro Cardiológico Universitário de Pernambuco, Recife – PE. Antonio C S Sousa – Hospital São Lucas, Aracaju – SE. Amanda G L Coura – Hospital Universitário Alcides Carneiro, Campina Grande – PB. Josilene M F Pinheiro – Hospital Universitário Ana Bezerra, Santa Cruz – RN. Sandra M L Vasconcelos – Universidade Federal de Alagoas, Maceió – AL. Andreza M Penafort – Universidade de Fortaleza, Fortaleza – CE. Daniele M O Carlos – Hospital de Messejana, Fortaleza – CE. Viviane Sahade – Hospital Universitário Professor Edgard Santos, Salvador – BA. Adriana B Luna – Hospital Universitário da Universidade Federal de Sergipe, Aracaju – SE. José A F Neto – Hospital Universitário da Universidade Federal do Maranhão, São Luís – MA. Emilio H Moriguchi – Associação Veranense de Assistência em Saúde, Veranópolis – RS. Maria C O Izar – Universidade Federal de São Paulo, São Paulo – SP. Sônia L Pinto – Universidade Federal de Tocantins, Palmas – TO. Hospital São Vicente de Paulo, Luciano M Backes – Passo Fundo – RS. Simone R Souza – Instituto Estadual de Cardiologia Aloysio de Castro, Rio de Janeiro – RJ. Magali C C – COTENUT, Porto Alegre – RS.
This study was supported by the Hospital do Coração (HCor) as part of the PROADI-SUS, in partnership with the Brazilian Ministry of Health. This study was also funded in part by the Coordenação de Aperfeiçoamento de Pessoal de Nível Superior (CAPES) – Financial Code 001. J Bressan and HHM Hermsdorff are research productivity fellows of CNPq (Ministry of Science and Technology, Brazil).
A. C. B.-F., C. R. T. and B. W. worked in the conception and design of the study. A. C. B.-F., C. R. T., B. W., H. H. M. H. and J. B. performed data collection. A. C. B-F., A. M., A. P. A., B. W., C. R. T., L. J. L., J. B. and H. H. M. H. performed the assembly, analysis and interpretation of the data. A. P. A. and H. H. M. H. wrote the manuscript. All authors read and approved the final manuscript.
No potential conflict of interest relevant to this article was reported.
Supplementary material
For supplementary material referred to in this article, please visit https://doi.org/10.1017/S0007114521005018


