


Non-communicable diseases (NCD) are responsible for 70 % of all deaths worldwide(1). The majority of premature deaths occur in developing countries, which are going through a nutrition transition characterised by soaring rates of obesity(Reference Popkin, Adair and Ng2–Reference Ng, Fleming and Robinson6). Obesity and NCD are largely attributed to a poor diet(Reference Forouzanfar, Afshin and Alexander7) characterised by high intakes of ultra-processed food products, which are not only convenient, cheap and palatable but also energy-dense and with excessive content of critical nutrients such as saturated fats, sugars and Na(Reference Monteiro, Moubarac and Cannon8). As in many low-middle income countries, ultra-processed food sales have rapidly increased in Guatemala, where obesity is a growing public health problem, and the majority of deaths (69 %) are related to NCD(9).
Dietary patterns are influenced by the food environment, including the nutritional information available on food labels(Reference Swinburn, Sacks and Vandevijvere10). Hence, it is important to assess the nutritional information available for consumers and the nutritional quality of food products. Food labels have shown to influence food choices and to promote healthier diets(Reference Campos, Doxey and Hammond11,Reference Cowburn and Stockley12) . The Central American Technical Regulations – RTCA – for food and beverages labelling, created by the Central American Council of Ministers of Economic Integration, establish declarations of some critical nutrients, but only if manufacturers claim a nutritional or a health-related property(13).
The Pan American Health Association (PAHO) and the WHO have proposed nutrient profiling models to assess the nutritional quality of food products and to guide member states to develop and implement public health programmes for reducing obesity and NCD(14,15) . These models take into consideration the nutritional composition with specific thresholds for critical nutrients. Nutrient profiling systems have been used to support public health initiatives, aiding consumers in selecting healthier options(Reference Tetens, Oberdörfer and Madsen16,Reference Lobstein and Davies17) .
In Guatemala, unlike many high-income countries, nutrition facts label is still voluntary(13). The proportion of processed and ultra-processed food products with adequate nutrition labelling and the nutritional quality (i.e. according to PAHO and WHO-European nutrient profiling models) of those products is currently unknown. Hence, the aim of this study was to assess, for the first time, the nutritional declarations on labels, the nutritional quality and the processing degree of pre-packaged foods sold in Guatemalan supermarkets.
Methods
Data collection
We adapted the data collection methodology proposed by the Food Monitoring Group(Reference Dunford, Webster and Metzler18,Reference Dunford19) . We selected supermarkets in Guatemala, based on market share data by Euromonitor International(20), and data collection was carried out in three waves. In 2015, we photographed 924 products from the following categories: soup, bread, mayonnaise, cookies, cakes, breakfast cereals, cheese, dairy, snacks, condiments, beverages, processed meats and pasta. All products in these categories were photographed in the following supermarkets located in Guatemala City: Walmart, Paiz, La Torre, Maxibodega, Fresko and Puerta del Sol. In 2016, we photographed all available pre-packaged food products from La Torre and Econosuper, two distinct retail formats from the chain Unisuper (n 2536). In 2017, seventy-three Walmart private brand products (Suli®, Sabemas® and Great Value™) were added to the sample. All products were purchased at the store, since Walmart did not allow taking pictures on-site (Fig. 1). All pre-packaged foods were photographed between August 2015 and January 2017. All photographs were taken by four research assistants. Illegible photographs were retaken. Products available in more than one retailer, different sizes or repeated products were entered into the database only once and with the most recent information. We excluded packages with multiple products, baby foods, infant formula, coffee, tea, spices and alcoholic beverages from both nutrient profiling analysis, as they are not contemplated in those models.

Fig. 1 Data collection periods, supermarkets and final sample size of photographed pre-packaged foods
Study data were entered in duplicate, using REDCap™ (Vanderbilt University), an electronic data capture tool(Reference Harris, Taylor and Thielke21). Discrepancies were checked against the original photograph. We extracted nutritional information from labels, and two nutritionists categorised products separately. If there was disagreement, a third person was involved to reach consensus.
Nutrient declarations, nutrient content and food labelling information
Declaration and content for energy; total, saturated and trans-fats; total and added sugars; and salt/Na were extracted from nutrition facts label. We also extracted information on the manufacturing country, to differentiate Central American products. Central American products were defined as those manufactured in Guatemala, Belize, Honduras, El Salvador, Costa Rica, Nicaragua and Panama, as these countries follow the RTCA regulations.
When available, we also used the ingredient list to identify artificial sweeteners, additives and the ingredient list, to differentiate between processed and ultra-processed food(14).
Food products classifications
NOVA classification
Products were classified according to their processing degree using the NOVA food classification system groups: 1) unprocessed or minimally processed; 2) processed culinary ingredients; 3) processed and 4), ultra-processed products. A detailed description of this classification system is reported elsewhere(Reference Monteiro, Cannon and Levy22,Reference Monteiro, Levy and Claro23) .
Pan American Health Association nutrient profile model
This model classifies products as ‘excessive in’ if they exceed the following thresholds: total fats: 30 % of total energy; saturated fats: 10 % of total energy; trans-fats: 1 % of total energy; Na: 1 mg per energy; added sugars: 10 % of total energy and sweeteners: any amount of artificial sweeteners. Free sugars were estimated with the method proposed by PAHO, based on total sugars and food group, taking into consideration if the products contain ingredients with natural sugars, such as fruit or milk(14). Products with excessive content of at least one critical nutrient were considered as not meeting the model’s nutritional criteria. The presence of artificial sweeteners was assessed from the ingredient list, when available. Since this model was created to assess the nutritional quality of processed and ultra-processed products, we considered products from NOVA groups 1 and 2 as meeting the nutritional criteria. As indicated by the PAHO nutrient profile, only products with declaration of energy, total, saturated and trans-fats; sugars, and salt/Na were included in this classification.
WHO-Europe nutrient profile model classification
We classified products into seventeen food groups, defined by the WHO-Europe nutrient profile model(15). We created another group (Others) for products that did not fit into any category (e.g. condiments, vinegar, flavouring/colourant agents). The model defines specific thresholds for each food group in order to determine whether the content of energies, fats, Na and sugars meets WHO recommendations. The specific thresholds for each food group are described elsewhere(15). Finally, the WHO-Europe nutrient profile classifies products into two groups, according to whether the food group meets nutritional criteria for advertising targeted to children. Confectionery, energy bars, cakes and sweets, juices, energy drinks and edible ices do not meet criteria to be advertised, whereas fresh and frozen meat, poultry, fish, fruit, vegetables and legumes automatically meet nutritional criteria. For other categories, if the product exceeds the specific thresholds, the product is classified as ‘not meeting nutritional criteria’.
For classification purposes with PAHO and WHO systems, if a product had no specific declaration of saturated or trans-fats, but the label reported 0 g of total fats, it was considered as ‘meeting nutritional criteria’ in saturated/trans-fats. The same approach was considered when total carbohydrates were 0 g, but no declaration of total or added sugars was made.
Data analysis
We evaluated the proportion of foods declaring energy; total, saturated, and trans-fats; total and added sugars; and salt/Na (critical nutrients). Nutrient content was standardised to a portion of 100 g or 100 ml (including beverages or products requiring reconstitution). We only analysed products with all information necessary for classification according to the PAHO and WHO-Europe nutrient profile systems.
We also calculated the median content of energy, total/saturated/trans-fats, total/added sugars and Na and the proportion of unclassifiable products (e.g. the model was not applicable or information available on the package was not sufficient to classify the product by healthiness or processing degree). For both WHO and PAHO nutrient profile models, we calculated the proportion of products meeting and not meeting nutritional criteria and the overall proportion of processed or ultra-processed products (NOVA classification groups 3 and 4) not meeting the nutritional criteria for critical nutrients.
Finally, we compared nutrient declarations between Central American products and products manufactured elsewhere. We used χ 2 tests to assess for differences between proportions, including 95 % CI. We also used the Mann–Whitney U test to compare nutritional content between products meeting/not meeting nutritional criteria. Analyses were conducted using STATA software version 13.0 (StataCorp LP).
Results
We collected data for 3533 pre-packaged products. Seventy-four products were excluded due to wrong nutritional information (e.g. the amount of a single macronutrient or the sum of all three macronutrients exceeded the portion size), leaving 3459 products for analyses. The largest categories were beverages (15·2 %), confectionery (11·5 %) and savoury snacks (8·6 %). The number of products in each category ranged from 387 (beverages) to 47 (edible ices) (Table 1). Most products were classified as ultra-processed (80·9 %).
Table 1 Critical nutrient declaration on pre-packaged foods sold in supermarkets in Guatemala*
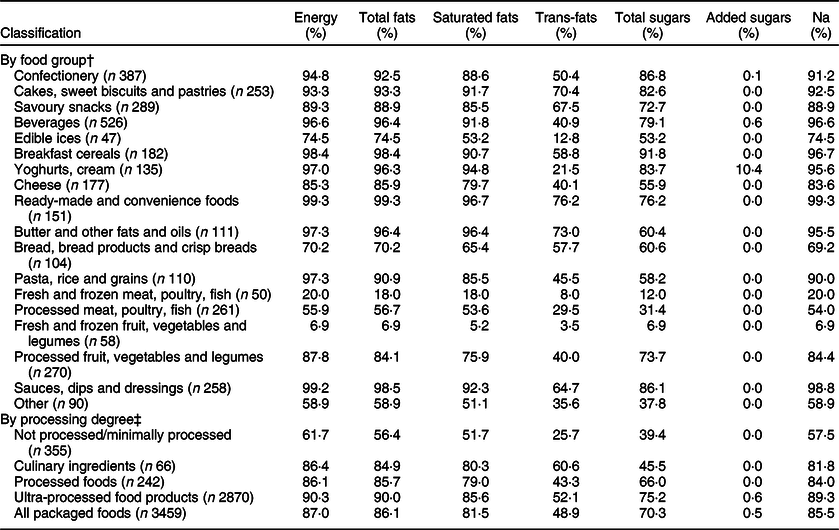
* Percentages are the proportion of packaged food with nutrient declaration by each food group classification.
† Food groups classification based on the WHO/European nutrient profile model(15).
‡ Level of processing: Not processed/minimally processed, culinary ingredients, processed foods and ultra-processed food groups were classified according to the NOVA food classification system(Reference Monteiro, Cannon and Levy22,Reference Monteiro, Levy and Claro23) .
Nutrient declarations
We found that 12·7 % of packaged products had no nutritional information. This proportion was higher for processed compared with ultra-processed foods (13·9 v. 9·5 %, P = 0·024). None of the food products declared any critical nutrient, while 72·0 % of products declared five or six. Not processed/minimally processed products showed the least nutritional information, but few categories such as processed meats, bread and edible ices displayed little information too (43·3, 29·8 and 25·5 % had no declaration of any critical nutrient, respectively). The least declared critical nutrient on packages was added sugars (0·5 %), followed by trans-fats (48·9 %) and total sugars (70·3 %) (Table 1).
Products manufactured in Central America had fewer declarations of critical nutrients compared with products manufactured elsewhere. This was true for all critical nutrients (P < 0·001): energy (83·0 v. 94·1), total fats (82·0 v. 93·3), saturated fats (77·5 v. 88·8), trans fats (43·4 v. 58·9), total sugars (61·4 v. 86·2), added sugars (0·0 v. 1·5) and Na (82·0 v. 91·7).
Content of critical nutrients
The most energy-dense food groups were butter and oils (median of 3347·2 kJ/100 g), followed by snacks (2122·5432 kJ/100 g), and cakes and pastries (1781·1288 kJ/100 g). Pre-packaged fresh fruit and vegetables were the least energy-dense foods (143·5112 kJ/100 g). Although unprocessed/minimally processed foods had a median energy density of 1486·5752 kJ/100 g, when excluding pasta, rice and grains, the median value decreased to 572·3712 kJ/100 g. Culinary ingredients had a high proportion of oils (74·5 %), which explains the median energy density of 3514·56 kJ/100 g. Processed and ultra-processed products had median energy densities of 392·4592 and 1321·3072 kJ/100 g, respectively (Table 2).The levels of saturated fats per 100 g were the highest in butter and oils (18 g), cheese (14·3 g) and edible ices (12·9 g). Only 4 % of products declared trans-fats, which explains the median level of 0 g in all food groups categories.
Table 2 Critical nutrient of pre-packaged foods sold in supermarkets in Guatemala (per 100 mg or 100 ml)*
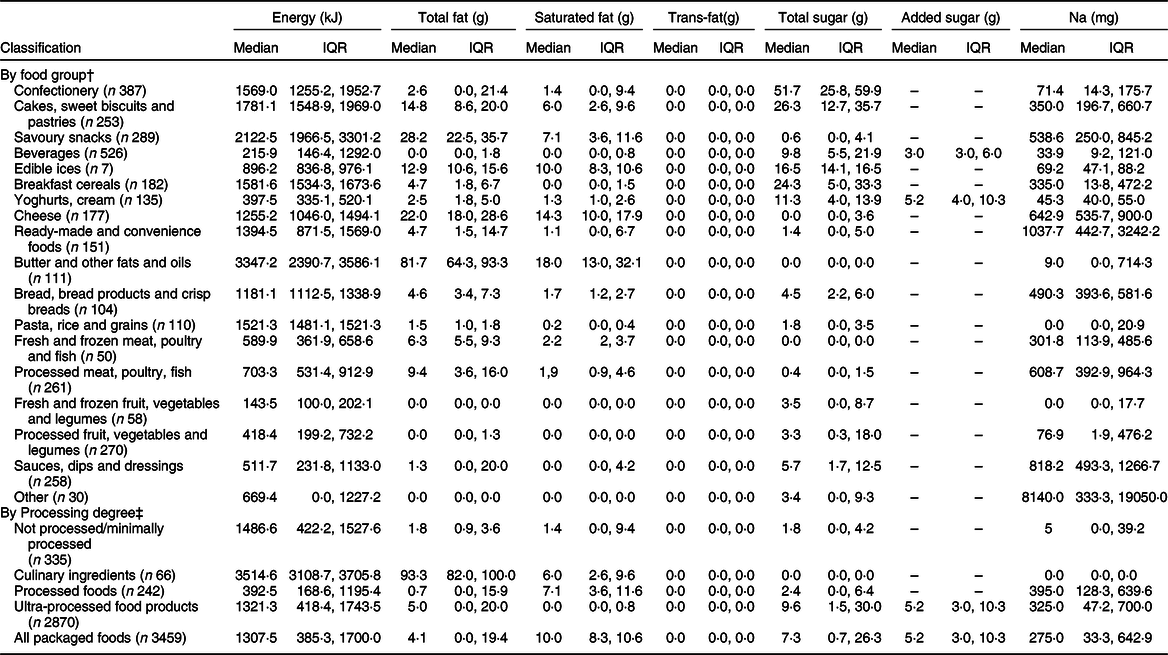
IQR, Interquartile range (percentile 25, percentile 75).
* Percentages are the proportion of packaged food with nutrition declarations by each food group classification.
† Food groups classification are based on the WHO/European nutrient profile model(15).
‡ Level of processing: Not processed/minimally processed, culinary ingredients, processed foods and ultra-processed food groups were classified according to the NOVA food classification system(Reference Monteiro, Cannon and Levy22,Reference Monteiro, Levy and Claro23) .
The highest levels of total sugars per 100 g were found in confectionery (51·7 g), cakes and pastries (26·3196 g) and breakfast cereals (24·3 g). Added sugars could not be evaluated, since only eighteen products included such information on the label. The highest level of Na was found in processed foods (395 mg). The category with the highest content of Na was ‘others’ (8140·0 mg) which includes condiments, followed by ready-made/convenience foods (1037·7 mg).
Products that do not meet the PAHO nutritional criteria were higher in Na (median 343·7 v. 12·5 mg/100 g, P < 0·0001); total sugars (9·4 v. 1·1 g/100 g, P < 0·0001); added sugars (7·5 v. 0·0 g/100 g, P < 0·0001); saturated fats (0·6 v. 0·0 g/100 g, P = 0·0427) than those who meet criteria. We did not find a significant difference for total or trans-fats. With the WHO model, products not meeting criteria was also higher in Na (320·0 v. 48·0 mg/100 g, P < 0·0001); total sugars (10·5 v. 0·8 g/100 g, P < 0·0001); added sugars (7·1 v. 0·0 g/100 g, P < 0·0001); total fats (6·3 v. 2·0 g/100 g, P < 0·0001) and saturated fats (1·8 v. 0·5 g/100 g, P < 0·0001). In relation to trans-fats, we found higher content in products that did not meet nutritional criteria, (P = 0·0021), even though medians were 0.
Nutrient profiling systems
From the 3459 products, 1266 (36·6 %) could not be assessed as meeting/not meeting criteria with the PAHO model because nutrient information was missing. Unprocessed/minimally processed foods and culinary ingredients (n 424) were considered to meet the model’s criteria (Fig. 2). Of the ultra-processed and processed products with enough information to be classified (n 1769), 98·2 % and 90·2 % of products, respectively, did not meet the criteria for at least one critical nutrient (Table 3). Most products were excessive in 1–2 (64·2 %) or 3–4 (33·6 %) critical nutrients.

Fig. 2 Proportion of pre-packaged foods available in Guatemala that meet PAHO and WHO nutritional criteria. † Pan American Health Organization (PAHO): Products with excessive content of at least one nutrient were considered as not meeting the model’s nutritional criteria using the following thresholds: 30 % of total energy; saturated fats (SF): 10 % of total energy; trans-fats: 1 % of total energy; Na: 1 mg per energy; added sugars (AS): 10 % of total energy and non-sugar sweeteners (NSS): any amount of artificial sweeteners. Free sugars were estimated with the method proposed by PAHO, based on total sugars and food group, taking into consideration if the products contain ingredients with natural sugars, such as fruit or milk(14). ‡ WHO: Confectionery, energy bars, cakes and sweets, juices, energy drinks and edible ices ‘do not meet nutritional criteria’. Fresh and frozen meat, poultry, fish, fruit, vegetables and legumes ‘meet nutritional criteria’. For the other categories, specific thresholds were used for each food group per 100 g. Breads: 2·5 g total fat (TF), 0 g AS, 0 g NSS. Other beverages: 0 g AS, 0 g NSS. Breakfast cereals: 10 g TF, 15 g total sugars (TS) and 1·6 g salt. Yoghurts, sour milk and others: 2·5 g TF, 2·0 g SF, 10 g TS, 0·2 g salt. Cheese: 20 g TF and 1·3 g salt. Ready-made and convenience foods: 10 g TF, 4 g SF, 10 g TS, 1 g salt and 941·4 kJ. Butter and oils: 20 g SF and 1·3 g salt. Bread, bread products and crisp breads: 10 g TF, 10 g TS and 1·2 g salt. Fresh or dried pasta, rice and grain: 10 g TF, 10 g TS and 1·2 g salt. Processed meat, poultry and fish: 20 g TF and 1·7 g salt. Processed fruit, vegetables and legumes: 5 g TF, 10 g TS, 0 g AS and 1 g salt. Sauces, dips and dressings: 10 g TF, 0 g AS and 1 g salt(15). ![]() , Meets nutritional criteria;
, Meets nutritional criteria; ![]() , missing information;
, missing information; ![]() , does not meet nutritional criteria;
, does not meet nutritional criteria; ![]() , model not applicable
, model not applicable
Table 3 Proportion of pre-packaged foods not meeting nutritional criteria according to the Pan American Health Association (PAHO)* nutrient profile model
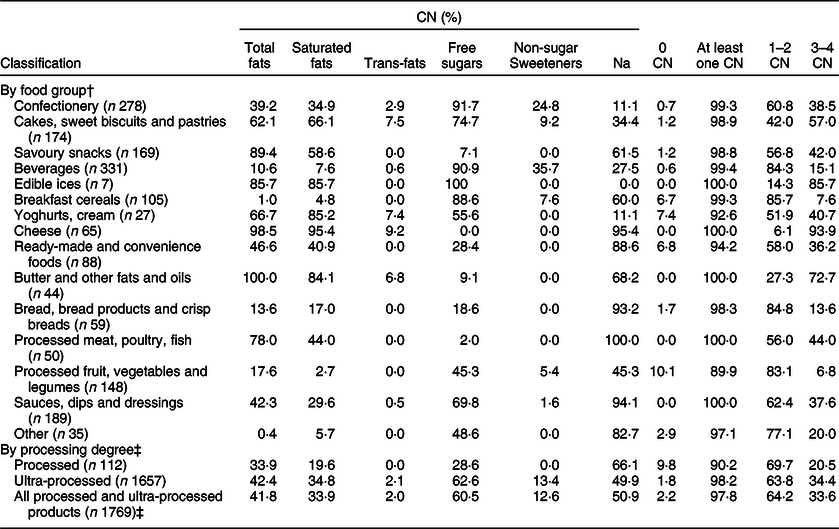
CN, critical nutrient.
* PAHO: Products with excessive content of at least one nutrient were considered as not meeting the model’s nutritional criteria using the following thresholds: 30 % of total energy; saturated fats: 10 % of total energy; trans-fats: 1 % of total energy; Na: 1 mg per energy; added sugars: 10 % of total energy; sweeteners: any amount of artificial sweeteners. Free sugars were estimated with the method proposed by PAHO, based on total sugars and food group, taking into consideration if the products contain ingredients with natural sugar, such as fruit or milk(14).
† Food groups classification based on the WHO/European nutrient profile model(15).
‡ Processing degree: processed foods and ultra-processed food groups were classified according to the NOVA food classification system(Reference Monteiro, Cannon and Levy22,Reference Monteiro, Levy and Claro23) . Only processed/ultra-processed products with declaration of necessary critical nutrients were included.
Sixty percentage of all processed and ultra-processed products did not meet the nutritional criteria for added sugars. All of the edible ices and most of the confectionery (91·7 %), beverages (90·9 %), breakfast cereals (88·6 %) and cakes, biscuits and pastries (74·7 %) were excessive in added sugars. Artificial sweeteners were present in 12·6 % of products.
More than half of the products did not meet nutritional criteria for Na, especially processed meat (100 %), cheese (95·4 %) and bread (93·2 %). The categories not meeting criteria for saturated fats were cheese (95·4 %), edible ices (85·7 %) and yoghurts and cream (85·2 %). Two percentage of the products had excessive amounts of trans-fats. The proportion was higher in cheese (9·2 %), cakes (7·5 %), yoghurts and cream (7·4 %), and butter/ oils (6·8 %).
With the WHO-Europe model, 592 (17·1 %) did not have all the necessary information to be classified and 90 (2·6 %) did not fit any of the WHO categories and could not be evaluated. Per the model, products in few categories automatically did not meet nutritional criteria, such as confectionery, juices, energy drinks and edible ices. Products in two categories, fresh/frozen meat, poultry and fish (n 50) and fresh/frozen fruit, vegetables and legumes (n 58), were considered to meet criteria. Processed and ultra-processed products were evaluated using different thresholds for each category (Table 4). Overall, only 1·8 % of ultra-processed and 9·8 % of processed food products met nutritional criteria according to the PAHO model (Table 3). Based on the WHO-European model, 8 % of ultra-processed products and 34 % of processed food met the critical nutrients content limits (Table 4).
Table 4 Proportion of ultra-processed and processed pre-packaged not meeting nutritional criteria according to WHO-Europe nutrient profiling system*

TF, total fat; SF, saturated fats; TS, total sugars; AS, added sugars; NSS, non-sugar sweeteners.
* WHO: Confectionery, energy bars, cakes and sweets, juices, energy drinks, and edible ices ‘do not meet nutritional criteria’. Fresh and frozen meat, poultry, fish, fruit, vegetables and legumes ‘meet nutritional criteria’. For the other categories, specific thresholds were used for each food group per 100 g. Breads: 2·5 g TF, 0 g AS, 0 g NSS. Other beverages: 0 g AS, 0 g NSS. Breakfast cereals: 10 g TF, 15 g TS and 1·6 g salt. Yoghurts, sour milk and others: 2·5 g TF, 2·0 g SF, 10 g TS, 0·2 g salt. Cheese: 20 g TF and 1·3 g salt. Ready-made and convenience foods: 10 g TF, 4 g SF, 10 g TS, 1 g salt and 941·4 kJ. Butter and oils: 20 g SF and 1·3 g salt. Bread, bread products and crisp breads: 10 g TF, 10 g TS, 1·2 g salt. Fresh or dried pasta, rice and grain: 10 g TF, 10 g TS, 1·2 g salt. Processed meat, poultry and fish: 20 g TF and 1·7 g salt. Processed fruit, vegetables and legumes: 5 g TF, 10 g TS, 0 g AS and 1 g salt. Sauces, dips and dressings: 10 g TF, 0 g AS and 1 g salt.(15).
† Food groups classification based on the WHO/European nutrient profile model(15).
‡ Processing degree: processed foods and ultra-processed food groups were classified according to the NOVA food classification system(Reference Monteiro, Cannon and Levy22,Reference Monteiro, Levy and Claro23) . Only processed/ultra-processed products with declaration of necessary critical nutrients were included.
Discussion
Our main finding was the substantial lack of nutritional information available in pre-packaged food products available in Guatemalan supermarkets, particularly on critical nutrients related to chronic diseases such as total sugars and added sugars. Among products that did have nutritional information, a high proportion were excessive in critical nutrients.
Guatemala and other Central American countries share a regulation concerning nutrition facts label (the Central American Technical Regulation, RTCA)(13). Despite the Codex Alimentarius Guidelines for Nutritional Labelling, manufacturers are not required to include nutrient declarations on labels of pre-packaged food products, except when labels also contain nutritional claims (any claim suggesting or implying that a product has special nutritional properties, describing the content of a specific nutrient, a nutrient´s physiological function or the relationship with health or disease reduction)(13,24) . The lack of universal mandatory nutritional labelling explains the high proportion of processed and ultra-processed products without nutritional information.
The manufacturers who include nutrition facts label in their products are required to declare energy content, total/saturated fats, carbohydrates and protein content(13). Despite the well-demonstrated association between obesity, NCD and mortality with high intake of sugars and fats, declaration is voluntary in Central America(Reference Yang, Zhang and Gregg25–Reference Te Morenga, Howatson and Jones27). According to our findings, nutrients like sugars and trans-fats, the declaration of which is not mandatory, appeared in a smaller proportion on labels compared with those that are mandatory. Other studies in countries with voluntary declaration of nutrients have also showed low declaration frequencies(Reference Tee, Tamin and Ilyas28,Reference Huang, Neal and Dunford29) . Moreover, Central American products had less information than imported ones, probably because foreign manufacturers also sell to countries with stronger regulations. This finding was similar to what has been described in India(Reference Dunford, Guggilla and Ratneswaran30).
We also found that processed and ultra-processed products containing excessive quantities of nutrients related to NCD and cancer dominate the pre-packaged food offer in Guatemala(Reference Fiolet, Srour and Sellem31,Reference Costa, Del-Ponte and Assunção32) . This was consistent with findings in other countries(Reference Monteiro, Moubarac and Cannon8,Reference Luiten, Steenhuis and Eyles33) , showing that this is a widespread phenomenon. For example, in Colombia, 80 % of products did not meet nutritional criteria of the PAHO model(Reference Mora-Plazas, Gómez and Miles34). This proportion was even higher in Canada, Mexico and Uruguay with 93, 97 and 100 %, respectively(Reference Giménez, Saldamando and Curutchet35–Reference Contreras-Manzano, Jáuregui and Velasco-Bernal37). In the EU and Canada, only 34 and 11·8 % of products met WHO criteria(Reference Elliott and Scime36,Reference Bonsmann, Robinson and Wollgast38) .
Insufficient nutrient information in packages has several consequences. For instance, the implementation of policies based on nutrient profiling (e.g. front-of-pack (FoP) food label systems, determining which products would be allowed to bear nutritional claim and limiting marketing to children) would be difficult with insufficient data. It is also concerning because labels are the most important source of nutritional information available to consumers(Reference Campos, Doxey and Hammond11). They have been shown to influence food choices and to promote healthier diets(Reference Campos, Doxey and Hammond11,Reference Cowburn and Stockley12) . However, use and understanding of labelling are low in developing countries(Reference Mandle, Tugendhaft and Michalow39).
Changes to the labelling system have been proposed to address this problem. Countries like Chile Ecuador have implemented FoP food label systems, which are easy to understand, with specific messages to alert consumers about levels of nutrient related to NCD. The FoP warning label system in Chile also serves as a regulatory instrument to restrict marketing to children and to regulate the type of food products permitted within public schools(Reference Pérez-Escamilla, Lutter and Rabadan-Diehl40,Reference Orozco, Ochoa and Muquinche41) . An evidence-based FoP food label system and similar strategy in Guatemala would require mandatory declarations.
To our knowledge, this is the first study to assess the completeness of nutrition declarations and to evaluate the quality of pre-packaged food products in Guatemala with global nutrient profiling systems. Strengths of the study include the use of international nutrient profiling systems, a systematic methodology to classify products and a large sample size of food products commonly offered in Guatemala.
Our study did feature several limitations. First, we only sampled products in supermarkets and not in other food retailers such as convenience stores. In 2011, close to one quarter of groceries in the country were purchased in supermarkets. Urbanisation increases this proportion(20). That said, most of the leading brands are sold in both supermarkets and convenience stores and nutrient composition is likely to be the same regardless of the outlet. We excluded unpackaged foods, including fresh fruits and vegetables, which tend to be healthier options. Therefore, our sample might not be representative of Guatemala’s complete food offer. However, most foods available in supermarkets are pre-packaged, and its consumption is increasing. The fact that we could not obtain permission to photograph products in Walmart is also a limitation of the study. However, it is likely the most consumed products were also available in the other surveyed supermarkets. In addition, the purchase of Walmart’s private-label brands minimised the number of products not evaluated. Another limitation is the fact that some of the products photographed in 2015 might no longer be on the market. However, we do not anticipate major changes in formulations to have happened in this period.
In conclusion, our study revealed that pre-packaged food products in Guatemalan supermarkets lack important nutritional information and have poor nutritional quality. There is an urgent need for regulation of critical nutrients declaration. Stronger regulations accompanied by compliance monitoring by strengthened governmental agencies have the potential to influence food choices. It is necessary to study the most effective way to deliver information to consumers, such as a FoP warning label system, to impact behaviour and allow informed selections that may lead to product reformulation and healthier food environments.
Acknowledgements
Acknowledgements: The authors are thankful for the financial support provided by the International Development Research Centre (IDRC). They also thank CIIPEC staff who collaborated with data collection and Dina Roche for assistance with data management. Financial support: This study was supported by a research training grant from the IDRC-CRDI (grant number #107213001). The IDRC had no role in the design, analysis or writing of this article. Conflict of interest: All authors declare that there is no conflict of interest regarding the publication of this article. S.V. is a Deputy Editor for Public Health Nutrition. Authorship: All authors participated in the study design; A.A.C. acquired, analysed and interpreted the data; A.A.C. drafted the manuscript; M.F.K.L. led the data analysis plan and manuscript writing. S.V., M.R.Z. and M.F.K.L. assisted in the analysis and interpretation of the results and provided critical intellectual feedback to help revise the manuscript. Ethics of human subject participation: This study did not include human subjects.


