


Diabetes mellitus (DM) is a multifactorial chronic disease that results in hyperglycaemia as a consequence of relative or absolute insulin deficiency. Hyperglycaemia can result in several complications, such as weight loss, sudden loss of vision due to cataracts, diabetic ketoacidosis, coma and death( Reference Fascetti and Delaney 1 – Reference Nelson 3 ). The main objective of treatment is to maintain blood glucose levels close to the reference range (about 100 mg/dl; 5·6 mmol/l)( Reference Chang, Hadox and Szladovits 4 , Reference Rucinsky, Cook and Haley 5 ) without risking hypoglycaemia( Reference Fascetti and Delaney 1 – Reference Nelson 3 , Reference Affenzeller, Thalhammer and Willmann 6 – Reference Nelson 8 ). Exogenous insulin administration is necessary to maintain glycaemic control in diabetic dogs ( Reference Rucinsky, Cook and Haley 5 , Reference Nelson 9 ). In addition to insulin therapy, it has been known for a long time that nutritional management plays an important role in glycaemic control in these patients( Reference Graham, Maskell and Nash 10 , Reference Nelson 11 ). The focus of nutrition for diabetic dogs is keeping the energy content, meal times and nutritional profile constant throughout foods that minimise postprandial blood sugar fluctuations( Reference Fascetti and Delaney 1 ). Fibres were studied as a nutritional factor that appear to be related to postprandial glycaemic responses in diabetic dogs( Reference Graham, Maskell and Nash 10 , Reference Blaxter, Cripps and Gruffydd-Jones 12 – Reference Nelson, Duesberg and Ford 16 ). For healthy and diabetic humans, starch is considered important for effectively controlling blood glucose levels( Reference Nansel, Lipsky and Liu 17 – Reference Zhang and Hamaker 22 ). Moreover, studies suggest that starch is actually the main factor influencing postprandial glycaemic curves in dogs( Reference Nguyen, Dumon and Biourge 23 , Reference Carciofi, Takakura and De-Oliveira 24 ).
It has been shown that starch digestibility is highly variable and is affected by several factors, such as sources, particle size, amylose:amylopectin ratioReference Musco, Calabrò and Tudisco (25) and gelatinisation process that may interfere with the postprandial glycaemic curves in healthy dogs( Reference Nguyen, Dumon and Biourge 23 – Reference Monti, Palumbo, Pinto and de 28 ). Nevertheless, studies on this same factor in diabetic dogs were not found.
Maize can be considered a fast-digesting starch sourceReference Carciofi, Takakura and De-Oliveira (24) , but maize-based diets that have undergone less processing (less grinding and less restrictive extruder parameters) have lower starch gelatinisation indices, which can result in higher levels of resistant starch, which seem to have beneficial effects on glycaemic parameters in healthy dogs( Reference Roberti-Filho, Palagiano and da Silva 26 ). Obese dogs receiving resistant starch presented beneficial effects on glycaemic parameters too( Reference Kimura 30 ), but their effects on diabetic dogs have not been demonstrated.
Teshima et al.( Reference Teshima, Brunetto and Gomes 31 ) showed that diabetic dogs receiving a slow-digesting starch source ration presented better glycaemic control compared with a fast-assimilating starch source ration when adequate number of meals are maintained. Some studies in humans( Reference Seewi, Gnauck and Stute 32 – Reference Dahl, Foster and Tyler 34 ) and with dogs( Reference Carciofi, Takakura and De-Oliveira 24 , Reference Sunvold and Bouchard 27 , Reference Adolphe, Drew and Huang 29 , Reference Adolphe, Drew and Silver 35 ) demonstrated the potential of peas and barley as slow-digesting starch sources that could minimise the postprandial effects on hyperglycaemia. However, no studies evaluating the use of these ingredients in the diets of diabetic dogs have been found.
Thus, this study aims to compare the effects of pea with barley and less-processed maize on glycaemic control in diabetic dogs.
Methods
This clinical study was conducted according to the ethical principles of animal experimentation and under the approval of the Ethics Committee on Animal Use of the School of Veterinary Medicine and Animal Science (University of São Paulo, Brazil), protocol no. 1691050214. Authors ensured that our manuscript conforms to the ‘ARRIVE Guidelines for Reporting Animal Research’ summarised at www.nc3rs.org.uk.
Animals
To determine the number of animals needed to conduct this study, the statistical program Action® was used, which resulted in a minimum sample size of ten dogs, to achieve 80 % of power calculation, performed by glycaemic values from Teshima et al.( Reference Kimura 31 ).
The animals used were selected from the routine practice of the veterinary hospital of the School of Veterinary Medicine and Animal Science of the University of São Paulo according to the following inclusion criteria: dogs diagnosed with DM, females (spayed) or males, over one year old, without other concomitant conditions, with a body condition score (BCS) between 4 and 6 on a scale of 1–9( Reference Laflamme 36 ), treated with neutral protamine Hagedorn (NPH) insulin, without any other drug administration and belonging to owners who were available and committed to following the experimental protocol. Animal selection was conducted based on anamnesis, physical examination, weighing, BCS determination and laboratory analysis (blood count, serum creatinine concentration, urea, total protein and albumin and urine culture) in the range of reference values. During the selection process, medical records of 368 animals diagnosed with DM were analysed. We excluded 350 dogs that did not meet the inclusion criteria: eighteen diabetic dogs that met the inclusion criteria were selected.
Of the eighteen animals included in the study, two were excluded because they were aggressive during blood glucose measurements at their home (continuous glucose monitoring system (CGMS) calibration), and one was excluded owing to personal difficulties of the owner in transporting the animal to the veterinary hospital. Thus, fifteen animals (Table 1) completed the study and only their data were used. Before the study, for these fifteen dogs the duration of DM ranged from 5 to 34 months. Immediately after DM diagnosis, dogs initiated treatment with NPH insulin injection about 0·25–1·0 unit/kg each 12 h). Before admission to the study, these insulin doses were adjusted according to clinical evaluation of each animal (Table 1).
Table 1 Characteristics of fifteen diabetic dogs at the beginning of the study
NPH, neutral protamine Hagedorn; BCS, body condition score; PB, diet based on peas and barley; Mi, less-processed diet based on maize; MB, mixed breed; IM, intact male; SF, spayed female; NM, neutered male.
Table 2 Diet characteristicsFootnote *: chemical composition and processing configuration of pea with barley (PB) and maize (Mi) diets used in this study
* Diet characteristics: both diets were composed of chicken by-product meal, wheat gluten, pork fat, swine isolate protein, cellulose, beet pulp, chicken fat, fish oil, hydrolysed chicken, propionic acid, antioxidant (BHA), potassium chloride, salt, yucca extract, fructo-oligosaccharides, dried brewer’s yeast, mannaoligosaccharides, yeast cell wall, transchelated trace minerals (Cu, Fe, iodine, Mn, Se, Zn), vitamins (folic acid, pantothenic acid, biotin, choline, niacin, pyridoxine, riboflavin, thiamine, vitamin A, vitamin B12, vitamin C, vitamin D3, vitamin E, vitamin K3) and taurine.
Diets
Two extruded dry diets, based on peas and barley (PB) or maize (Mi), were used in the study. Both included similar ingredients and chemical compositions (Table 2), except by the starch source: maize was the starch source for the Mi diet, whereas peas and barley flour were the starch sources for the PB diet (Premier Nutrição Clinica Diabetes Cães). In addition to the difference in the starch sources, the Mi diet was processed with less restrictive grinding and extruder dimensions compared with the PB diet (Table 2) to decrease the gelatinisation index of the starch in the Mi diet.
Analyses of DM, mineral matter, crude protein and ethereal extract from acid hydrolysis were performed according to standard Association of the Official Analytical chemists (1995) methods( 37 ); total dietary fibre was measured according to the method of Prosky et al.( Reference Prosky, Asp and Schweizer 38 ); total starch was measured according to Miller( Reference Miller 39 ) and Hendrix( Reference Hendrix 40 ); analysis of starch resistance was performed via the method described by Goñi et al.( Reference Goñi, García-Diz and Mañas 41 ); and starch gelatinisation indices were measured as described by Sá et al.( Reference Sá, Vasconcellos and Brunetto 42 ).
Experimental design
Initially, all animals were subjected to a DM-stabilisation period in which they received a hypoenergetic commercial diet (13·4 kJ/g in DM; Premier Nutrição Clinica Obesidade Cães) with a high fibre (19·6 % in DM), high protein (39·5%), moderate fat (9·0%) and moderate starch content (19·1%). Diets were prescribed on gram unit and were based on the estimated maintenance energy requirement (MER) according to the formula: MER=397 kJ×BW0·75 (BW=body weight)( 43 ). The owners were instructed to split the total daily amount of food into two meals for each day, by weighing it, with a 12-h interval between meals, and to administer insulin after each meal. All animals received NPH insulin to avoid other variables that might affect the glycaemic response, and their owners were forbidden to offer or to allow the animals access to other food.
The animals were evaluated every 15 d to determine adjustments in the amount of food or in the dose of insulin. Insulin dose adjustments were made when clinical signs of hypoglycaemia (apathy, somnolence, seizures) or hyperglycaemia (polyuria and polydipsia) were reported by owners, associated with measured blood glucose values before feeding and 6 h after insulin administration. All of the blood collections were performed by venepuncture of jugular, cephalic or safena vein. The amount of food was altered, with adjustments of ±10 %, if the animal presented weight variations of more than 5 % under the same insulin dosage.
The animals were considered stable (without manifestations of polyuria and polydipsia and with blood glucose levels ranging from 90 to 300 mg/dl (5·0–16·7 mmol/l))( Reference Rucinsky, Cook and Haley 5 ) after a period of three consecutive evaluations (45 d), with no change in the insulin dosage. Then, a blood glucose curve was performed, every 2 h for 10 h beginning immediately before the morning meal and insulin injection, measured with a portable device (AccuChek Active; Roche Diagnostics) validated for use in dogs( Reference Johnson, Fry and Flatland 44 ). Dogs that did not eat at the veterinary hospital had only their fasting glycaemia measured while the rest of the blood glucose curve points were measured upon return to the veterinary hospital at a subsequent day, after being fed at home. No dogs showed glucose values higher than 300 mg/dl (16·7 mmol/l) or lower than 90 mg/dl (5·0 mmol/l). After the DM-stabilisation period, the experimental periods began.
The animals underwent two experimental periods consisting of 60 d each, in which they received the test diets (PB and Mi), keeping the energetic amount (prescribed on gram unit) and insulin management from the end of DM-stabilisation period, in a crossover manner: all the animals received both diets, with the order based on a random drawing. The diets were delivered to owners in a double-blind manner by labelling the containers with the letters A or B by a researcher who did not supply the diets to the owners. The order in which the animals were treated was drawn from total of eight A-B and eight B-A papers. Rations were supplied in specific amounts to each owner upon each visit to the veterinary hospital. The amounts supplied were measured to cover only the days in between veterinary visits. After each experimental period (at the end of the consumption of each test diet), the animals returned to the veterinary hospital under 12-h fasting conditions for blood collection to measure serum fructosamine concentrations (determined by the kinetic method of fixed time with commercial kit (Fructosamine test; Labtest Diagnóstica S.A.)) and a conventional blood glucose curve (at hospital), every 2 h for 10 h beginning immediately before the morning meal and insulin injection.
In addition, a CGMS was implanted to establish the 48-h glycaemic curves. After the conventional blood glucose curve procedure, dogs were sent home with the CGMS system. The beginning of 48-h glycaemic curves was considered as the following day, 25 min before the morning meal and insulin injection, at home, keeping habitual management and schedules.
For three animals that did not eat during hospitalisation, the conventional blood glucose curve was not performed during experimental periods. After each experimental period, these three animals returned to the veterinary hospital (without fasting) and the CGMS was implanted. Their fasting serum fructosamine was measured after the 48-h glycaemic curve, at the day CGMS was removed.
After the end of the 48-h glycaemic curve, the animals were adapted to the next diet via a gradual exchange of food for 3 d, with a daily replacement of 25 % of the old diet with the new one; on the 4th day, the animal was receiving 100 % of the new test diet.
During the experimental periods (60 d each), the animals returned to the veterinary hospital every 20 d for clinical follow-ups about dietary and insulin management and clinical manifestations such as polyuria and polydipsia. Animals were weighed, and capillary glucose levels were measured before or 6 h after eating (alternating measurement time at each returning). The amount of food provided was increased or decreased if there was, respectively, weight loss or gain >5 % of body weight. The insulin dose used during the end of the stabilisation period was maintained throughout the two experimental periods for all dogs.
To verify that proper management was being carried out by the owner at home, owners were asked to bring in the usual amount of food per meal provided by them to the dogs upon each return to the veterinary hospital so that it could be weighed. We also asked owners to bring in one of the syringes they used and to show us the volume of insulin administered.
Glycaemic curves and parameters
The 48-h glycaemic curve was measured with a CGMS (Medtronic; iPro2) using a Sof-Sensor™ with the animal kept in its usual environment home for 48 h. After being collected, the data were downloaded to a computer compatible with the system. The positioning of the CGMS followed the methodology described by Wiedmeyer et al.( Reference Wiedmeyer, Johnson and Cohn 45 ) (Fig. 1).
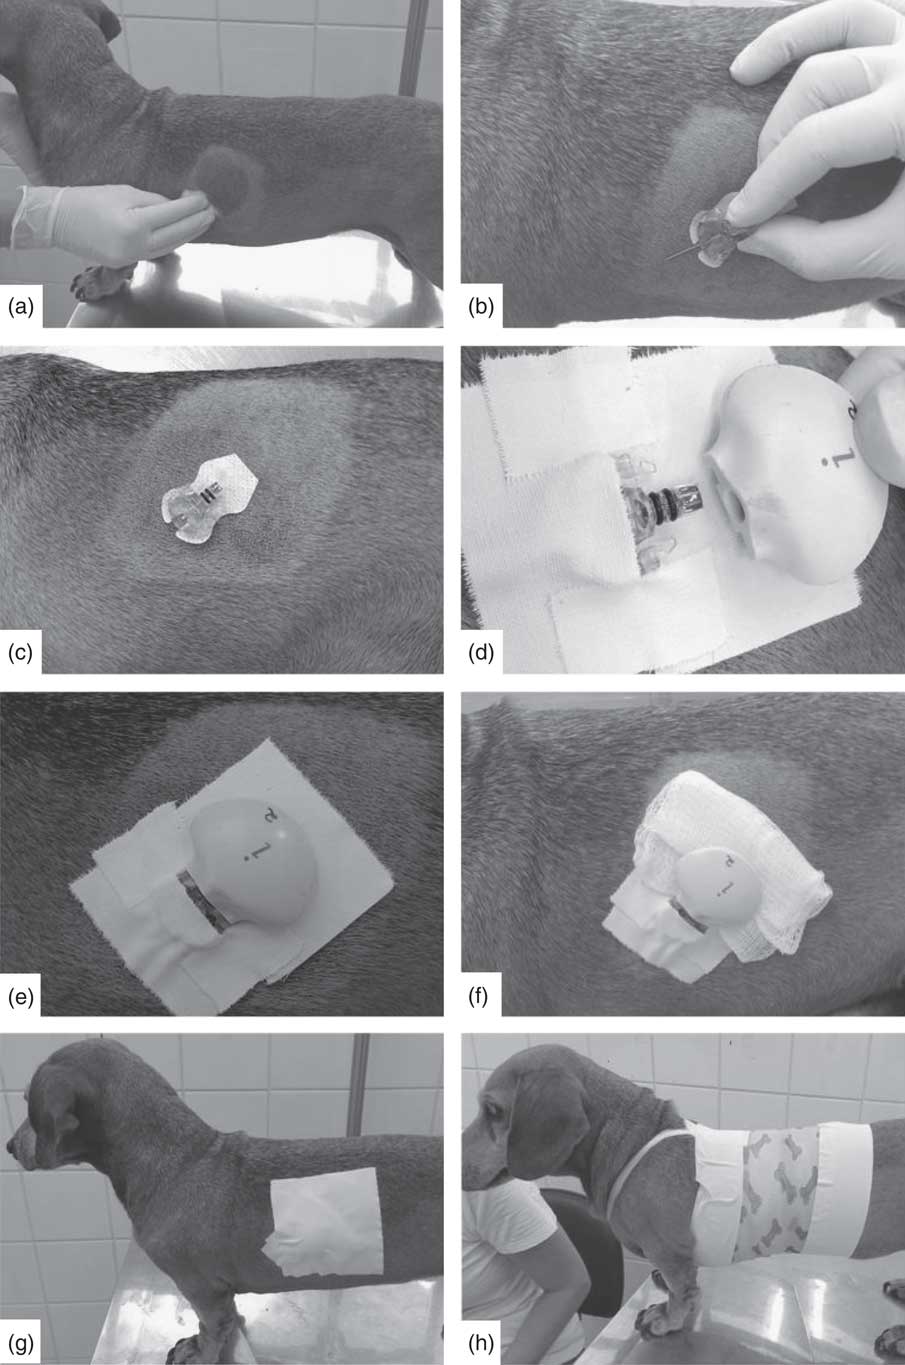
Fig. 1 Positioning steps of the Sof-Sensor™ and the iPro2 device in animals. (a) Cleaning the trichotomised region; (b) demonstration of sensor positioning on the animal’s skin; (c) sensor, without the guide needle, placed subcutaneously in the patient; (d) iPro2 recorder being coupled to the sensor fixed by tape; (e) signal showing proper positioning and recording of continuous glucose monitoring system (CGMS) activity; (f) gauze placed between the appliance and the animal’s skin; (g) fixation of the CGMS in the animal; and (h) fixation of the CGMS with bands and a bandage.
For CGMS calibration, two measurements of capillary blood glucose per d were performed with a portable (AccuChek Active) glucometer over a maximum interval of 12 h. The researchers would perform this measurement at the dog’s residence twice a day in cases where the owners did not feel confident in performing the measurements themselves. The same person (researcher or owner) was responsible for performing the capillary blood glucose measurements for each animal at each of the two 48-h glycaemic curve assessments.
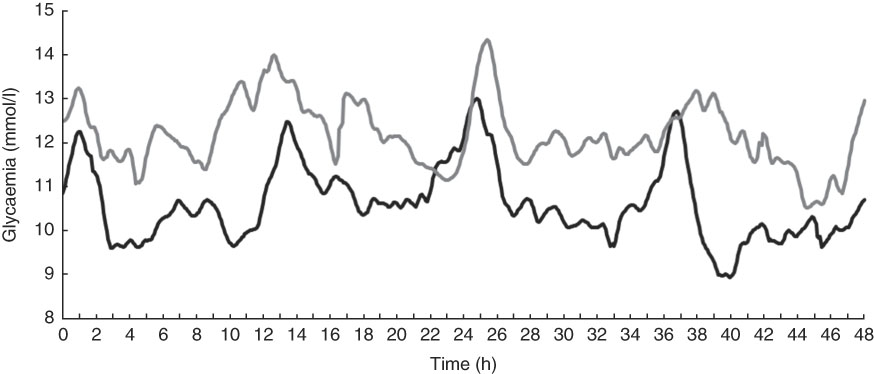
Fig. 2 Mean interstitial glucose concentrations of fifteen diabetic dogs 60 d after receiving food based on maize (Mi, ![]() ) or peas and barley (PB,
) or peas and barley (PB, ![]() ) measured by a continuous glucose monitoring system.
) measured by a continuous glucose monitoring system.
Throughout the study, two batches of glycaemic strips were used with the portable glucometers, seven Sof-Sensor™ batches were randomly distributed among the animals and each animal was implanted with the same iPro2 device paired with the same portable glucometer for each monitoring period.
During the 48-h glycaemic curve monitoring period, the owners wrote down the exact time the dog was fed and insulin administered. Thus, data were standardised such that the beginning of the 48-h glycaemic curve (t0) was the fifth interstitial glucose measurement before the first meal in the morning. Therefore, these glycaemic curves always began in the morning, before the first meal of the day, in all animals.
From the 48-h glycaemic interstitial curve, other glycaemic parameters were analysed. Fasting glycaemia was considered as the concentration of interstitial glucose at time t0 (25 min before the morning meal and insulin injection). Mean glycaemia was defined as the mean of the 48-h curve values. The maximum and minimum glycaemic values were defined as the highest and lowest values reached over the 48-h glycaemic curve. The mean difference between maximum and minimum glycaemic values was defined by subtracting the highest and lowest values of each curve. The glycaemic increment was calculated by subtracting the first glycaemic value (fasting) from the value at each point recorded for the animal. The area under the glycaemic curve (AUGC) and the area under the glycaemic increment in the first 24 h (AUGICd1) and last 24 h (AUGICd2) were calculated via numerical integration using the trapezoidal method using R Core Team software (2016) (R Core Team. R: A Language and Environment for Statistical Computing; R Foundation for Statistical Computing).
The definition of hypoglycaemia and hyperglycaemia used in this paper is not related to the reference values for healthy animals but to the values established in the DM-stabilisation period as representing adequate glycaemic control for diabetic dogs: 90–300 mg/dl (5·0–16·7 mmol/l)( Reference Rucinsky, Cook and Haley 5 ). Therefore, the time spent in hypoglycaemia (<90 mg/dl; 5·0 mmol/l) or hyperglycaemia (higher than 300 mg/dl; 16·7 mmol/l) for each animal was obtained from the glycaemic curves via continuous measurement. This calculation was made by counting the number of measurements in hypoglycaemia and hyperglycaemia and dividing each by the total number measurements for each animal for each diet.
For the conventional glycaemic curve, all other parameters were obtained in the same way as described above, except time in hypoglycaemia or hyperglycaemia, which was restricted to the 48-h glycaemic curve.
Statistical analysis
Statistical analyses were performed using the R Core Team software (2016). The α value established for significant results was 0·05 (P value <0·05). Initially, Shapiro–Wilk tests were used to verify whether the samples had a normal distribution; if so, an F-test was applied to verify the homogeneity of variances between the glycaemic and ingestion variables.
Wilcoxon signed-rank tests were applied to the variables minimum glycaemia from the 48-h continuous curve glycaemic, AUGICd1 and amount of ingested DM, energy and nutrients (starch, resistant starch, gelatinised starch, protein, fat and fibre) per day owing to the non-normal distribution of these data. Paired t tests were applied to serum fructosamine concentration, to all parameters from 10-h conventional glycaemic curve and to fasting glycaemia, mean glycaemia, difference between maximum and minimum glycaemia, AUGC and AUGICd2 from the 48-h glycaemic curve because these variables showed normal distributions and homogeneous variances. The only variable that had a normal distribution and a heterogeneous variance was maximum glycaemia from the 48-h glycaemic curve, and therefore its variance was estimated separately for both groups, and Welch’s modified t test was applied to determine the df.
The proportions of time spent in hypoglycaemia and in hyperglycaemia were compared using a χ 2 test.
Results and discussions
Continuous glucose monitoring system
CGMS was well tolerated by all animals. No owner complained of signs of nuisance or itching, but one animal removed the device twice, requiring a new implantation of the CGMS. In another animal, it was necessary to replace the sensor because of a delay in signalling by the recorder to show that the sensor was well positioned, and a second sensor was discarded owing to poor positioning, with part of the externalised sensor observed shortly after its placement in the patient. At these situations, another sensor was immediately positioned on animals and the 48-h continuous glycaemic curve had normally been performed.
Despite the absence of signs that the CGMS was removed during the glycaemic curve measurements considered in the study, there were moments where the iPro2 did not record glycaemic values. Among the curves measured in the experimental period with the PB diet, there were no records for the following animals and time points: no. 2 at minutes 1965 to 1975 (3 points); no. 3 at 775 to 845, 1335 to 1350, 2360 to 2460, 2540 to 2615 and 2720 to 2805 (74 points); no. 5 at 0 to 120 (25 points); no. 6 at minute 60 (1 point); no. 8 at 2840 to 2880 (9 points); no. 9 at 0 to 105 and 2820 to 2880 (35 points); and no. 13 at 2710 to 2720 (3 points). During the Mi diet period, data loss occurred in the following animals: no. 2 at 2365 to 2375 (3 points); no. 5 at 2030 to 2065 (8 points); no. 8 at 705 and 710, 995 to 1005 and 2500 to 2510 (8 points); and no. 11 at 5 to 30, 145 to 155 and 270 to 290 (14 points). To fill the gap of these missing measurements, we used the mean of the values adjacent to the unmeasured interval. For animals no. 5 and no. 9 during PB treatment, where the missing measurements were at the beginning of the glycaemic curve, t0 was considered as the closest previously measured value (as the animals were already being monitored a few hours before receiving the meal and insulin that day). An average value was calculated to fill the empty period from this set value of t0 and the next value at the end of the measurement gap. The fasting blood glucose level of the 1st day was replaced by that from the last day under continuous measurement to make the fasting blood glucose values of these two animals more reliable.
Body-weight variation and food intake
According to the established protocol, the amount of food supplied was enough to prevent changes in weight (P=0·19; Table 3).
Table 3 Body weight of fifteen diabetic dogs and dietary intake variables observed in the study(Mean values and standard deviations)
* Value obtained by the Wilcoxon test.
As shown in Table 3, and as expected because of the similarity in chemical composition of the diets (Table 2), the intake of DM, energy, protein, fat and fibre was not different between the treatments (PB and Mi, P>0·05). However, there was a higher intake of resistant starch (P<0·01) and total starch from the Mi diet (P<0·01), with the same intake of gelatinised starch (P=0·71).
Despite this difference in the intake of resistant starch and starch, it is important to note that the amount of food offered daily was controlled by each animal’s owners, which limits our ability to ensure that they actually received the prescribed amount each day. In addition, the difference in starch composition between the test diets was small (1·69 % of DM) and similar to that observed in the only other study comparing the effects of different sources of starch on blood glucose levels in diabetic dogs. In that study, the animals did not show a difference in starch intake( Reference Teshima, Brunetto and Gomes 31 ). In addition, it has already observed that a small difference in starch composition was not able to change postprandial glycaemic response( Reference Hewson-Hughes, Gilham and Upton 46 ).
Glycaemic parameters
From the glycaemic curves (Fig. 2), several variables were evaluated in each of the fifteen animals (Table 4). The means of these variables were calculated and compared between the two study periods. At the 48-h continuous glycaemic curve, there were significant differences in the following variables: maximum glycaemia (P=0·01), difference between minimum and maximum glycaemia (P=0·03), mean time in hypoglycaemia (P<0·01) and mean time in hyperglycaemia (P<0·01). For the conventional glycaemic curve, the differences were observed in the mean (P=0·02), minimum (P=0·03) and maximum glycaemia (P=0·02), and in AUGC (P=0·02). These results suggest that the PB diet resulted in lower blood glucose levels. This effect is reinforced by the fact that animals spent more time on average in hypoglycaemia (<90 mg/dl; 5·0 mmol/l) (24·0 %=691 min v. 4·2 %=121 min, P<0·01) and less time on average in hyperglycaemia (>300 mg/dl; 16·7 mmol/l) (10·9 %=314 min v. 12·9 %=372 min, P<0·01). The authors hypothesise that more time in hypoglycaemia can be interpreted as a possibility to minimise insulin administration dosage. The variables ‘time in hypoglycaemia’ and ‘time in hyperglycaemia’ could only be evaluated owing to the use of the CGMS and have been used in only one other continuous monitoring study of glycaemic control in diabetic dogs( Reference Affenzeller, Thalhammer and Willmann 6 ); however, this is the first study that used this methodology to evaluate the glycaemic fluctuations resulting from the management of DM with different diets.
Table 4 Glycaemic control variables of diabetic dogs evaluated in the study(Mean values and standard deviations; ranges)
PB, diet based on peas and barley; Mi, less-processed diet based on maize; AUGC, area under glycaemic curve; AUGICd1, area under glycaemic increment curve in the first 24 h; AUGICd2, area under glycaemic increment curve in the last 24 h.
* Variation is range for mean time in hypoglycaemia and hyperglycaemia. Variation is standard deviation for other variables.
† Δ, difference between maximum and minimum glycaemic values.
‡ P value obtained by paired t test, Wilcoxon or χ 2 test for comparisons between mean parameters from 48-h glycaemic curve from fifteen diabetic dogs.
§ P value obtained by paired t test for comparisons between mean parameters from 10-h glycaemic curve from twelve diabetic dogs.
In addition to the fact that the PB diet generated lower glycaemic values, the results showing a smaller difference between maximum and minimum glucose concentration suggest that the diet based on PB generated lower fluctuations over the continuous measurement period.
As starch appears to be the main nutrient influencing changes in postprandial glucose concentration, it is essential to discuss its role in the results obtained in this study. It is known that the influence of starch on control of glycaemia is owing to both the amount and type of starch consumed( Reference Nguyen, Dumon and Biourge 23 , Reference Carciofi, Takakura and De-Oliveira 24 , Reference Sunvold and Bouchard 27 – Reference Adolphe, Drew and Huang 29 , Reference Teshima, Brunetto and Gomes 31 , Reference Elliott, Rand and Fleeman 47 , Reference Nguyen, Dumon and Buttin 48 ). In this study, there was a difference between the treatments regarding the main starch source included in the diet: peas and barley v. maize.
Few studies have evaluated starch effects on glycaemic curves in dogs. Carciofi et al.( Reference Carciofi, Takakura and De-Oliveira 24 ) evaluated, through a glycaemic and insulinaemic curve, six diets with different sources of starch supplied to healthy dogs. Comparative data for peas and Mi showed the same mean glucose concentration for both curves, but peas resulted in a lower glycaemic peak, lower AUGC and lower area under the insulinaemic curve up to 30 min postprandially.
Sunvold & Bouchard( Reference Sunvold and Bouchard 27 ) compared the insulinaemic and glycaemic response of healthy dogs after receiving five diets with different starch sources for at least 2 weeks. Mi resulted in the second lowest mean glycaemic value (behind only sorghum). However, the mean insulin concentration and the area under the insulinaemic curve were lower when the animals received the barley-based diet, whereas the values associated with Mi were intermediate.
In a more recent study, the glycaemic and insulinaemic postprandial responses of six healthy adult dogs fed the ingredients barley, peas, rice and Mi were compared with those of dogs fed a 20 % glucose solution. The authors observed that peas resulted in a lower glycaemic index than barley and rice, and Mi resulted in an intermediate index, as occurred with the AUGC obtained in that study( Reference Adolphe, Drew and Huang 29 ). The same research group evaluated the postprandial glycaemic and insulinaemic responses after the supply of extruded food with rice or peas as the main source of starch. The authors found a trend towards a smaller AUGC with the pea-based diet( Reference Adolphe, Drew and Silver 35 ). In this study( Reference Adolphe, Drew and Silver 35 ), the animals were induced to become overweight via voluntary feeding with extruded maintenance dry food for adult dogs. After weight gain, animals again received two extruded dry foods, pea-based or rice-based, for 12 weeks. There were smaller areas under the insulin curves and lower serum insulin concentrations when the dogs were evaluated in oral glucose tolerance tests after receiving a pea-based diet than in tests following feeding on a rice-based diet. This demonstrates that animals fed peas as the main source of starch may have a lower insulin response because of a possible improvement in insulin sensitivity, which means that they need lower concentrations of this hormone to maintain blood glucose levels. In our experimental design, we chose to maintain the same insulin dose throughout the study, in order to evaluate the true effects of food on glycaemic control.
The studies cited show that peas can be considered a source of slow-digesting starch for dogs, which, like barley, seems to result in a greater sensitivity to insulin. In other species, studies have shown lower glycaemic and insulinaemic values after ingestion of pea products (starch and pea flour)( Reference Seewi, Gnauck and Stute 32 , Reference Marinangeli, Kassis and Jones 33 ), which may be explained by the grain composition, consisting of a high amylose:amylopectin ratio( Reference Dahl, Foster and Tyler 34 ) and the phenolic and prebiotic compounds in barley that would help to minimise metabolic changes( Reference Brockman, Chen and Gallaher 49 , Reference Gangopadhyay, Rai and Brunton 50 ).
The only previous study that evaluated sources of slow-digesting starch for diabetic dogs reached results similar to those of the present study (lower minimum and average glucose concentration), but the comparison was performed with sorghum and lentils v. rice( Reference Teshima, Brunetto and Gomes 31 ). Thus, this is the first study that demonstrated improvements in some glycaemic variables in diabetic dogs after the institution of a diet based on PB.
In some studies, Mi is included as an amylaceous ingredient with fast to intermediate glucose assimilation rates( Reference Carciofi, Takakura and De-Oliveira 24 , Reference Sunvold and Bouchard 27 , Reference Adolphe, Drew and Huang 29 ). During the extrusion process of the Mi diet, the ingredients were subjected to less grinding by a hammer mill with a larger screen size and an extruder with a greater die flow output area (Table 2), which generated a lower starch gelatinisation index and a more resistant starch. The only other study that proposed a similar test found, in healthy dogs, lower glycaemic and insulinaemic values associated with the consumption of maize-based diets associated with grinding and extruding of Mi using less restrictive parameters( Reference Roberti-Filho, Palagiano and da Silva 26 ).
The effects of glycaemic modulation due to the ingestion of resistant starch itself were tested by Kimura( Reference Kimura 30 ) in obese dogs receiving commercial solutions of purified resistant starch, which resulted in lower glycaemic values compared with the results with soluble starches.
In this study, the increase of blood glucose levels was suggested by a higher maximum glycaemia, lower mean time in hypoglycaemia, longer average time in hyperglycaemia and greater difference between maximum and minimum glycaemia at continuous glycaemic curve, and AUGC, mean, minimum and maximum glycaemia at conventional glycaemic curve, when the animals received Mi as a source of starch, even though it was processed less restrictively. The authors hypothesise that the results found by Roberti-Filho et al.( Reference Roberti-Filho, Palagiano and da Silva 26 ) in healthy dogs were not observed in this study with diabetic dogs because of the greater difference in sieve screen size during milling from 2·0 to 0·5 mm in the study by Roberti-Filho et al.( Reference Roberti-Filho, Palagiano and da Silva 26 ), which generated a larger range in values for the geometric diameter of the raw material after grinding (169–290 mm) and consequently a greater variation in starch gelatinisation (69–86 %). Another point is that, in this study, there was greater total starch intake during the period when the dogs were fed the Mi diet that could explain the absence of glycaemic minimisation at this period, although there was no difference in gelatinised starch, which is the component that will influence postprandial glycaemic response the most. In addition to these differences, Roberti-Filho et al.( Reference Roberti-Filho, Palagiano and da Silva 26 ) worked with healthy dogs, which have different metabolic responses than diabetics dogs; because of this, less-processed starch may not result in the same glycaemia values.
Particularities and limitations
One of the main differences in this research relative to previous studies is the fact that the glycaemic measurements were performed for 48 h using a CGMS that records the interstitial glucose concentration every 5 min. We also performed a 10-h conventional glycaemic curve, and the results were similar to the 48-h continuous curve. The other published studies that have evaluated the effects of different diets on glycaemic control in diabetic dogs( Reference Graham, Maskell and Nash 10 , Reference Blaxter, Cripps and Gruffydd-Jones 12 – Reference Nelson, Duesberg and Ford 16 , Reference Teshima, Brunetto and Gomes 31 ) evaluated glycaemic fluctuation over 24 h at the longest, with measurements made every 2 h. Moreover, as seen in previous research( Reference Affenzeller, Thalhammer and Willmann 6 , Reference Claus, Gimenes and Schwartz 51 ), fructosamine was not effective in demonstrating differences between methods of glycaemic control in diabetic dogs (P=0·83). However, because this is a pioneering study in using CGMS technology for the purpose of nutritional evaluation, there is a lack of information to compare with our results.
One limitation of the observed measurement method was that the iPro2 only recorded glycaemic values in the range of 40–400 mg/dl (2·2–22·2 mmol/l). In addition, the CGMS failed at times to measure glucose concentration in some patients, which resulted in gaps in our data.
In addition to the method of measurement, this study is unique in its attempt to pinpoint the effect of food on controlling glycaemia in diabetic dogs as it kept the amount of insulin administered constant. Although this allowed a better evaluation of the effect of the diet on glycaemia, the experimental design is not capable of evaluating whether the diet would allow for a decreased insulin dosage.
Another limitation of this study related to insulin was the impossibility of using intermediate doses of the drug as NPH-type insulin was used, and some animals, because of their size, such as animal no. 4, presented a challenge in correcting dosage a they would easily present signs of hypoglycaemia with increments in the insulin dosage.
NPH insulin was chosen because it was the drug already being administered in the treatment of the dogs before their inclusion in this study, and it also has the advantage of being more affordable than other types, which is an important factor as the insulin was paid for by the owners.
Although fifteen animals represent a small sample size, based on previous research, this study included the highest number of diabetic dogs evaluated for dietary glycaemic control under a cross-over design. In relation to the diet used, Mi presented less starch gelatinisation, but the search for more pronounced effects could be approached by using even less restrictive parameters during the grinding and extrusion process, by using slow-digesting starch sources submitted to these less-restrictive processes, or by determining with greater certainty that the amount of starch ingested between the two diets really was the same. All of these are interesting points should be addressed in new studies to improve the nutritional treatment of diabetic dogs, as it has the potential to represent lower insulin dosages and, consequently, lower costs to owners, increasing the accessibility of DM treatments.
Conclusion
According to the results obtained from this group of fifteen animals under the experimental design used here, diabetic dogs receiving a diet with peas and barley as the starch source resulted in lesser variation of interstitial and plasma glucose concentration than the period receiving a maize-based diet. Therefore, processing applied to a maize-based diet was not enough to result in the same effects of a peas- and barley-based diet on glycaemic control in diabetic dogs.
Acknowledgements
The authors thank the staff of the School of Veterinary Medicine and Animal Science for all their support. The authors also thank Alinne Santana-Pereira for help with the English translation and text revision.
This work was supported by São Paulo Research Foundation (FAPESP) (2014/02749-1) and Grandfood Industria e Comercio LTDA (Premier pet) for funding this study and producing and supplying the diets. FAPESP had no role in the design, analysis or writing of this article. Premier pet had no role in the design, analysis or writing of this article.
F. A. T. was responsible for planning the study, selecting and treating animals, conducting the analysis and writing and editing the manuscript. D. P. M. was responsible for conducting the analysis, selecting and treating animals, compiling the data and reviewing the manuscript. J. T. J. was responsible for planning the study and manufacturing the diets. M. R. Q. was responsible for data analysis. M. A. B. and C. F. F. P. were responsible for planning the study and composing and reviewing the manuscript.
The authors declare that there are no conflicts of interest.


