


The assessment of body composition in childhood is relevant, as growth encompasses changes in several components of the body: total body water (TBW), fat mass (FM) and osseous mineral content which reflects weight change, also depending on sex, age, ethnic characteristics, food intake and physical activity(Reference Wells and Fewtrell1). The rapid obesity increase in childhood since early age reinforces the need to have a simple and valid methodology for the evaluation of prevention efforts or clinical interventions(Reference Ogden, Carroll and Kit2). In Chile, national data collected at public schools show an increment in obesity in first-grade children from 14 % in 1996 to 24 % in 2016(3).
Most of these methods are limited to research because of their complexity and cost(Reference Siervo and Jebb4–Reference Velazquez, Salazar and Vio6). The four-component (4C) and three-component (3C) models of body composition constitute reference methods(Reference Wells, Fuller and Dewitt7). Both models make it possible to verify the degree of agreement for FM or fat-free mass (FFM), measured by simpler methods, such as anthropometry equations and bioelectrical impedance analysis (BIA). The advantage of the three-compartment model is to minimise assessment error; thus, they increase the validity of FM or FFM equations, when using simpler methods(Reference Fuller, Jebb and Laskey8).
Skinfold thickness and BIA are techniques frequently used by health professionals to measure FM and FFM(Reference Slaughter, Lohman and Boileau9,Reference Huang, Watkins and Goran10) . Expert panels have recommended the measurement of triceps and subscapular skinfold thickness, as a routine assessment of children and adolescents, whose conversion to FM will depend on sex, age, race and BMI(Reference Haroun, Taylor and Viner11). BIA is easy to measure and relatively cheap(Reference Brown and Perrin12–Reference Moon14) and requires less technical skill than skinfold assessment, which makes it useful where training opportunities may be limited. The main limitation of BIA studies is that each equipment utilises empirical equations provided by the manufacturer(Reference Montagnese, Williams and Haroun15), to convert the resistance measurement into TBW or FFM. The Tanita BIA segmental body composition analyser (BC-418MA) has been validated for FFM in some studies in Caucasian children(Reference Barreira, Staiano and Katzmarzyk16), compared with the reference method, although in other ethnic populations, it has underestimated FFM(Reference Ramirez, Valencia and Bourges17) or overestimated it(Reference Sluyter, Schaaf and Scragg18). These differences could be explained by the prediction equation of the equipment, predominantly developed in Caucasian population, or having different maturation status, physical activity level or extreme values(Reference Haroun, Taylor and Viner11,Reference Brown and Perrin12) . Recently, authors have developed specific equations for FM, using BIA in Mexican children(Reference Ramirez, Valencia and Bourges17) and also in a multiethnic group of young children(Reference Sluyter, Schaaf and Scragg18).
In a recent work, Aguirre et al. (Reference Aguirre, Salazar and Lopez de Romaña19) used a three-compartment model to determine FM% in 424 7–9-year-old Chilean schoolchildren, in order to assess the validity of published anthropometrical equations(Reference Slaughter, Lohman and Boileau9,Reference Huang, Watkins and Goran10) and BIA equations using the Tanita BC-418M(Reference Sluyter, Schaaf and Scragg18). High biases and large confidence limits were found, demonstrating that those equations were inaccurate in pre-pubertal Chilean children.
The importance of assessing body composition at pre-pubertal age is due to the adiposity rebound during this period(Reference Ayyavoo, Derraik and Hoffman20,Reference González, Corvalán and Pereira21) .
The main objectives of the present study are the development and validation of new equations for anthropometry and bioelectrical impedance, compared with the 3C model as the reference method, in order to have simpler methods to assess body composition in 7–9-year-old children.
Experimental methods
The study group was drawn from children participating in the Chilean Growth and Obesity Cohort Study, which started in 2006 in children between 3 and 4 years old, attending nursery schools of the National Nursery Schools Council Program (JUNJI), in the southeastern area of Santiago, Chile. All children were born in 2002, with birth weights between 2500 and 4500 g, having no physical or psychological conditions that could severely affect their growth or body composition(Reference Corvalan, Uauy and Stein22,Reference Kain, Corvalan and Lera23) . The sample for the present study was obtained from verifying the interaction of maturation and body composition plus assuming a power of 0·8 and a two-tail α = 0·05; this sample size makes it possible to detect small effect sizes (d 0·23, r 0·1, f 0·01).
The final sample for body composition studies consisted of 515 children participating in the Chilean Growth and Obesity Cohort study in the years 2010 and 2011. After excluding children with puberty stage 2 (n 55), twenty underweight and sixteen lacking completed data, the final sample size was 424 children (198 girls and 226 boys). The present study was conducted according to the guidelines laid down in the Declaration of Helsinki, and all procedures involving human subjects were approved by the Ethical Committee of the Institute of Nutrition and Food Technology (Act no. 19, 2009). A signed informed consent was obtained from the children’s parents or guardians.
Anthropometry and body composition were measured in children participating in the Chilean Growth and Obesity Cohort study in the years 2010 and 2011. A standardisation procedure was performed by the two registered dietitians for weight, height and skinfold thicknesses. Weight was measured with a portable electronic scale (Seca 770) with a precision of 0·1 kg.
Height was measured with a portable stadiometer (Harpenden 603; Holtain Ltd) to the nearest 0·1 cm. BMI was determined as weight/height2 (kg/m2)(Reference de Onis and Habicht24).
BMI z-score (BMIZ) was calculated using the WHO 2007 growth reference in 5–19 years(25). Skinfold thickness (triceps and biceps) was measured in triplicate on the right side, with a Lange calliper to the nearest 0·5 mm and the mean value was used. The intra-observer technical measurement and the mean average bias of the observer were within the limits suggested by the WHO in the Growth Reference Study(26). Technical error of measurement in trained and standardised nutritionists was 4 % in skinfolds and 1 % in other measurements.
Body volume was measured by an air displacement plethysmography (BOP POD; Life Measurement Instruments), using standardised procedures. Children had to refrain previously from physical activity to avoid loss of water, and food ingestion was allowed 2 h before the measurement. The BOD POD equipment was calibrated daily, and measurements were conducted according to the manufacturer’s guidelines. Children were assessed in tight-fitting bathing suits, to avoid air trapped in clothes, and hair was covered with swimming caps. Quality of data was assured by considering volume readings not differing >150 ml, and the measurement was repeated again, until compliance. The two closest values were averaged, according to the agreement criteria. Thoracic gas volume was predicted by the software, using a validated child-specific equation(Reference Fields, Hull and Cheline27). The range of error for this test is 1–2.7 %, and precision was 0·56–1·34 %(Reference Collins, Saunders and McCarthy28). The reproducibility of BOD POD is 1 % in measurements of children this age.
TBW was measured by the 2H dilution method, using a dose equivalent to 0·4 g D2O/kg body weight (98·9 atom % excess; Europa Scientific). Pre-dose 2H abundance was obtained from 3 ml saliva sample, and the post-dose sample was collected 3–4 h after dosing, using absorbent saliva-collection material (cotton swabs). Samples were stored at −20° for later triplicate analysis, using the equilibration method in a HYDRA isotope ratio–MS (Europe Scientific). The D2O method for measurement of TBW was 1.2 % and precision 2–3 %(Reference Kuriyan29).
BIA was measured using Tanita BC-418MA, an eight-electrode hand-to-foot system, manufactured by Tanita Corporation, which in standard conditions has 2–4 % error(Reference Talma, Chinapaw and Bakker30). BIA measurements were made according to the manufacturer’s guidelines at 50 kHz frequency. Height, sex and age were entered manually, while weight was recorded automatically. The parents were asked to limit their child’s physical exertion during the day before measurements were taken at the laboratory at the Institute of Nutrition and Food Technology.
Two BIA recordings were obtained, one with elbows flexed at 90° and one with elbows extended at 180° (hereafter 90° or 180° arm positions), with the child standing in the anatomical position(Reference Devakumar, Grijalva-Eternod and Roberts31). The measurement is influenced by age, sex, hydration status and bone maturation(Reference Lopez-Sanchez, Sgroi and D’Ottavio32). The FFM considers the hydration coefficients, by sex and age.
All body composition methods were measured at a similar time in the morning, after children had emptied their bladders upon arrival. Children came to the laboratory, with only 100 ml of milk consumed at 07.00 hours, to avoid loss of normal hydration. The order of measurement was first collecting the D2O background sample and dosing, then the BOD POD and finally BIA measurements. During the 2H equilibration period (3 h), anthropometry data were collected. A light breakfast (maximum 837 kJ) was provided after the BodPod measurement, 1 h after D2O dosing and additional water intake was discounted from TBW and BIA assessment.
Age, sex, body height and especially body fat had a significant effect on the functional muscle:bone ratio. There was no sex difference in the bone mineral content:muscle ratio until pubertal stage 3(Reference Locquet, Beaudart and Durieux33,Reference Duran, Martakis and Hamacher34) .
Body composition calculations
The 3C model was selected as the reference method(Reference Velazquez, Salazar and Vio6). This model divides the body into fat, water and the remaining fat-free dry mass, which is assumed to have a constant ratio of protein:mineral of 0·35(Reference Collins, Saunders and McCarthy28). The 3C model takes into consideration the inter-individual variation in FFM hydration. If the various assumed densities are considered plus the constant ratio of protein:mineral, then FM may be calculated as follows(Reference Fuller, Jebb and Laskey8):
 $${\rm{FM}}{\mkern 1mu} \left( {{\rm{kg}}} \right)\; = \;\left( {\left( {2\cdot220 \times {\rm{BV}}} \right) - \left( {0\cdot764 \times {\rm{TBW}}} \right)} \right) - \left( {1\cdot465 \times {\rm{BW}}} \right),$$
where BV is the body volume (litres), TBW is the total body water (litres) and BW is the body weight (kg).
The 3C model value for FM was compared with the FM (%) equation from anthropometry.
Statistical analyses
-
(1) Descriptive statistics was used for analysing basic anthropometric characteristics; differences by sex were assessed using Student’s t test (normal distribution) and the Mann–Whitney U test (for non-normal distributed variables).
-
(2) The generation of new equations for FM and FFM was done by randomly splitting the total sample into 67 % (n 284) and 33 % (n 140), to generate a sampling for prediction and validation. For the FM (%) equation, the following variables were entered in the analysis, sex, BMIZ, subscapular, triceps, abdominal and bicipital skinfolds. They were selected as to having a significant association (P < 0·05) to FM (%). Variables that remained are part of the equation for body fat (%). For the FFM equation, variables that entered in the stepwise model were sex, age, height, resistance and impedance variables.
-
(3) Variables selected to generate the FM (%) were BMIZ, triceps and biceps skinfolds, which represent habitual measurement of adiposity. In the case of the FFM (kg) equation using TANITA BC-418 MA, the selected variables were age (years), sex (female = 1 and 2 = male), weight (kg) and BIA resistance (ohms).
-
(4) The two-sample t test showed no significant differences between the two sets (Pr (T > t) = 0·76) with respect to the selected variables chosen for the design of FM (%) and FFM (kg) equations. The distribution of residual data from the equations in both samples for FM (%) and FFM (kg) was assessed by the Shapiro–Wilk test(Reference Kuriyan29), which indicated a normal distribution (P > 0·9).
-
(5) In both equations, the variance of errors (homoscedasticity) was evaluated by the Kernel density test, indicating both samples were normally distributed (P > 0·6). Using the Durbin’s alternative test (P > 0·05), no collinearity and similar variances were obtained(Reference Kleinbaum, Kupper and Muller35).
-
(6) The equations were similar in the two groups (cross-validation performance); thus, a single equation was regressed for FM (%) and FFM (kg) in the whole group. The error of measurement was 1–2% for 2H dilution and 3–4 % for air displacement plethysmography.
-
(7) A Bland–Altman(Reference Bland and Altman36) test was applied in the whole sample for both FM (%) and FFM (kg) equations to verify the difference between the 3C model and the generated equations. The Bland–Altman analysis calculated the mean difference between the reference (3C model) and each equation. The CI represented the 95 % distribution, in FM (%) or FFM (kg).
-
(8) The level of significance used was P < 0·05. All statistics were computed using SAS (version 8.2 for Windows: SAS), with an α value of 0·05.
Results
The anthropometric characteristics of the sample are shown in Table 1. Boys had higher age, but there were no differences in average weight and height, with girls. FFM (kg) and FM% differed significantly between sexes, with girls having a higher FM% and lower FFM (P < 0·001), in spite of the age difference. Furthermore, 50 % of the sample had excess weight (BMIZ > 1), which agrees with the rapid increase in the obesity prevalence during the last 10 years in Chile.
Table 1. Anthropometric characteristics and body composition of the sample (197 girls and 224 boys)
(Medians and ranges)

* P < 0·001 (t test).
In Table 2, TBW (litres) and BOD POD volume (litres) are also shown, values which are significantly different by sex, as expected.
Table 2. Body compartmental values for girls and boys
(Medians and ranges)
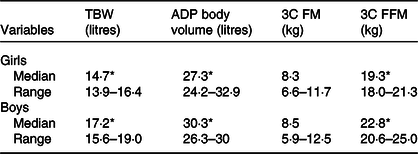
TBW, total body water; ADP, air displacement plethysmography; 3C FM, three component model fat mass; 3C FFM, three component model fat-free mass.
* All of the variables, except 3C FM, were significantly different by sex (P < 0·001).
The equation was derived into 2/3 of the population (n 254) out of the total of 424 children. In the other third, a cross-validation was conducted, with results showing that similar variables explained FM%.
 $$\displaylines{
{\rm{FM}}{\mkern 1mu} \left( \% \right)\; = \;\left( {1\cdot743 \times {\rm{BMIZ}}} \right) + \left( {0\cdot727 \times {\rm{triceps}}\,{\rm{skinfold}}} \right) \cr
+ {\mkern 1mu} \left( {0\cdot385 \times {\rm{biceps}}{\mkern 1mu} \,{\rm{skinfold}}} \right)\; + \;15\cdot985\;({R^2}0\cdot79) \cr} $$
$$\displaylines{
{\rm{FM}}{\mkern 1mu} \left( \% \right)\; = \;\left( {1\cdot743 \times {\rm{BMIZ}}} \right) + \left( {0\cdot727 \times {\rm{triceps}}\,{\rm{skinfold}}} \right) \cr
+ {\mkern 1mu} \left( {0\cdot385 \times {\rm{biceps}}{\mkern 1mu} \,{\rm{skinfold}}} \right)\; + \;15\cdot985\;({R^2}0\cdot79) \cr} $$
For the case of FM (%) equation, the R 2 in the cross-validation simple (0·77) had a difference <0·1 when compared with the R 2 in the whole sample (0·78), which, according to Kleinbaum et al. (Reference Kuriyan29), indicated that the final model was reliable.
The three-compartment data by sex on FM% and FFM (kg) are shown in Table 2.
In Fig. 1, the Bland–Altman plot shows a mean difference of 0. 27 (sd 3. 5) % for fat percentage in the whole group. The limits of agreement for the body fat (%) are C1 = 6·82 and C2 = −6·75. The FM (%) obtained with the new anthropometric equation differs against the 3C model, 1·0 (sd 3·2) % for boys and −1·8 (sd 3·4) % for girls (P < 0·05).

Fig. 1. Body fat % (BF%) anthropometrical equation agreement to three component model (3C model) data. 2 sd = 6·82 and −2 sd = −6·75.
Dependent variables, such as the resistance, age, sex and weight, were regressed producing the following equation for Log FFM (kg), explaining 92 % of FFM variability:
 $$\displaylines{
{\rm{LogFFM}}{\mkern 1mu} \left( {{\rm{kg}}} \right)\; = \;\left( {0\cdot018 \times {\rm{age}}} \right) + \left( {0\cdot047 \times {\rm{sex}}} \right) + \left( {0\cdot006 \times {\rm{weight}}} \right) \cr
+ \;\left( {0\cdot027 \times {\rm{resistance}}} \right) + 2\cdot071\;({R^2}0\cdot93) \cr} $$
$$\displaylines{
{\rm{LogFFM}}{\mkern 1mu} \left( {{\rm{kg}}} \right)\; = \;\left( {0\cdot018 \times {\rm{age}}} \right) + \left( {0\cdot047 \times {\rm{sex}}} \right) + \left( {0\cdot006 \times {\rm{weight}}} \right) \cr
+ \;\left( {0\cdot027 \times {\rm{resistance}}} \right) + 2\cdot071\;({R^2}0\cdot93) \cr} $$
Girls = 1; boys = 2.
In the regression for FFM (kg), R 2 was 0·93 and in the validation sample, R 2 was 0·92, which was also <0·1; thus, according to Kleinbaum et al.(Reference Kuriyan29), the final model was reliable.
In Fig. 2, the Bland–Altman analysis for the comparison of 3C model FFM (kg) and BIA FFM is shown. The limits of agreement for FFM are C1 = 1·79 and C2 = −1·87. These equations are valid for group measurement due to the high limits of agreement. The equation leads to a 0·004 (sd 0·92) kg of FFM difference. When the differences to the 3C model are considered by sex, these differences were −0·02 (sd 1·0) and 0·02 (sd 0·8) kg in boys and girls, respectively, indicating that the equation has no bias by sex. These values are shown in Table 3.

Fig. 2. Fat-free mass (FFM) (kg) bioimpedance equation agreement to three component model (3C model) data. BIA, bioelectrical impedance analysis. 2 sd = 1·79 and −2 sd = −1·87.
Table 3. Comparison of the three component model body fat (%) and fat-free mass (FFM) (kg) with the anthropometrical (ANTHRO) and bioelectrical impedance analysis (BIA) generated equations values by sex
(Mean values and standard deviations)
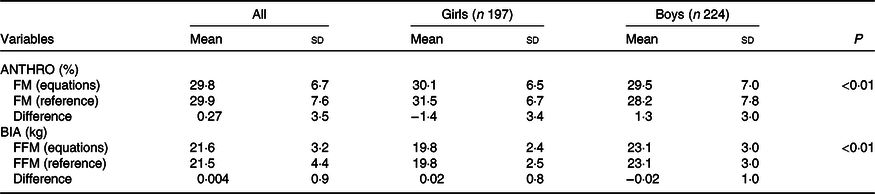
FM, fat mass; FFM, fat-free mass
Discussion
The present study is one of the few estimating body compositions in children of Hispanic origin (7–9 years old). We proposed new equations for FM, based on anthropometry and FFM using bioimpedance.
Our results for the FFM equation are similar to those found in Jemaa et al. (Reference Jemaa, Mankaï Sarra and Minaoui Dhekra37), where they measure 8–11-year-old children. In spite of age difference, BIA provided a valid equation for FFM. The results of the study done in Mexican children, for body fat and FFM, differed substantially from ours, due to a high obesity prevalence which was not similar to the present study.
Results provided by the BIA equipment are also prone to error in children, as the Tanita BC 418 MA may utilise an adult hydration factor, which is lower than those seen in children(Reference Kuriyan29). Considering these factors, we have generated new anthropometrical and BIA equations for FM (%) and FFM (kg), taking into account these factors (Hispanic origin, sexual maturation, hydration factors and having an excess weight similar to our national data).
In Chilean children, mainly of Hispanic origin, the Slaughter equation clearly underestimated FM (%) by over 12 %. This huge difference may be explained by the fact that it was developed in 1988 in Caucasian children(Reference Ogden, Carroll and Lawman38). Thus, the Slaughter’s anthropometric equation should not be used for Chilean children or of Hispanic origin. Additionally, the sex distribution in the Slaughter’ equation is not similar to ours, which may affect the estimation of FM in girls. Other anthropometrical equations developed for Mexican children(Reference Ramirez, Valencia and Bourges17) failed to provide good results in 7–9-year-old Chilean children, due to differences in obesity prevalence, sample composition or methodological issues. Anthropometrical equations validated for Latino children(Reference Huang, Watkins and Goran10) have overestimated or underestimated FM in other populations(Reference Bellizari, Roche, Heymsfield, Lohman, Wang and Going39). The new proposed equations for FM (%) in 7–9-year-old Chilean children utilise BMIZ and skinfolds and may be used in the group of children, due to its standard deviation (3·5 %) of the difference in the Bland–Altman analysis(Reference Freedman, Ogden and Blanck40). These equations are valid for group measurement due to the high limits of agreement. For FFM in both boys and girls, the Huang equation showed the best agreement for boys (r 0·73) and the Ellis equation had the best agreement for girls (r 0·92) compared with the 3C BIA FFM equation(Reference Huang, Watkins and Goran41,Reference Ellis42) .
Previous research assessed the validity of habitual equation used for 7–9-year-old children, it was found that BIA works well for TBW and FFM assessment in healthy subjects, although in chronic diseased subjects or children, a specific BIA equation should be which is applied appropriate with regard to age, sex and race(Reference Haroun, Taylor and Viner11–Reference Moon14). An important issue is that BIA was designed to measure the impedance across TBW, but BIA usually does not provide the equations to estimates FFM.
The present proposed equation for FFM has an R 2 0·92, using height, resistance and anthropometrical variables, which can be applied in 7–9-year-old Chilean children, and its validity should be tested if applied to children of different Hispanic origin.
Ethnic-specific impedance-based equations for body composition are justified because of differences in body build among ethnic groups(Reference Sluyter, Schaaf and Scragg18). Of special interests are relative leg lengths, frame size and body build which may be factors responsible for ethnic differences in the relationship of BMI to FM. On the other hand, FFM hydration decreases with age, an osseous content increases(Reference Wells, Fuller and Dewitt7,Reference Fields, Hull and Cheline27,Reference Collins, Saunders and McCarthy28) .
One of the strengths of this study is the use of the 3C model to validate FM (%) and FFM equations, needing fewer assumptions than the two-compartment model (2C model). That approach has to rely on assumptions, about the FFM density and hydration of TBW within the FFM which may vary substantially during child growth. In fact, from infancy to childhood and through adolescence, TBW decreases, whereas bone mass increases(Reference Wells, Fuller and Dewitt7,Reference Collins, Saunders and McCarthy28) . Therefore, 2C models tend to overestimate FM and underestimate FFM in children and are less accurate as a criterion method for developing anthropometric-based model or from BIA(Reference Wells, Fuller and Dewitt7,Reference Osborne, Weaver and McCabe43) . To the best of our knowledge, few studies have assessed differences and validity in Latino children, using BIA or anthropometric equation measurements against the 3C model (Reference Huang, Watkins and Goran10,Reference Ramirez, Valencia and Bourges17) .
The other advantage of this work is the sample size, which allowed for an adequate representation of the FM (%) and FFM (kg) variables for the equations in the 7–9-year-old children. With respect to weaknesses, we identified the limited age range studied, the amount of overweight in children in this work and the standard deviation for the FM (%) equation, which indicates that the equation should be applied to groups, rather than individuals.
In conclusion, the proposed equation for anthropometry and BIA should be used preferentially in children of Hispanic origin with similar age, ethnicity, obesity prevalence and maturation status, in order to diminish errors in the estimation of FM (%) or BIA FFM (kg) in the study of body composition of children 7–9 years of age.
Acknowledgements
We thank the children participating in the study and their parents.
We appreciate the support of Fondecyt Project grants no. 1090252 and 1100206 (Chile), which financed the study.
G. S. directed the collection of data and wrote the paper. B. L. performed the statistics of the paper. C. A. contributed to the writing up. A. A. measured samples in the mass spectrometer and BOD POD. G. W. contributed to the writing up. C. C. revised the paper and contributed to the writing.
The authors declare no conflicts of interest.


