


Introduction
Fluorescence resonance energy transfer (FRET) microscopy based on fluorescent proteins (FPs) has become an important tool for studying molecular dynamics in living cells (Butz et al., Reference Butz, Ben-Johny, Shen, Yang, Sang, Biel, Yue and Wahl-Schott2016; Algar et al., Reference Algar, Hildebrandt, Vogel and Medintz2019; Wang et al., Reference Wang, Shen, Ren, Zhao, Zhang, Qu and Liu2019; Vanderhoof et al., Reference Vanderhoof, Nelson, Beiner, Raicu and Oliver2020). Quantitative FRET signal, independent of the detection system and the expression level of FPs, is an inevitable requirement for academic exchanges (Ma et al., Reference Ma, Jongbloets, Xiong, Zhong and Mao2019; Mo et al., Reference Mo, Posner, Rodriguez, Sun and Zhang2020; Skruzny et al., Reference Skruzny, Pohl, Gnoth, Malengo and Sourjik2020; Yang et al., Reference Yang, Qu, Du, Mai, Wang, Ma, Wang and Chen2020). Quantitative FRET measurement based on linear unmixing of excitation–emission spectra (ExEm-spFRET) has the inherent ability to overcome both acceptor excitation crosstalk and donor emission crosstalk (Hoppe et al., Reference Hoppe, Scott, Welliver, Straight and Swanson2013; Mustafa et al., Reference Mustafa, Hannagan, Rigby, Pfleger and Corry2013; Du et al., Reference Du, Zhang, Xie and Chen2016). ExEm-spFRET with as few as two excitation wavelengths makes it easy to perform microscopic ExEm-spFRET imaging for single living cells. Our recent studies have demonstrated the strong robustness of ExEm-spFRET imaging (Lin et al., Reference Lin, Du, Yang, Wei and Chen2018; Su et al., Reference Su, Du, Lin, Zhang and Chen2019). We recently also performed an ExEm-unmixing-based FRET two-hybrid assay in living cells to analyze the stoichiometric information of macromolecular complexes (Zhang et al., Reference Zhang, Liu, Qu, Su, Du, Yang and Chen2019).
Accurately predetermining the acceptor–donor quantum yield ratio (Q A/Q D) and the acceptor–donor extinction coefficient ratio (K A/K D) is the prerequisite for quantitative ExEm-spFRET imaging (Mustafa et al., Reference Mustafa, Hannagan, Rigby, Pfleger and Corry2013; Du et al., Reference Du, Zhang, Xie and Chen2016; Zhang et al., Reference Zhang, Lin, Du, Qu, Mai, Qu and Chen2018; Su et al., Reference Su, Du, Lin, Zhang and Chen2019). Most FRET-related researches directly cited the quantum yield values of fluorophores reported in the literature to obtain Q A/Q D values (Wlodarczyk et al., Reference Wlodarczyk, Woehler, Kobe, Ponimaskin, Zeug and Neher2008; Elder et al., Reference Elder, Domin, Kaminski Schierle, Lindon, Pines, Esposito and Kaminski2009; Mustafa et al., Reference Mustafa, Hannagan, Rigby, Pfleger and Corry2013). However, in reality, the Q A/Q D value of a FRET measurement system is related to not only the optical properties of the donor and acceptor fluorophores but also the intracellular environment of the fluorophores and the spectra response of the measurement system. K A/K D is related to the spectra properties of the excitation light source, the transmission function of the measurement system, and the absorption spectra of the donor and acceptor (Wlodarczyk et al., Reference Wlodarczyk, Woehler, Kobe, Ponimaskin, Zeug and Neher2008; Elder et al., Reference Elder, Domin, Kaminski Schierle, Lindon, Pines, Esposito and Kaminski2009; Mustafa et al., Reference Mustafa, Hannagan, Rigby, Pfleger and Corry2013). Q A/Q D and K A/K D are constant for a given FRET fluorophore pair and measurement system. We recently proposed a method to measure the Q A/Q D and K A/K D values simultaneously by using four dishes of cells expressing tandem constructs with different FRET efficiencies (E) and the same acceptor–donor concentration ratio (R C) (Zhang et al., Reference Zhang, Lin, Du, Qu, Mai, Qu and Chen2018). This method needs to perform ExEm-spectra imaging for four dishes of cells, which is cumbersome to operate, and cannot guarantee the same image contrast and background signal for different dishes cells.
In this report, we propose an improved method to measure Q A/Q D and K A/K D values by imaging only one dish of cells expressing m kinds of different FRET tandem constructs. The cells expressing each one of the different kinds of FRET constructs are mixed into one dish which is performed ExEm-spectra imaging. The measured ExEm-spectra image is then unmixed to get the weight map of donor (W D), acceptor (W A), and donor–acceptor sensitization (W S). Finally, the W S/W D–W A/W D plot of different kinds of cells is linearly fitted to obtain K A/K D and Q A/Q D. Based on the predetermined ranges of W S/W D (R SD) and W S/W A (R SA) of each FRET constructs, our method is capable of automatically classifying the cells expressing different FRET constructs in one dish and thus makes it possible to perform the automatic measurement of the Q A/Q D and K A/K D values by one-click operation.
Method and Materials
Cell Culture, Tandem FRET Constructs, and Transfection
Cell lines Hela were obtained from the Cell Bank of the Chinese Academy of Sciences (Shanghai, China) and cultured in Dulbecco's Modified Eagle's Medium (DMEM, Gibco, Grand Island, NE, USA) supplemented with 10% fetal bovine serum (FBS, Sijiqing, Hangzhou, China) and 1% penicillin and streptomycin (Gibco, Grand Island, NE, USA) in CO2 incubators (Thermo Fisher, USA).
Cerulean (C) and Venus (V) were purchased from Addgene Company (Cambridge, MA, USA), and CTV, C32V, C17V, and C5V constructs were kindly provided by the Vogel Lab (National Institutes of Health, Bethesda, Maryland) (Thaler et al., Reference Thaler, Koushik, Blank and Vogel2005; Koushik et al., Reference Koushik, Blank and Vogel2009).
For transfection, Hela cells were first cultured in the four wells of a six-well plate, and each well contained 1 mL DMEM. CTV, C32V, C17V, and C5V were transfected, respectively, into the four wells of cells for 4–6 h by using Lipofectamine 2000 (Invitrogen, Carlsbad, CA, USA). The cells in the four wells were then detached and subsequently mixed into a 35-mm glass dish and cultured for 12–24 h in CO2 incubators (Yin et al., Reference Yin, Sun, Chen, Liu, Tang, Yuan, Tu, Zhuang and Chen2021).
Theory and Measurement Steps
Theory
The ExEm-spectra signatures of the donor (S D), acceptor (S A), and donor–acceptor sensitization (S S) are the outer product of the excitation spectra  $( S_X^{{\rm ex}} , \;X = {\rm D}\,{\rm and}\,{\rm A})$ and the emission spectra
  $( S_X^{{\rm em}} , \;X = {\rm D}\,{\rm and}\,{\rm A})$ measured from donor-only and acceptor-only samples, respectively, as follows (Zhang et al., Reference Zhang, Lin, Du, Qu, Mai, Qu and Chen2018):
 $$\eqalign{& S_{\rm D} = S_{\rm D}^{{\rm ex}} \otimes S_{\rm D}^{{\rm em}} \cr & S_{\rm A} = S_{\rm A}^{{\rm ex}} \otimes S_{\rm A}^{{\rm em}} \cr & S_{\rm S} = S_{\rm D}^{{\rm ex}} \otimes S_{\rm A}^{{\rm em}} .} $$
The ExEm-spectra image (S DA) of a FRET sample is linearly separated into three parts as follows:
 $$S_{{\rm DA}} = W_{\rm D}\cdot S_{\rm D} + W_{\rm S}\cdot S_{\rm S} + W_{\rm A}\cdot S_{\rm A}, \;$$
where W D, W S, and W A are the contributions of the S D, S S, and S A in S DA, respectively. We also obtain (Du et al., Reference Du, Zhang, Xie and Chen2016; Zhang et al., Reference Zhang, Lin, Du, Qu, Mai, Qu and Chen2018; Su et al., Reference Su, Du, Lin, Zhang and Chen2019; Zhang et al., Reference Zhang, Liu, Qu, Su, Du, Yang and Chen2019)
 $$\displaystyle{{W_{\rm S}} \over {W_{\rm D}}} = \displaystyle{{K_{\rm D}} \over {K_{\rm A}}}\cdot \displaystyle{{W_{\rm A}} \over {W_{\rm D}}}-\displaystyle{{Q_{\rm A}} \over {Q_{\rm D}}}, \;$$
where Q A/Q D is the acceptor–donor quantum yield ratio, and K A/K D is the acceptor–donor extinction coefficient ratio.
For different FRET tandem constructs with different FRET efficiencies (such as CTV, C32V, C17V, and C5V), measure their W A-i/W D-i and W S-i/W D-i ratios (Fig. 1a), and perform a linear fitting according to equations (3) to obtain the K A/K D (the reciprocal of the slope of the linear equation) and Q A/Q D (the absolute value of the intercept) of the imaging system (Fig. 1b).

Fig. 1. (a) Diagram of measuring K A/K D and Q A/Q D. (b) Plot of W S/W D–W A/W D for linearly fitting to obtain K A/K D and Q A/Q D. The reciprocal of the slope of the line is K A/K D, and the absolute value of the intercept is Q A/Q D.
Measurement Steps
Cells (test sample) expressing different FRET tandem constructs, cultured in a 35-mm glass dish, are used for measuring Q A/Q D and K A/K D, which includes the following three steps:
-
Step 1: predetermining the ranges of W S/W A (R SA) and W S/W D (R SD) of each FRET tandem construct.
a. The ExEm-spectra image of the test sample is segmented into M independent cells. For the ith segmented cell (i = 1, 2, 3,…, M), the ExEm-spectra images (S DA-i) are unmixed according to equation (2) to obtain the three weight images (W D-i, W S-i, and W A-i), and the corresponding W S-i/W A-i and W S-i/W D-i ratio images and frequency distribution histogram plot are fitted by a single-Gaussian function. The Gaussian peak values of W S-i/W A-i and W S-i/W D-i are denoted as SA-i and SD-i, respectively.
b. The SA and SD frequency distribution histogram plots for the M cells are fitted by multi-Gaussian (m-Gaussian, m is the number of the FRET tandem construct species used for test) function, and the SA and SD Gaussian peaks are recorded as P SA-1, P SA-2,…, P SA-m and P SD-1, P SD-2,…, P SD-m, respectively.
c. The R SA-m and R SD-m of the mth kind of FRET tandem constructs are defined as P SA-m±δ Am and P SD-m±δ Dm, and the δ Am and δ Dm values are defined according to the m-Gaussian function fitting.
-
Step 2: Classification of cells expressing different FRET tandem constructs.
a. For a test sample, the ExEm-spectra image is unmixed to obtain the SA and SD images according to equation (2).
b. Generating m kinds of classification masks according to SA and SD images: for a pixel, if the SA is in R SA-j and SD is in R SD-j (j = 1, 2,…, m), the pixel value is set to 1; otherwise, it is set to 0, and the corresponding mask is denoted as CM-j.
c. The cells are divided into m kinds of cells by using the CM -1, CM -2,…,CM -m masks, respectively, to filter the W S/W D and W A/W D images and calculate the corresponding statistical value for each kind of cells.
-
Step 3: Linearly fitting the W S/W D–W A/W D plot for the m kinds of FRET tandem constructs to obtain K A/K D and Q A/Q D according to equations (3) (Fig. 1b).
ExEm-Spectra Imaging
ExEm-spectra imaging was performed on a self-built ExEm-spectra FRET microscope which consists of a wide-field microscope (IX73, Olympus, Tokyo, Japan) equipped with a motorized cube wheel (IX3-RFACA, Olympus), a motorized emission filter wheel (FW103, Thorlabs, Newton, New Jersey, USA) with six positions in total, an sCMOS camera (Flash 4.0, Hamamatsu Photonics k.k., Hamamatsu, Japan), a 40×/1.30 objective (Olympus), and a mercury lamp (HGLGPS, Olympus). The excitation filter (Ex 436/20 nm and Ex 470/20 nm, Chroma, Vermont, USA) was set in the cube wheel, and the emission filter (Em 470/20 nm, Em 490/20 nm, Em 510/20 nm, Em 530/20 nm, and Em 550/20 nm, Chroma, Vermont, USA) was set in the emission filter wheel (Supplementary Fig. 1).
Results and Discussion
Predetermining the Ranges of W S/W D (R SD) and W S/W A (R SA) Values
First, cells separately expressing C or V were used to measure their ExEm-spectra (S D, S A, and S S) through the outer product of their normalized ExEm-spectra (Supplementary Fig. 2). Figure 2 shows the process how to predetermine the R SD and R SA ranges of CTV, C32V, C17V, and C5V constructs by using one dish of cells. Cells transfected separately with CTV, C32V, C17V, or C5V construct for 5 h in a six-well plate were combined into one dish and then were cultured for 12 h before ExEm-spectra imaging. Figure 2a shows the ExEm-spectra images of the dish of cells, which were unmixed to obtain the pseudo-color images of W S/W A and W S/W D according to equation (2) (Fig. 2b). The cell circled by a red box in Figure 2b was performed pixel-by-pixel frequency distribution histogram plots of W S/W A and W S/W D values (blue dots, Fig. 2c) and a single-Gaussian function fitting (red line, Fig. 2c), exhibiting peak values: SD = 0.94 and SA = 1.64. We performed a similar single-Gaussian function fitting for the frequency-W S/W A and frequency-W S/W D histograms of 589 cells in the dish of cells and plotted SA and SD frequency distribution histogram (Fig. 2d) which was fitted by using a four-Gaussian function fitting. The four-Gaussian peak values are P SD-CTV = 0.10, P SD-C32V = 0.60, P SD-C17V = 0.90, and P SD-C5V = 1.30; P SA-CTV = 0.15, P SA-C32V = 1.40, P SA-C17V = 1.90, and P SA-C5V = 2.30. Eventually, we predetermined the range of both R SD and R SA for each FRET construct as following (Fig. 2e): R SD ~ (0.05, 0.15) and R SA ~ (0.1, 0.2) for CTV; R SD ~ (0.5, 0.7) and R SA ~ (1.35, 1.55) for C32V; R SD ~ (0.8, 1.0) and R SA ~ (1.8, 2.0) for C17V; and R SD ~ (1.2, 1.4) and R SA ~ (2.2, 2.4) for C5V.

Fig. 2. Predetermining the R SD and R SA for CTV, C32V, C17V, and C5V constructs, respectively. (a) ExEm-spectra images of one dish of cells expressing four kinds of FRET tandem constructs. (b) Pseudo-color images of the W S/W D and W S/W A obtained by unmixing the ExEm-spectra images (a). (c) Single-Gaussian function fitting of the frequency distribution of W S/W D and W S/W A for the cell indicated by red box in (b) to obtain its SD and SA values. (d) Four-Gaussian function fitting for the frequency-SD and frequency-SA plots from 589 cells, including 184 CTV cells, 287 C32V cells, 65 C17V cells, and 53 C5V cells. The red line indicates CTV; the blue line indicates C32V; the green line indicates C17V; and the purple line indicates C5V. (e) R SD and R SA values of four kinds of FRET constructs.
Twice Gaussian fittings are used to predetermine the ranges of R SA and R SD. A single-Gaussian function fitting is first performed to obtain the peak values of SA and SD for each cell (Fig. 2c), and then a four-Gaussian function fitting is performed for the frequency-peak histograms of SA and SD from all cells to classify the cells expressing different kinds of constructs (Fig. 2d), and finally, the R SA and R SD ranges of each FRET tandem construct were determined according to the four-Gaussian function fitting (Fig. 2e). The obtained R SA and R SD ranges are very stable and accurate by using twice Gaussian fittings. In reality, we also directly performed the plots of frequency-W S/W A (Supplementary Fig. 3a) and frequency-W S/W D (Supplementary Fig. 3b) for the same 589 cells, and we only clearly determined two Gaussian peaks, and the other peaks were buried, which lead to inaccurate cell classification.
It is obvious that the narrower the ranges of R SD and R SA, the more accurate the cell classification. However, too narrow ranges of R SD and R SA must leave out many cells, which is not conducive to subsequent fitting. For predetermining more accurate R SD and R SA, we hope that each FRET construct has a high expression level, and their FRET efficiency has significant differences. Moreover, we also hope that as many cells as possible are imaged, ensuring the number of cells expressing different types of FRET tandem constructs meets the statistical criteria. For a dish of cells, it is difficult to ensure that different FRET constructs have similar transfection efficiency and expression level, thus the numbers of cells expressing different FRET tandem constructs are not controllable. There are two rules for predetermining R SD or R SA: (1) avoiding the R SD / R SA ranges across of different FRET tandem constructs; (2) R SD or R SA of different FRET tandem constructs should be as large as possible. In reality, we counted 589 cells in one dish containing 184 cells expressing CTV, 287 cells expressing C32V, 65 cells expressing C17V, and 53 cells expressing C5V. We determined R SD and R SA (Fig. 2e) by using twice Gaussian fitting. In reality, the number of the cells expressing C17V or C5V was significantly less than that of the cells expressing C32V or CTV in the same image field, which may be due to the insufficient detachment of the C17V or C5V cells from the six-well plate compared with the CTV cells and C32V cells. Although the difference in the number of each kind of construct cells does not influence our R SD or R SA results, it is better to improve the experimental technique to control the considerable number of various FRET construct cells. We strongly recommend that cells had better reach 90% of the well plate before transfection, and the cells sufficiently detached from the well plate need to be centrifuged after finish transfection before they are fully mixed to ensure cells evenly spread in a 35-mm glass dish.
Accurate cell segmentation is necessary for predetermining the ranges of R SD and R SA. Due to the very small distances between adjacent cells, a cell mask may contain a few different FRET tandem construct cells, which must result in an inaccurate Gaussian fitting. In reality, we found that background filtering threshold was very important for accurate cell segmentation. We defined a threshold β factor to characterize the effect of different background filtering threshold on cell segmentation. β *I BG (background gray level) was used as the threshold value that was deducted from the original image (I raw) to obtain I raw −β *I BG image which was then binarized (let pixels less than 0 equal to 0, and let pixels greater than 0 equal to 1) to obtain mask (I mask). As shown in the red box of Figure 3a, the cell outline of the connected areas becomes finer and finer by increasing β from 1 to 2.5, and five cells can be perfectly segmented when β = 2.5. However, there are still some overlapping cells that cannot be effectively segmented by increasing β in the blue box. In reality, most of the connected regions can be segmented appropriately in the case of β = 1.6. For a connected cell, the adjusted R2 coefficient (Marchal-bressenot et al., Reference Marchal-Bressenot, Salleron, Boulagnon-Rombi, Bastien, Cahn, Cadiot, Diebold, Danese, Reinisch, Schreiber, Travis and Peyrin-Biroulet2015) was used to evaluate the accuracy of Gaussian fitting. For performing the single-Gaussian function fitting, the closer value of adjusted R 2 is to 1, the more accurate the Gaussian fitting. As shown in the first line of Figure 3b, we performed a single-Gaussian function fitting on the connected regions of overlapping cells (blue box of Fig. 3a, β = 2.5), and the adjusted R 2 values obtained from the fitting results of W S/W A and W S/W D are 0.30 and 0.38, respectively, indicating this area contains different cells expressing with different constructs. In contrast, as shown in the second line of Figure 3b, the adjusted R 2 values of a segmented cell in the red box of Figure 3a (β = 2.5) are 0.98 and 0.99, respectively, indicating the effective single-cell segmentation. We took the adjusted R 2 value greater than 0.95, as the prerequisite of a connected cells area can be segmented into a single-cell segmentation level to ensure the accuracy of the predetermined R SD and R SA values.

Fig. 3. Effect of background filtering threshold on cell segmentation. (a) Cell segmentation with different background filtering threshold. Left: original cell image expressing four kinds of FRET tandem constructs in one dish. Right: masks obtained by subtracting different threshold from the original image. (b) Cell segmentation and adjusted R 2 values. First line: left, cell mask (blue box of (a), β = 2.5); Middle and right: frequency distribution histogram plots of W S/W A and W S/W D values (blue dots) and single-Gaussian function fitting (red line), the adjusted R 2 values are 0.30 and 0.38, respectively. Second line: left, cell mask (one region of red box of (a), β = 2.5); Middle and right: frequency distribution histogram plots of W S/W A and W S/W D values (blue dots) and single-Gaussian function fitting (red line), the adjusted R 2 values are 0.98 and 0.99, respectively.
Measure K A/K D and Q A/Q D by Using One Dish of Cells
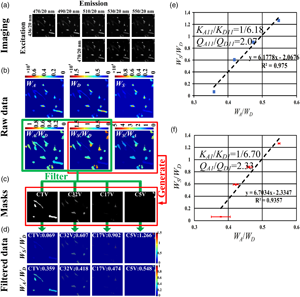
After the cells transfected separately with CTV, C32V, C17V, or C5V for 5 h were combined into one dish and then cultured for 12 h, we performed ExEm-spectra imaging. Figure 4a shows the ExEm-spectra images of a representative field, which was linearly separated according to equation (2) to obtain W D, W A, and W S, and the corresponding W A/W D, W S/W D (SD), and W S/W A (SA) images (Fig. 4b). We next produced four cell classification masks according to the SD and SA images. According to Figure 2e, for a pixel, if the SD is in (0.05, 0.15) and the SA is in (0.1, 0.2), the pixel value of the mask was set as 1, otherwise as 0, obtaining CTV cell classification mask (CTV mask) (Fig. 4c). Similarly, we also obtained C32V mask, C17V mask, and C5V mask (as shown in Fig. 4c). Next, we used the four masks to filter the raw W S/W D and W A/W D images, respectively, and obtained the filtered W S/W D and W A/W D images (Fig. 4d). Nineteen cells were recognized in this representative field, including four CTV cells, eight C32V cells, five C17V cells, and two C5V cells. For this field, W S-CTV/W D-CTV = 0.069 and W A-CTV/W D-CTV = 0.359; W S-C32V/W D-C32V = 0.607 and W A-C32V/W D-C32V = 0.418; W S-C17V/W D-C17V = 0.902 and W A-C17V/W D-C17V = 0.474; and W S-C5V/W D-C5V = 1.266 and W A-C5V/W D-C5V = 0.548. We linearly fitted the W S/W D–W A/W D plot and obtained K A11/K D11 = 1/6.18 and Q A11/Q D11 = 2.07 (Fig. 4e). We selected 45 ExEm-spectra imaging fields, and the average fitting results of four FRET constructs are shown in Figure 4f, obtaining K A1/K D1 = 1/6.70 and Q A1/Q D1 = 2.33.

Fig. 4. K A/K D and Q A/Q D measurement by unmixing the ExEm-spectra of a dish of cells expressing CTV, C32V, C17V, and C5V. (a) ExEm-spectra images of one dish of cells expressing the four kinds of constructs. (b) W D, W A, W S, and the corresponding Raw SD and SA images. (c) CTV, C32V, C17V, and C5V masks. (d) Filtered W S/W D and W A/W D images by using the masks. (e) Linearly fitting the W S/W D–W A/W D plot from (d) and obtain K A/K D = 1/6.18 and Q A/Q D = 2.07 of (a). (f) Linearly fitting the W S/W D–W A/W D plot from 45 ExEm-spectra imaging fields and obtain K A1/K D1 = 1/6.70 and Q A1/Q D1 = 2.33.
In generating classification masks from W S/W D and W S/W A images, we also evaluated the effect of signal-to-noise ratio (S/N ratio) on our method. In reality, cells with S/N ratios greater than 1.6 are filtered pixel-by-pixel. For example, for the cell indicated by red box in Supplementary Figure 4a, the W S/W D, W S/W A, and W A/W D images are uniform (Supplementary Fig. 4b) but the corresponding S/N ratio images are from 1.6 to 25 (Supplementary Fig. 4c), indicating that W S/W D, W S/W A, and W A/W D are independent of S/N ratio in this S/N ratio ranges. Next, pixels were divided into two kinds of pixels (1.6 < S/N < 5 and S/N > 5) to further evaluate the influence of the S/N ratio on the measured results. In the case of 1.6 < S/N<5, the measured result is K A/K D(1.6<S/N<5) = 1/6.412 and Q A/Q D(1.6<S/N<5) = 2.174, consistent with the K A/K D(S/N>5) = 1/6.315 and Q A/Q D(S/N>5) = 2.069 in the case of S/N > 5, further indicating that S/N ratio greater than 1.6 has no effect on the measured K A/K D and Q A/Q D values.
Anomalous CTV Construct
We found that after cell filtering by classification masks, the W A/W D value range of CTV is larger than other FRET constructs. The fitting results using three constructs (C32V, C17V, and C5V) without CTV are shown in Figure 5b, obtaining K A2/K D2 = 1/5.13 and Q A2/Q D2 = 1.54. We measured the E D and R C values of C17V with two sets of correction factors and compared them with the values reported in the literature (Koushik et al., Reference Koushik, Chen, Thaler, Puhl and Vogel2006, Reference Koushik, Blank and Vogel2009; Koushik & Vogel, Reference Koushik and Vogel2008) as shown in Figure 5c. The E D value calculated by using Q A2/Q D2 = 1.54 is 0.39, consistent with the literature value (Koushik et al., Reference Koushik, Chen, Thaler, Puhl and Vogel2006), while the E D value calculated by using 2.33 of Q A1/Q D1 is 0.29, significantly lower than the literature value (0.38) (Koushik et al., Reference Koushik, Chen, Thaler, Puhl and Vogel2006). The calculated R C value by using the K A2/K D2 and K A1/K D1, respectively, is close to 1 (Fig. 5c). We also calculated the E D and R C values of cells expressing C32V, C17V, and C5V by using the K A2/K D2 = 1/5.13 and Q A2/Q D2 = 1.54 and obtained consistent results with the values reported in the literature (Figs. 5d, 5e) (Koushik et al., Reference Koushik, Chen, Thaler, Puhl and Vogel2006).

Fig. 5. A negative influence of CTV construct. (a) Linearly fitting the W S/W A–W A/W D plot from the four FRET constructs including CTV, C32V, C17V, and C5V, and obtain the correction factors K A1/K D1 = 1/6.70 and Q A1/Q D1 = 2.33. (b) Linearly fitting the W S/W A–W A/W D plot from the three FRET constructs including C32V, C17V, and C5V, and obtain the correction factors K A2/K D2 = 1/5.13 and Q A2/Q D2 = 1.54. (c) E D and R C results of the C17V cells by using two sets of K A/K D and Q A/Q D values. (d,e) E D (d) and R C (e) values of three constructs calculated by using the K A2/K D2 = 1/5.13 and Q A2/Q D2 = 1.54.
The facts that the E D value of C17V measured by using K A1/K D1 and Q A1/Q D1 obtained by using C32V, C17V, C5V, and CTV constructs is 0.28, much lower than the 0.39 (the expected value is 0.38) measured by using K A2/K D2 and Q A2/Q D2 obtained by using C32V, C17V, and C5V constructs further demonstrate the Coulomb's opinion that the tendency of the C–V linker of CTV is forming trimers, thereby bringing the fluorophores in close contact causing energy transfer from C to several V acceptors (Coullomb et al., Reference Coullomb, Bidan, Qian, Wehnekamp, Oddou, Albigès-Rizo, Lamb and Dupont2020). Therefore, CTV is unsuitable for our method.
Conclusion
In this report, we propose a method to measure the system calibration factors (K A/K D and Q A/Q D) by spectrally imaging only one dish of cells expressing m (m ≥ 3) kinds of FRET tandem constructs. Because of imaging only one dish of cells to complete the measurement of K A/K D and Q A/Q D, our method bypasses the influence of different contrast and background signals during ExEm-spectra imaging. In addition, our method is capable of automatically classifying cells expressing different FRET constructs, making it possible to realize the automatic measurement of K A/K D and Q A/Q D by one-clink operation. It is worth noting that our experiment further proves the abnormality of CTV which is unsuitable for our method. Therefore, our method provides a solid basis to realize automatic ExEm-spectra imaging and system calibration, thereby lowing the threshold of live-cell FRET imaging, furthermore paving the way of developing an intelligent FRET correction system.
Supplementary material
To view supplementary material for this article, please visit https://doi.org/10.1017/S1431927621012642.
Acknowledgments
The authors thank Prof. S. S. Vogel (HIN/NIAAA) for providing CTV, C32V, C17V, and C5V constructs. This work is supported by the National Natural Science Foundation of China (NSFC) (Grant Nos. 61875056 and 62135003) and the Science and Technology Program of Guangzhou (Grant No. 2019050001).


