


Understanding how the environment differently affects different individuals is fundamental to developmental science. Theories of individual differences in environmental susceptibility postulate that some individuals are susceptible to environmental exposures, while others are not, or are much less, susceptible (Ellis et al., Reference Ellis, Boyce, Belsky, Bakermans-Kranenburg and van IJzendoorn2011; Pluess, Reference Pluess2015). Different theories and frameworks have raised this idea in slightly different forms, but here we relate to the general concept of environmental susceptibility (elaboration on the various models and theories can be found elsewhere, for example, Ellis et al., Reference Ellis, Boyce, Belsky, Bakermans-Kranenburg and van IJzendoorn2011; Pluess, Reference Pluess2015). Evidence supporting this notion has been repeatedly provided, showing that the effects of a wide variety of environmental exposures (e.g., harsh parenting, attachment, child-care quality, socioeconomic status, peer victimization) on a broad set of developmental outcomes (e.g., externalizing behavior, prosocial behavior, depression, life satisfaction, language development) are moderated by person-based variables, such as temperamental, physiological, and genetic factors (Belsky & Pluess, Reference Belsky and Pluess2009, Reference Belsky and Pluess2013). This was found both in observational studies (see meta-analyses: Bakermans-Kranenburg & van IJzendoorn, Reference Bakermans-Kranenburg and van IJzendoorn2011; Slagt et al., Reference Slagt, Dubas, Deković and van Aken2016; van IJzendoorn et al., Reference van IJzendoorn, Belsky and Bakermans-Kranenburg2012) and experimental studies (see meta-analysis: van IJzendoorn & Bakermans-Kranenburg, Reference van IJzendoorn and Bakermans-Kranenburg2015). However, in theoretical and empirical studies it was often implied, perhaps unintentionally, that environmental susceptibility is a unidimensional trait, where there are two types of individuals in the world, those who are susceptible to environmental influences and those who are not. But are there indeed types of susceptibility or is environmental susceptibility a continuum? Furthermore, if environmental susceptibility is a continuum, is it a unidimensional trait, or a complex multidimensional phenomenon, where individuals show varying combinations of the environmental exposures they are influenced by, and the developmental outcomes influenced? The possibility that environmental susceptibility is not categorical and might be more complex was already raised in early, influential, papers on environmental susceptibility as important issues to address (Belsky et al., Reference Belsky, Bakermans-Kranenburg and van IJzendoorn2007; Belsky, Reference Belsky, Ellis and Bjorklund2005; Belsky & Pluess, Reference Belsky and Pluess2009, Reference Belsky and Pluess2013; Ellis et al., Reference Ellis, Boyce, Belsky, Bakermans-Kranenburg and van IJzendoorn2011). Yet only recently these questions have begun to receive empirical attention (Belsky et al., Reference Belsky, Zhang and Sayler2021; Markovitch et al., Reference Markovitch, Kirkpatrick and Knafo-Noam2021; Markovitch & Knafo-Noam, Reference Markovitch and Knafo-Noam2021; Sayler et al., Reference Sayler, Zhang, Steinberg and Belsky2022; Zhang et al., Reference Zhang, Widaman and Belsky2021, Reference Zhang, Schlomer, Ellis and Belsky2022). Understanding the complex phenomenon of individual differences in environmental susceptibility requires additional investigations, especially ones that use diverse analytic approaches.
The current paper aims to address several research questions. The first two questions concern the nature of environmental susceptibility: First, we investigate whether environmental susceptibility shows a categorical or continuous pattern. Second, we examine whether environmental susceptibility shows a pattern of a unidimensional trait or a multidimensional system. This is done by investigating an environmental susceptibility space, which is based on simultaneous associations between diverse measures of environmental exposures and developmental outcomes and using a novel, data-driven, analytical approach. The third and fourth questions relate to understanding the origin of different environmental susceptibility patterns, by estimating the genetic contributions to individual differences in environmental susceptibility, and the associations between environmental susceptibility patterns and temperament traits, as both genetic and temperamental factors have been implicated as markers of environmental susceptibility (Bakermans-Kranenburg & van IJzendoorn, Reference Bakermans-Kranenburg and van IJzendoorn2011; Belsky & Pluess, Reference Belsky and Pluess2009, Reference Belsky and Pluess2013; Slagt et al., Reference Slagt, Dubas, Deković and van Aken2016; van IJzendoorn et al., Reference van IJzendoorn, Belsky and Bakermans-Kranenburg2012; van IJzendoorn & Bakermans-Kranenburg, Reference van IJzendoorn and Bakermans-Kranenburg2015). It is important to note that due to the possible complexity of environmental susceptibility (a multitude of developmental outcomes can potentially be affected by a multitude of environmental exposures) no single study can answer such questions with certainty. Rather, this paper aims to join similar recent attempts (Belsky et al., Reference Belsky, Zhang and Sayler2021; Markovitch et al., Reference Markovitch, Kirkpatrick and Knafo-Noam2021; Markovitch & Knafo-Noam, Reference Markovitch and Knafo-Noam2021; Sayler et al., Reference Sayler, Zhang, Steinberg and Belsky2022; Zhang et al., Reference Zhang, Widaman and Belsky2021, Reference Zhang, Schlomer, Ellis and Belsky2022) and find proof-of-principle results addressing important theoretical questions.
Environmental susceptibility as a categorical versus continuous trait
A reality where there are two susceptibility types suggests that susceptible individuals will be susceptible to the effects of many environmental exposures on many developmental outputs and nonsusceptible individuals will be susceptible to none (domain generality), whereas an alternative reality can suggest that different individuals can be susceptible to effects of different environmental exposures on different behavioral outcomes (domain specificity). As human development is inherently dependent on environmental inputs, the possibility of individuals who are not susceptible to any environmental exposures might not seem very plausible (Belsky, Reference Belsky, Ellis and Bjorklund2005; Markovitch & Knafo-Noam, Reference Markovitch and Knafo-Noam2021), but by some accounts nonsusceptible individuals are suggested to be the majority of the population (Greven et al., Reference Greven, Lionetti, Booth, Aron, Fox, Schendan, Pluess, Bruining, Acevedo, Bijttebier and Homberg2019).
Indeed, both theoretical and empirical literature on environmental susceptibility discuss it using a language that focuses on two options of environmental susceptibility – susceptible and not-susceptible creating an influential reach for such a view (Zhang et al., Reference Zhang, Widaman and Belsky2021). From a theoretical standpoint, the dominant theories postulating that individuals differ in their susceptibility to positive and negative environmental influences (see Pluess, Reference Pluess2015) have framed environmental susceptibility dichotomously (as was recently suggested by Belsky et al., Reference Belsky, Zhang and Sayler2021; Zhang et al., Reference Zhang, Widaman and Belsky2021). Boyce and Ellis (Reference Boyce and Ellis2005), in their biological sensitivity to context theory, have related to susceptible and non-susceptible children as “orchids” and “dandelions”; Aron and Aron’s (1997) sensory-processing sensitivity theory describes a “highly sensitive person”, implying that there are highly susceptible individuals, and individuals who are not highly susceptible; Finally, Belsky (Reference Belsky, Ellis and Bjorklund2005) related to “fixed” versus “plastic” children in his early work on the evolutionary rationale behind the differential susceptibility theory. From an empirical standpoint, the susceptibility markers often used to test environmental susceptibility are either categorical by nature (i.e., candidate genes), or illustrated in results’ sections as categorical variables to assist in interpreting relevant results. Furthermore, work done on data measured by the “Highly Sensitive Person” scale (Aron & Aron, Reference Aron and Aron1997) identified three classes of sensitivity, low, medium, and high, in two different samples (Lionetti et al., Reference Lionetti, Aron, Aron, Burns, Jagiellowicz and Pluess2018; Pluess et al., Reference Pluess, Assary, Lionetti, Lester, Krapohl, Aron and Aron2018). Thus, empirical work has perhaps strengthened the notion of a dichotomous, or at least categorical, susceptibility pattern, even if it was unintentionally.
Nonetheless, seminal theoretical literature has argued that environmental susceptibility should be treated more as a continuum than discrete (Belsky, Reference Belsky, Ellis and Bjorklund2005; Ellis et al., Reference Ellis, Boyce, Belsky, Bakermans-Kranenburg and van IJzendoorn2011) or that different environment-outcome relations may show different categorical/continuous susceptibility patterns (Belsky et al., Reference Belsky, Bakermans-Kranenburg and van IJzendoorn2007). However, this was not addressed empirically until recently. Belsky and his colleagues have suggested that a more nuanced view of differential susceptibility is warranted (Belsky et al., Reference Belsky, Zhang and Sayler2021; Zhang et al., Reference Zhang, Widaman and Belsky2021) and tried to address, more directly, the question of whether environmental susceptibility can be divided into two categories or whether it is continuous (Zhang et al., Reference Zhang, Widaman and Belsky2021). This group examined young children and calculated for each of them a general susceptibility score. They then studied whether the distribution of this susceptibility score was bimodal (indicating two groups) or unimodal (indicating a more continuous trait). Susceptibility scores were normally, and not bimodally distributed. This important first evidence for a continuum challenges the view of susceptibility categories and calls for additional data collection and analysis, as was encouraged by the authors themselves (Zhang et al., Reference Zhang, Widaman and Belsky2021). Furthermore, this study raises many new questions, the first being what happens along children’s lifespan. For instance, one could argue that the unimodal pattern of susceptibility reflects the young age (4.5 years) of Zhang and colleagues’ (Reference Zhang, Widaman and Belsky2021) sample, while during the developmental course susceptibility patterns are strengthened, gradually creating a greater distinction between individuals into separate clusters of susceptibility. Thus, research on older children is needed as well.
Second, while the Zhang and colleagues (Reference Zhang, Widaman and Belsky2021) study, for the first time, included multiple measures of environmental exposures and developmental outcomes (instead of just the moderation of a specific environmental effect on a specific outcome), the environmental exposures and outcomes studied were still limited. The environmental exposure measures related to either child-care characteristics (e.g., quantity) or familial characteristics (e.g., parenting, maternal education), and the outcome measures related to social behaviors (e.g., behavior problems) or cognitive-linguistic functioning (e.g., language competence). To understand environmental susceptibility more fully, we need to examine the effects of additional environmental domains (e.g., peers; of note are recent studies by Markovitch et al., Reference Markovitch, Kirkpatrick and Knafo-Noam2021; Markovitch & Knafo-Noam, Reference Markovitch and Knafo-Noam2021; Sayler et al., Reference Sayler, Zhang, Steinberg and Belsky2022) on varied developmental outcomes (e.g., empathy). Therefore, the first aim of this study was to examine whether individual differences in environmental susceptibility create distinct groups or a continuum, using a different, data-driven, approach on an older sample of early adolescents, and within other contexts. Considering Zhang’s (Reference Zhang, Widaman and Belsky2021) findings, we hypothesized that environmental susceptibility would show a continuum rather than a classification into distinct groups.
Environmental susceptibility as a unidimensional trait versus multidimensional system
The perspective of environmental susceptibility as a continuum (instead of categorical) still treats environmental susceptibility as trait-like, that is, as a unidimensional continuum. This relates to the question of whether environmental susceptibility is more domain general or domain specific, which was raised in a few theoretical works, usually only in passing (Belsky et al., Reference Belsky, Bakermans-Kranenburg and van IJzendoorn2007; Belsky, Reference Belsky, Ellis and Bjorklund2005; Belsky & Pluess, Reference Belsky and Pluess2009, Reference Belsky and Pluess2013; Ellis et al., Reference Ellis, Boyce, Belsky, Bakermans-Kranenburg and van IJzendoorn2011). Even if not explicitly, the literature on environmental susceptibility is typically discussed in domain-general terms. This is true both when discussing two groups of susceptibility (susceptible to all or susceptible to none), and when relating to a unidimensional continuous trait (where individuals are susceptible in varying degrees to many contexts). In contrast, the domain-specific perspective will predict that different individuals can be susceptible to different environmental influences and in respect to different developmental outcomes. Such a view does not see environmental susceptibility as a unidimensional trait, but rather as a multidimensional phenomenon, where individuals can show varying combinations of the environmental factors they are susceptible to, and the developmental outcomes affected.
When the issue of domain generality versus domain specificity was previously discussed, the possibility of individuals who are susceptible to all environmental exposures on all developmental outcomes and others who are susceptible to none (i.e., domain generality) was deemed unlikely, based on both theoretical and evolutionary thinking (e.g., Belsky et al., Reference Belsky, Zhang and Sayler2021; Belsky, Reference Belsky, Ellis and Bjorklund2005; Ellis et al., Reference Ellis, Boyce, Belsky, Bakermans-Kranenburg and van IJzendoorn2011; Markovitch & Knafo-Noam, Reference Markovitch and Knafo-Noam2021). However, environmental susceptibility was still often discussed in domain-general terms with no work to empirically test this. Only recently a few studies have tried to empirically address the specificity aspect of environmental susceptibility, and all have demonstrated, with very different methods, that within the contexts tested, different individuals can be susceptible to different environmental exposures or regarding different developmental outcomes (Belsky et al., Reference Belsky, Zhang and Sayler2021; Markovitch et al., Reference Markovitch, Kirkpatrick and Knafo-Noam2021; Markovitch & Knafo-Noam, Reference Markovitch and Knafo-Noam2021; Sayler et al., Reference Sayler, Zhang, Steinberg and Belsky2022; Zhang et al., Reference Zhang, Widaman and Belsky2021, Reference Zhang, Schlomer, Ellis and Belsky2022).
Even though these studies showed preliminary evidence supporting domain specificity, almost all of them showed it with a limited number of measures. For example, Belsky and colleagues (2021) showed that children who were susceptible to the effects of quality of child-care on pre-academic skills were not necessarily the children who were susceptible to quantity of care on behavior problems. However, it is important to demonstrate domain specificity in a wider variety of contexts. Notably in this regard, Zhang and colleagues (Reference Zhang, Widaman and Belsky2021) were recently the first to try and measure environmental susceptibility across an array of environmental and outcome measures (an effort continued by the work of Sayler et al. (Reference Sayler, Zhang, Steinberg and Belsky2022) from the same research team). They measured 40 associations between eight environmental exposures (five familial and three child-care measures) and five developmental outcomes (three cognitive-linguistic and two social-behavioral outcomes), for which they calculated environmental susceptibility scores for each child, based on the degree to which the child influenced the regression’s slope. Based on these 40 scores, they created two main susceptibility scores, for family and child-care effects, and found that even though susceptibility to family effects and susceptibility to child-care effects showed significant correlations (indicating some domain generality), these correlations were small in magnitude, making the authors conclude that domain specificity seems to be more reflective of the nature of environmental susceptibility.
This novel method (Belsky et al., Reference Belsky, Zhang and Sayler2021; Sayler et al., Reference Sayler, Zhang, Steinberg and Belsky2022; Zhang et al., Reference Zhang, Widaman and Belsky2021, Reference Zhang, Schlomer, Ellis and Belsky2022) significantly contributed to advancing our understanding regarding environmental susceptibility. However, it enabled to estimate susceptibility to each environmental context separately, only later to be aggregated into one or more susceptibility scores. Recently, von Stumm and D’Apice (Reference von Stumm and D’Apice2021) discussed the importance of an intricate mapping of environmental factors that might influence psychological differences. They suggested that just like genetic contributions to psychological differences reflect thousands of DNA variants with small effect sizes, development is influenced by many environmental factors with small effect sizes. This notion is similar to the claim by Boardman and colleagues (Reference Boardman, Daw and Freese2013), that environmental effects should be considered through a multilevel, multidomain and longitudinal approach, and not as independent from each other. Therefore, to reflect the complexity of environmental exposures, it is important to simultaneously examine multiple environmental exposures and outcomes. To this end we tested the patterns of associations between multiple, and different, environmental exposures, and developmental outcomes.
As the domain specificity question of environmental susceptibility is related to the dimensionality question of environmental susceptibility (i.e., unidimensional or multidimensional), we chose an analytical approach that directly tests the dimensionality of environmental susceptibility. To this end, our second aim was to examine whether a space representing multiple associations between varied environmental and outcome measures (i.e., an environmental susceptibility space) is unidimensional or multidimensional. Based on the recent works reviewed above supporting domain specificity, we hypothesized that the environmental susceptibility space would demonstrate multidimensionality.
Identifying susceptibility based on observed associations between children’s environmental exposures and developmental outcomes allows us to infer children’s environmental susceptibility in a data-driven approach instead of using an a-priori categorization of them based on susceptibility markers, as has typically been studied in the environmental susceptibility literature (recent exceptions were made by Belsky’s team: Belsky et al., Reference Belsky, Zhang and Sayler2021; Sayler et al., Reference Sayler, Zhang, Steinberg and Belsky2022; Zhang et al., Reference Zhang, Widaman and Belsky2021, Reference Zhang, Schlomer, Ellis and Belsky2022; and by Markovitch & Knafo-Noam, Reference Markovitch and Knafo-Noam2021). Using a direct approach to study environmental susceptibility is especially suitable for studying questions of domain specificity, as it avoids the selection of limited exposure and outcome measures, and the inherent assumptions of susceptibility categories or a unidimensional continuum. Thus, we chose a different, more holistic but still direct, analytical approach to study environmental susceptibility, as described below.
Genetic contributions to individual differences in environmental susceptibility
Ever since research on environmental susceptibility has begun, much attention has been given to the genetic contributions underlying it (for a review see Zhang & Belsky, Reference Zhang and Belsky2022). Much of the research has focused on the moderating effects of candidate genes on environmental exposures, both in correlational (for meta-analyses see Bakermans-Kranenburg & van IJzendoorn, Reference Bakermans-Kranenburg and van IJzendoorn2011; van IJzendoorn et al., Reference van IJzendoorn, Belsky and Bakermans-Kranenburg2012) and observational studies (for a meta-analysis, see van IJzendoorn & Bakermans-Kranenburg, Reference van IJzendoorn and Bakermans-Kranenburg2015). Due to different limitations, more complex approaches to study the role of genetic factors in environmental susceptibility were developed in later stages (see Zhang & Belsky, Reference Zhang and Belsky2022), namely, composite genetic scores (e.g., Zhang et al., Reference Zhang, Widaman and Belsky2021) and polygenic scores based on genome-wide association studies (GWAS; Keers et al., Reference Keers, Coleman, Lester, Plomin and Eley2016). Genetic moderation effects were generally found across all approaches. However, one of the most common approaches to study genetic effects on psychological constructs has almost never been used in the context of environmental susceptibility: twin designs. The comparison between monozygotic twins who share 100% of their genetic makeup and dizygotic twins who only share approximately 50% of their genetic makeup enables us to estimate genetic contributions to the variation of different phenotypes. To the best of our knowledge, only two studies to date have employed a twin design to test genetic contributions to environmental susceptibility. Assary and colleagues (Reference Assary, Zavos, Krapohl, Keers and Pluess2020) have measured environmental susceptibility as sensory-processing sensitivity and found that 47% of the variation can be explained by genetic effects. Markovitch and Knafo-Noam (Reference Markovitch and Knafo-Noam2021) have measured environmental susceptibility using phenotypic-domain-specific measures, and found that 66% and 36% of the variation in phenotypic susceptibility to parental and peer influences, respectively, can be explained by genetic effects. In the current study we sought to further understand the degree to which genetic factors contribute to environmental susceptibility by employing a twin design.
Associations of environmental susceptibility with temperament
In the current study we also seek to partially characterize the children showing different patterns of susceptibility, namely their temperament traits. We focus on temperament as defined by Buss and Plomin (Reference Buss and Plomin2014), i.e., a set of biologically based psychological traits that appear already in early childhood. Using this approach, four temperament dimensions are typically described (largely overlapping with other temperament approaches, Zentner & Bates, Reference Zentner and Bates2008): emotionality, activity, sociability and shyness (Buss & Plomin, Reference Buss and Plomin1984). Emotionality refers to the tendency and degree of emotional reactions. Activity refers to energy output level. Sociability refers to the preference and energy given from being among others versus being alone. Shyness refers to the easiness and tendency to befriend others.
The benefits of examining the associations between temperament and the environmental susceptibility space are twofold. First, some temperament traits were previously described as susceptibility markers, that is, they moderated associations between specific environmental exposures and developmental outcomes. A meta-analysis on differential susceptibility to parenting effects depending on temperament found that difficult temperament, which is a composite of different temperamental traits, moderated parenting effects across different samples, environmental variables, and outcome measures (Slagt et al., Reference Slagt, Dubas, Deković and van Aken2016). When testing specific temperament traits, results were mixed. Negative emotionality, which corresponds to the emotionality temperamental dimension mentioned, was found to moderate parenting effects, especially when measured in younger ages. In contrast, surgency (which relates to the activity, sociability, and shyness dimensions) was not found to consistently moderate the effects of parenting. Therefore, it will be interesting to see the relations between the previously studied a priori environmental susceptibility markers (i.e., negative emotionality), and the directly assessed environmental susceptibility patterns which are based on multiple environmental exposures and outcomes.
Furthermore, even though high negative emotionality was typically associated with environmental susceptibility (Belsky & Pluess, Reference Belsky and Pluess2009, Reference Belsky and Pluess2013; Slagt et al., Reference Slagt, Dubas, Deković and van Aken2016), there is also some evidence to the contrary. Such evidence shows either that children low on negative emotionality are those showing environmental susceptibility (e.g., Bush et al., Reference Bush, Lengua and Colder2010; Du Rocher Schudlich et al., Reference Du Rocher Schudlich, White, Fleischhauer and Fitzgerald2011), or that both children with high, and low, negative emotionality show environmental susceptibility but in different ways (the associations between environmental exposure and outcome are in opposite directions; Lengua, Reference Lengua2008; Markovitch et al., Reference Markovitch, Kirkpatrick and Knafo-Noam2021). Therefore, studying the associations between the directly assessed environmental susceptibility patterns and a predefined susceptibility marker (i.e., negative emotionality) is even more important.
In addition, previous work has demonstrated the advantages of examining temperament profiles, instead of traits, when studying environmental susceptibility (Moran et al., Reference Moran, Lengua, Zalewski, Ruberry, Klein, Thompson and Kiff2017). Thus, the second benefit of testing the associations between temperament and environmental susceptibility patterns is that it will enable us to characterize the patterns based on temperament composition, instead of on individual traits. As children are not characterized by independent characteristics but rather by intertwined traits and behaviors, such a composite approach will probably be a more accurate representation of children’s personality as it relates to environmental susceptibility.
The present study
The present study aimed to extend and hopefully advance recent works (Belsky et al., Reference Belsky, Zhang and Sayler2021; Markovitch et al., Reference Markovitch, Kirkpatrick and Knafo-Noam2021; Markovitch & Knafo-Noam, Reference Markovitch and Knafo-Noam2021; Sayler et al., Reference Sayler, Zhang, Steinberg and Belsky2022; Zhang et al., Reference Zhang, Widaman and Belsky2021, Reference Zhang, Schlomer, Ellis and Belsky2022), each trying to empirically test some of the complexities of environmental susceptibility, together creating conceptual replications to theoretical ideas (Crandall & Sherman, Reference Crandall and Sherman2016). Specifically, we used novel data-driven approaches to investigate four main questions as a ‘proof-of-principle’: (1) Is environmental susceptibility a continuous or categorical construct? (2) Is environmental susceptibility a unidimensional trait (i.e., domain general), or a multidimensional system (i.e., domain specific)? (3) Are there genetic contributions to individual differences in environmental susceptibility? (4) What are the associations between environmental susceptibility patterns and temperament characteristics? We used child- and mother-report data from a sample of preadolescent 11-year-old twins (N = 1,507), on a wide variety of different environmental exposures and developmental outcomes. The environmental measures assessed parenting, as well as relationships with parents, peers, and twins (overall, 18 environmental measures), while the outcome measures included empathy, prosocial behavior, aggression, and self-esteem (overall, 10 outcome measures). Preadolescence might be an especially good time to examine the effects of various social domains, as both parents and peers have important roles in the preadolescent’s lives (Smetana et al., Reference Smetana, Campione-Barr and Metzger2006).
As a preliminary step, we aimed to create a more parsimonious and stable description of our environmental and outcome measures, in the form of latent factors, due to both methodological considerations (see Data Analysis section) and theoretical considerations (extending the work of Belsky’s team, who also used factor analyses methods for similar reasons; Sayler et al., Reference Sayler, Zhang, Steinberg and Belsky2022; Zhang et al., Reference Zhang, Widaman and Belsky2021). First, in some cases, we had multiple measures for the same structures (for example, reports on empathy from both children and mothers). Second, our environmental measures tapped distinct environmental sources (mother, father, peers), which we wanted to properly separate as this closely relates to one of our main questions of domain generality versus domain specificity. Lastly, our environmental measures related to either positive, or negative, aspects of different environmental sources. The distinction between positive and negative environmental exposures is especially relevant in the context of environmental susceptibility, where different models under the environmental susceptibility meta-framework describe different effects of positive versus negative environments (Pluess, Reference Pluess2015). Under the diathesis-stress model, certain individuals will be more susceptible to negative environmental effects. Under the vantage sensitivity model, certain individuals will be more susceptible to positive environmental effects. Finally, under the differential susceptibility model, certain individuals will be more susceptible to both positive and negative environmental effects. Therefore, the role of positive versus negative environments in environmental susceptibility guided us as we built more parsimonious measures of the environmental variables.
To examine our first question, whether environmental susceptibility is categorical or continuous, we used clustering methods and tested whether a solution of two, or more, clusters fits the data. Second, to identify whether environmental susceptibility is unidimensional or multidimensional we describe the entire data space (i.e., all environmental and outcome measures) by their linear combination, and test whether one dimension sufficiently represents the data, or rather there is a need for multiple dimensions. We then aimed to characterize the data space, especially whether it provides information about children’s environmental susceptibility. To this end, we characterized children based on their positions in the space, that is, we divided the space into different regions, and asked whether children located in different regions demonstrated different patterns of environment–outcome (E–O) associations, i.e., environmental susceptibility. Third, to examine whether genetic effects have a role in environmental susceptibility (as measured here by the environmental susceptibility space), we compared the distances between monozygotic (MZ) and dizygotic (DZ) twins. As markers of environmental susceptibility (i.e., temperament and sensory processing sensitivity) were found to be partially heritable (Assary et al., Reference Assary, Zavos, Krapohl, Keers and Pluess2020; Polderman et al., Reference Polderman, Benyamin, De Leeuw, Sullivan, Van Bochoven, Visscher and Posthuma2015), we expected that MZ twins would be closer to each other within the data space than DZ twins, due to their greater genetic resemblance. Finally, we examined the associations between children’s positions within the space and their temperament. We have done this to test the relation between our directly assessed environmental susceptibility patterns and previously found environmental susceptibility markers (i.e., negative emotionality), as well as to characterize the temperament structure of different environmental susceptibility patterns.
Method
Participants
Families participated as part of the age 11 measurement of a large longitudinal twin study on genetic and environmental influences on social development (the Longitudinal Israeli Study of Twins; Vertsberger et al., Reference Vertsberger, Abramson and Knafo-Noam2019). Children and their mothers from 777 Hebrew-speaking families have participated. Self-report data were excluded for 29 children, and mother-report data were excluded for additional seven children, mainly due to identity mix-ups and children appearing to have received help from a family member when responding to the survey. After exclusions the sample included 1,507 individual children. We further excluded children with missing data for any of the computed latent factors (42 children). This resulted in a final sample of 1,465 children from 750 families: 299 monozygotic (MZ) twins (from 154 families, 20%), 603 dizygotic same-sex (DZS) twins (from 308 families, 41%), 543 dizygotic other-sex (DZO) twins (from 278 families, 37%) and 20 twins without available zygosity data. Children were 51% females, aged 10.80–12.60 (M = 11.20, SD = 0.20), and mothers were 31–65 years old (M = 43.10, SD = 5.37). The sample was demographically similar to the Jewish population in Israel (see details in Vertsberger et al., Reference Vertsberger, Abramson and Knafo-Noam2019).
Procedure
Participants completed the survey from their homes, mostly online. Families who did not have access to a computer or an internet connection or preferred a paper-and-pen version for other reasons received the questionnaires via postal service and returned with completion (20% of families). Families were offered 3–4 movie or museum tickets for their participation. This study was approved by the Ethics committee of the Hebrew University of Jerusalem. Parents provided informed consent for their children to participate, and the children provided assent.
Measures
For the purposes of this investigation, we looked for any social–environmental and psychosocial outcome measures available in our data, as well as temperament. We included data reported by the children and by their mothers and excluded data from sources that significantly reduced our sample size due to missing cases (see details in Table 1’s note). From the available measures, we only included measures that had sufficient reliability (McDonalds Omega above .60; Kelley & Pornprasertmanit, Reference Kelley and Pornprasertmanit2016). This concluded in 18 measures of children’s environment, and 10 measures of children’s developmental outcomes. A full list of the available measures’ descriptions (i.e., questionnaire sources, scale ranges, example items), as well as their reliability and whether they were included in the analysis, is available in Table 1.
Table 1. Details on measures included and excluded from the analysis

PEQ = Parent Environment Questionnaire (Elkins et al., Reference Elkins, McGue and Iacono1997). PPQ = Parenting Practices Questionnaire (Robinson et al., Reference Robinson, Mandleco, Olsen and Hart1995). SDQ = Strengths and Difficulties Questionnaire (Goodman, Reference Goodman1997). MSPSS = Multidimensional Scale of Perceived Social Support (Zimet et al., Reference Zimet, Dahlem, Zimet and Farley1988). BES = Basic Empathy Scale Questionnaire (Jolliffe & Farrington, Reference Jolliffe and Farrington2006). EQ-SQ = Empathy Quotient-Systemizing Quotient (Auyeung et al., Reference Auyeung, Wheelwright, Allison, Atkinson, Samarawickrema and Baron-Cohen2009). IRI = Interpersonal Reactivity Index (Davis, Reference Davis1983). PBQ = Prosocial Behavior Questionnaire (Weir & Duveen, Reference Weir and Duveen1981). ITSEA = Infant–Toddler Social and Emotional Assessment (Carter et al., Reference Carter, Briggs-Gowan, Jones and Little2003). RSE = Rosenberg Self-Esteem Scale (Rosenberg, Reference Rosenberg1965). EAS = Emotionality, Activity, and Sociability (Buss & Plomin, Reference Buss and Plomin1984). Detailed are all self-report and mother-report measures available for our sample. For some children, we also had father-report measures and school measures from national reports. However, these sources had a large amount of missing data, significantly reducing our available sample if included. Therefore, we did not include any father reports or school measures. We used McDonalds Omega as the reliability criterion according to the recommendations by Kelley and Pornprasertmanit (Reference Kelley and Pornprasertmanit2016). Measures were excluded from analyses if their Omega was below .60. For most measures we calculated categorical Omega, except for support from friends and twins, which were calculated as hierarchical Omegas. Omega was calculated using the MBESS package (Kelley, Reference Kelley2020).
Environment measures
Parental environment
Children reported on characteristics of the relationship with their mothers and fathers separately (Elkins et al., Reference Elkins, McGue and Iacono1997), both positive characteristics (parental involvement, child’s regard for parent and child’s perceived regard of parent towards them) and negative characteristics (conflict with parents). In addition, mothers reported on their parenting practices, both positive practices (warmth, democratic participation and reasoning) and negative practices (corporal punishment, verbal hostility, love withdrawal, and punitive strategies; Knafo & Schwartz, Reference Knafo and Schwartz2003; Robinson et al., Reference Robinson, Mandleco, Olsen and Hart1995).
Peer environment
Children reported on feelings of support by their friends (positive; Zimet et al., Reference Zimet, Dahlem, Zimet and Farley1988), and mothers reported on peer problems (negative; Goodman, Reference Goodman1997).
Twin environment
Only a positive aspect of the twin environment was available, and was measured by children-reported feelings of support by their twins (Zimet et al., Reference Zimet, Dahlem, Zimet and Farley1988).
Outcome measures
Empathy
Empathy measures included children’s reports on their cognitive and emotional empathy as well as empathic concern (Davis, Reference Davis1983; Jolliffe & Farrington, Reference Jolliffe and Farrington2006), and mothers’ reports on their children’s emotional empathy (Auyeung et al., Reference Auyeung, Wheelwright, Allison, Atkinson, Samarawickrema and Baron-Cohen2009).
Prosocial behavior
Mothers reported on their children’s prosocial behavior using two different measures (Goodman, Reference Goodman1997; Weir & Duveen, Reference Weir and Duveen1981), and children who participated online played a decision-making computer game in which they could either choose prosocial or non-prosocial options (see Supplementary Note 1 for description; Rum et al., Reference Rum, Genzer, Markovitch, Jenkins, Perry and Knafo-Noam2022).
Self-esteem
Children reported on their own feelings of self-esteem (Rosenberg, Reference Rosenberg1965).
Aggression
Aggression was measured by mother reports on conduct problems (Goodman, Reference Goodman1997) and general and peer aggression (Carter et al., Reference Carter, Briggs-Gowan, Jones and Little2003).
Temperament
Mothers ranked children’s temperament traits of negative emotionality, shyness, sociability, and activity (Buss & Plomin, Reference Buss and Plomin1984).
Zygosity
Zygosity was mostly assessed using DNA data (available for 51% of the same-sex twins) and a parent questionnaire regarding physical similarity (see Vertsberger et al., Reference Vertsberger, Abramson and Knafo-Noam2019), the questionnaire has shown 95% agreement with DNA measures (Price et al., Reference Price, Freeman, Craig, Petrill, Ebersole and Plomin2000).
Data analysis
All statistical analyses were done using RStudio (RStudio Team, 2021) based on R 4.1.0 (R Core Team, 2021) (see Supplementary Note 2 for a full list of packages used). The analysis included six steps (see Figure 1 for a schematic overview). The first step was a preliminary step aimed to achieve a more parsimonious structure of the environmental exposures and developmental outcome data. The associations among these variables are the basis for testing our main research questions. To this end, we estimated a measurement model using confirmatory factor analysis (CFA) with full information maximum likelihood estimation. Minimizing our 28 observed variables of environment and outcome into latent, more general factors, enabled us to use more stable and reliable measures (as they are based on several measures supposedly measuring the same psychological construct), as well as not to lose data due to missing values. Some of the main methods we used in this study do not allow missing values, and so creating factor scores on all available data enabled less deletion of cases due to missingness. We used a confirmatory and not an exploratory approach as we needed to model latent factors relating to the source of reporting (child/mother) as well as factors relating to the content of the measures. As the measures were also distinguishable based on clear characteristics (e.g., domains of environmental sources and developmental outcomes), CFA was suitable for the purposes of our analysis. This preliminary step set the stage for the next steps of the analysis.

Figure 1. Analytic steps overview. CFA = confirmatory factor analysis. t-SNE = t-distributed stochastic neighbor embedding; PCA = principal component analysis; MZ = monozygotic twins; DZ-s = dizygotic same-sex twins; DZ-O = dizygotic other-sex twins; E–O associations = associations between environmental exposures and developmental outcomes.
Is environmental susceptibility categorical or continuous?
In the second step, we aimed to understand whether children could be classified into different clusters of environmental susceptibility, and whether it is two clusters (i.e., susceptible, and not susceptible), or more (e.g., low, medium, and high susceptibility). We tested whether characterizing children by the combinations of their environmental and outcome data would reveal a cluster structure. We used the k-means algorithm, which classifies observations into k (defined by the user) clusters (groups) such that observations within a cluster are as close to each other as possible compared to observations from different clusters, that are as distinct as possible. Clusters are represented by their center, which is the mean of observations within the cluster. To test whether the environmental susceptibility data can be classified into categories we examined 2–6 cluster solutions to see if any would fit the data. To visualize the classification into clusters, we used the t-Distributed Stochastic Neighbor Embedding (t-SNE) method (van der Maaten, Reference van der Maaten2014), which enables us to find a faithful representation of high-dimensional data on a 2-dimensional plane, while preserving the original structure, enabling the preservation of categorization into clusters. The results of the k-means algorithm (which was done on the full data) were then mapped onto the 2-dimensional plane created by t-SNE.
Is environmental susceptibility a unidimensional trait or a multidimensional system?
The third step of the analysis aimed to test the dimensionality of environmental susceptibility. If environmental susceptibility is not separated into clear groups of susceptibility, it means that children are spread on a continuous spectrum of susceptibility, but this spectrum can either be unidimensional (i.e., one continuous trait) or multidimensional, creating a spectrum of susceptibility characteristics. To test this, we need to examine the structure of our data and represent it on a coordinate system. To this end, we used principal component analysis (PCA), which is a dimensional reduction technique, that identifies the directions in the data space which explain the most variance and represents most of the data variation on fewer principal components. PCA is computed based on the covariances among all variables, in our case, environmental and outcome variables. Therefore, this space simultaneously represents the different E–O associations (i.e., environmental susceptibility), enabling us to investigate the dimensionality and characterization of this space. Once the data is represented on fewer components using PCA (the third step of the analysis), we need to validate it in two ways: first, confirming that the representation of children within the reduced space still has some validity, based on expected differences between MZ and DZ twins (done in the fourth step of the analysis), and second, confirming that we can draw conclusions regarding environmental susceptibility from this space, which requires to check that children in different regions of the space demonstrate varied E–O associations (done as part of the sixth step of the analysis).
Genetic contributions to individual differences in environmental susceptibility
The aim of the fourth step of the analysis was twofold: (1) to evaluate whether there are genetic contributions to the variation in the environmental susceptibility space and (2) to validate the reduced space based on expected differences between MZ and DZ twins. The original data of the children is comprised from phenotypes and environmental measures, which are both expected to be influenced by genetic effects: our outcome measures such as empathy and aggression have repeatedly shown to be partially accounted by genetic factors (Polderman et al., Reference Polderman, Benyamin, De Leeuw, Sullivan, Van Bochoven, Visscher and Posthuma2015), and genetic factors are also often contributing to environmental measures, which in fact represent the effects of individuals’ heritable traits on the environment they receive (i.e., evocative gene-environment correlations; Klahr & Burt, Reference Klahr and Burt2014; Knafo & Jaffee, Reference Knafo and Jaffee2013). Therefore, we can expect that when representing children based on a composite of all these variables, MZ twins, who share 100% of their genetic makeup, will be more similar to each other than DZ twins, who only share 50% of their genetic makeup. Thus, we will expect to see that MZ twins will be closer to each other in the reduced space than DZ twins. In other words, if MZ twins will indeed prove to be closer to each other than DZ twins, this will indicate that there are some genetic contributions to the position within the environmental susceptibility space we constructed. To this end, in the fourth step we compared the Euclidean distances between the positions of twins within the space.
Characterizing different environmental susceptibility patterns
To characterize any psychological dimension, there is a need to examine its extremes. Thus, our next aim was to characterize susceptibility patterns of different children in different regions of the envelope of the data space, which was done by two separate steps. First (as the fifth step of the general analysis), we focused on the points that constitute the envelope of the data (the convex hull). In trying to identify which points on the envelope go together and represent different regions, we examined the associations between the envelope points and temperament traits (which were not included in the creation of the environmental susceptibility space) and searched for common patterns. That is, in the fifth step we tested whether the distance of children from each point on the envelope is correlated with each of the four temperamental traits (and adjusted significance levels for multiple comparisons according to the Benjamini-Hochberg (Reference Benjamini and Hochberg1995) procedure). We coded each envelope point based on its significant positive or negative correlations with each temperament trait and used this coding to identify poles of the space, which were the basis for the regions of interest.
Finally (as the sixth step of the general analysis), we tried to characterize the environmental susceptibility patterns of children in the identified regions of interest. For each region with the same temperament associations, we took the 10% of children closest to any of the region’s envelope points. Children who were positioned close to more than one region were dropped from all groups, creating different size groups. To compare group sizes, we reduced the other groups to include the same number of children as the smallest group. In the sixth step, we then calculated the correlations between all environmental latent factors and all developmental outcome latent factors separately for each group. Then, for each group, we looked at the E–O associations that were significant, implying that these children tend to show susceptibility to these contexts (based both on a parametric tests and multiple comparisons correction, see the Results section for more details).
Results
Preliminary analysis: confirmatory factor analysis
We estimated two measurement models using CFA, one containing the environmental measures and the other containing the outcome measures. Full details about the models tested and their model fit indices can be found in Supplementary Table S1. The final CFA models and their fit indices are presented in Figure 2. The environmental model yielded seven factors: (1) Negative maternal environment, (2) Negative paternal environment, (3) Positive maternal environment, (4) Positive paternal environment, (5) Negative peer environment, (6) Positive peer environment, and (7) Positive twin environment. We did not have any measurements for negative twin environment. The developmental outcome model yielded four factors: (1) Cognitive empathy, (2) Interpersonal concern, (3) Aggression, and (4) Self-esteem. We computed children’s factor scores based on the CFA models, which also modeled the source of reporting (self- or mother-report) and relevant correlations between factors or measures (Supplementary Table S2 presents the factor scores’ correlations). Factor scores were then standardized to reduce effects of variance differences. Sex differences of small effect sizes were found in most factor scores (except for positive and negative paternal environment, positive peer environment and self-esteem; see full results in Supplementary Table S3).
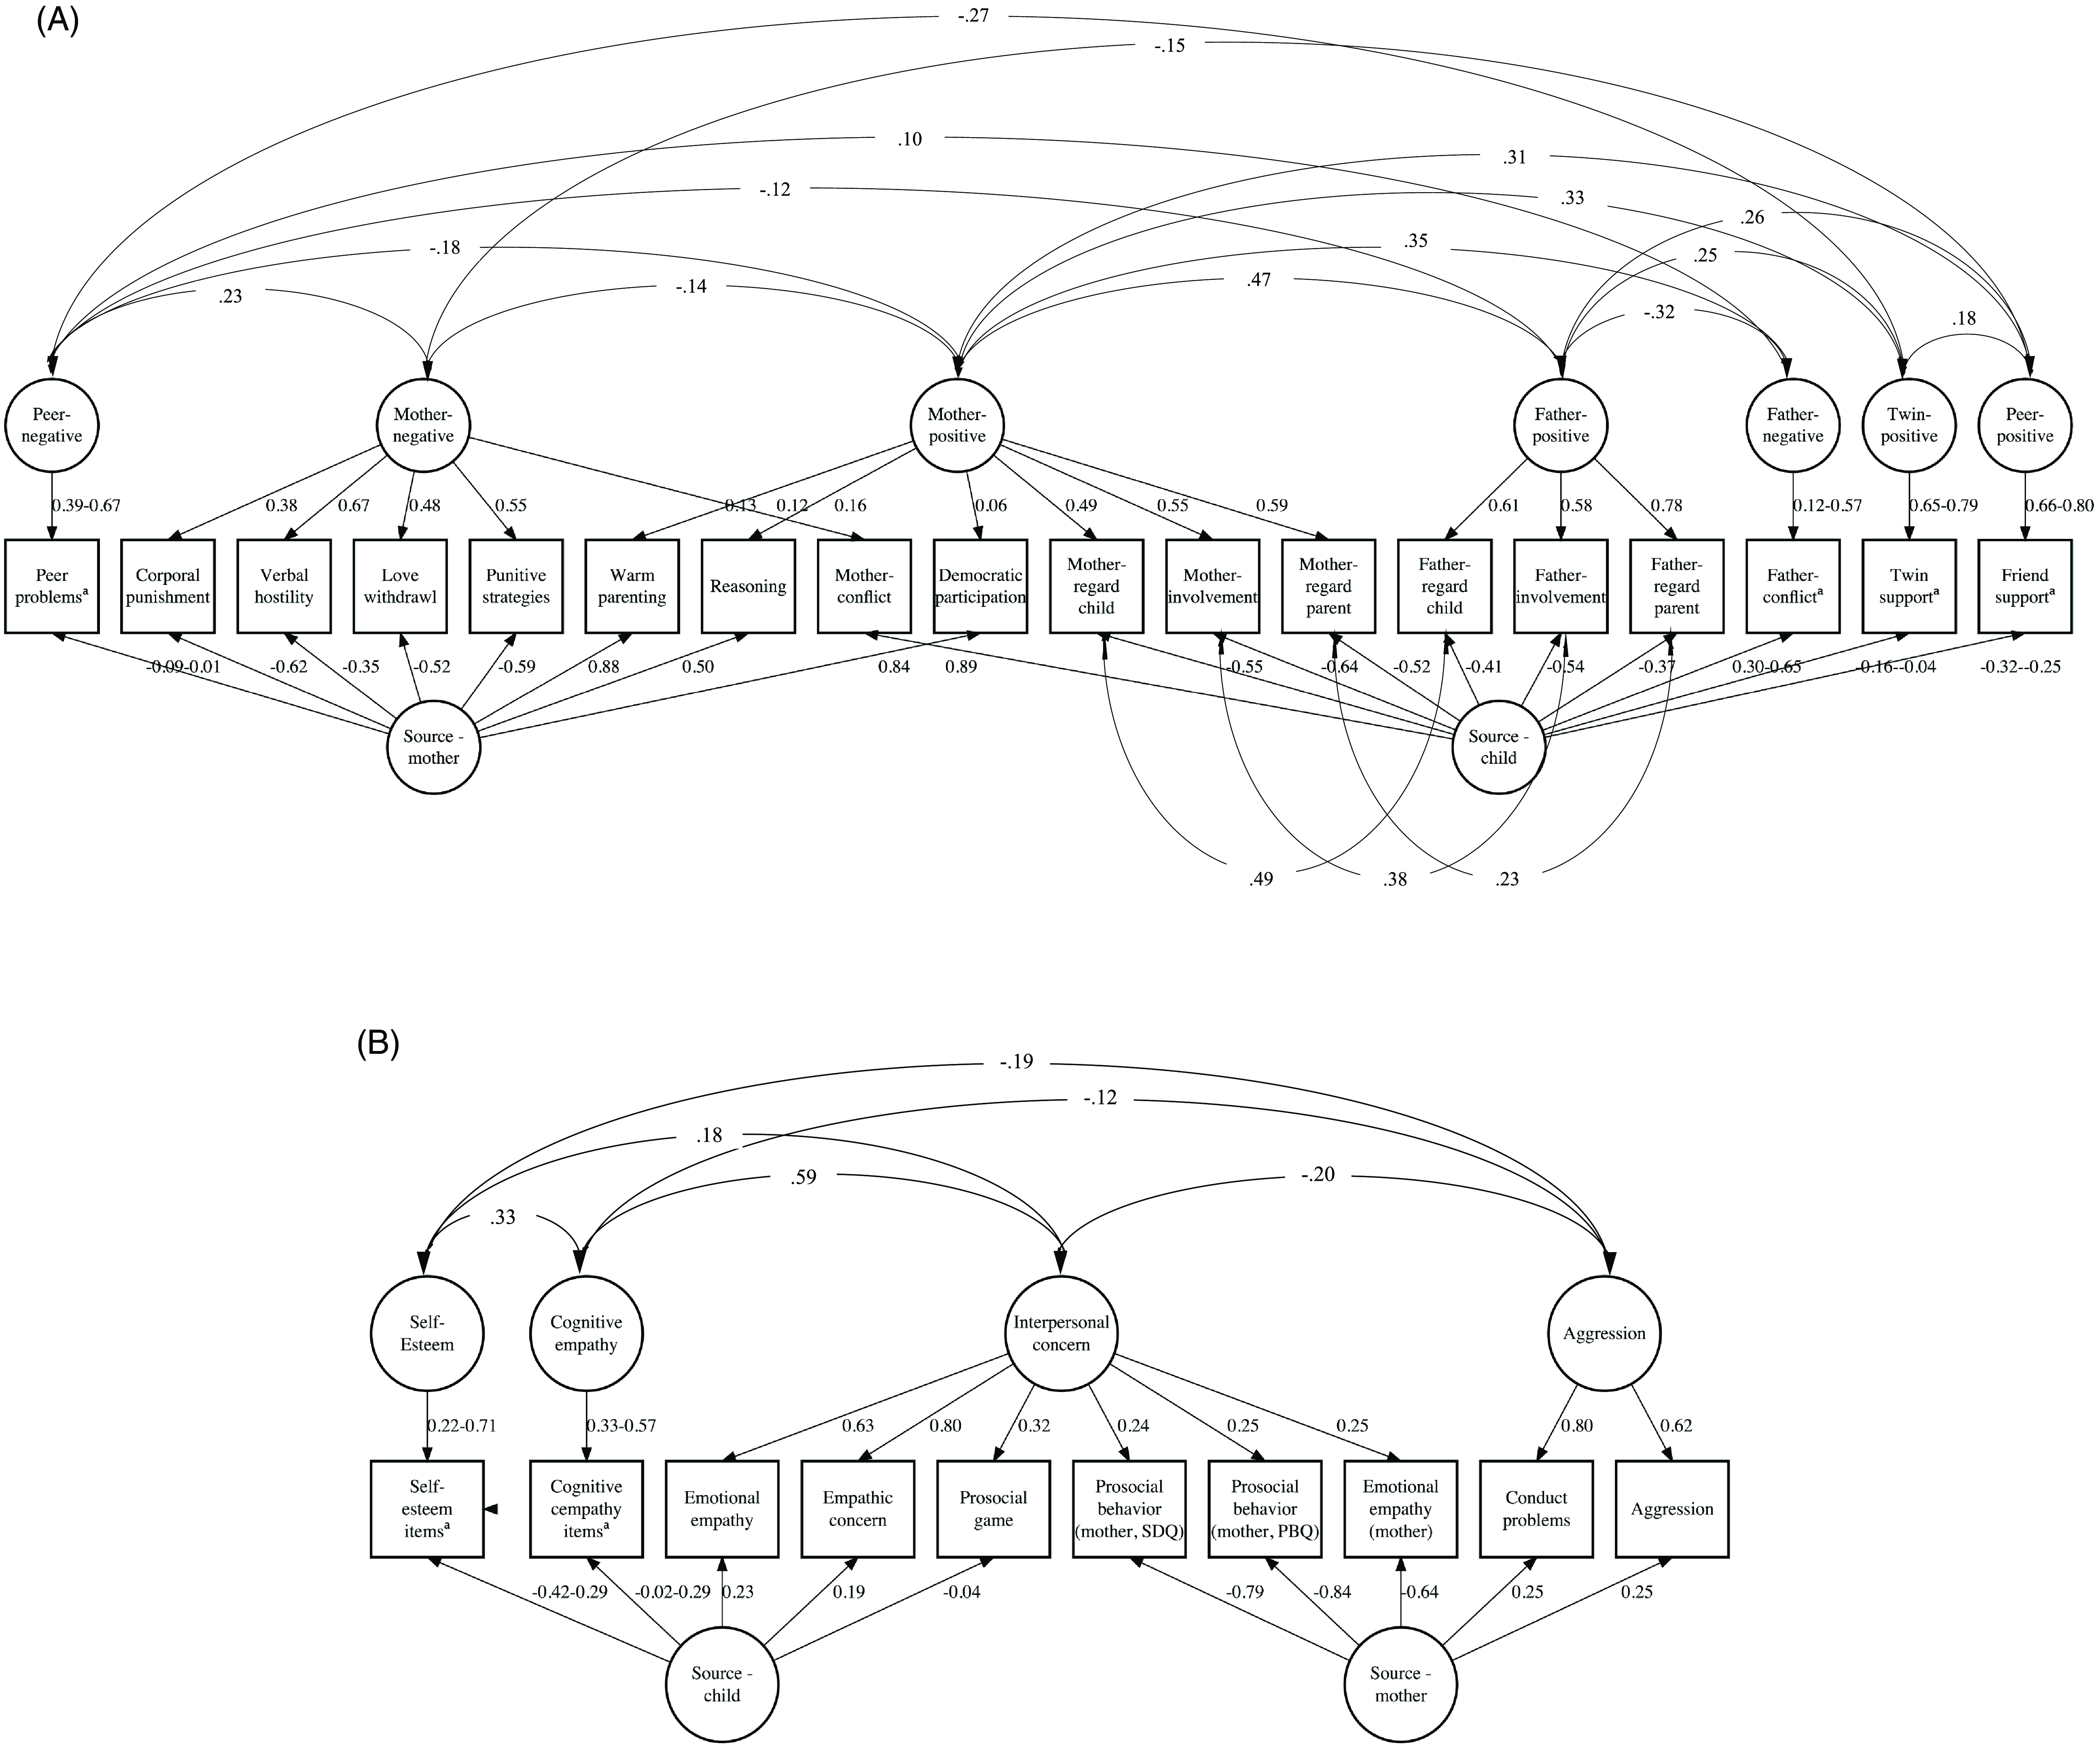
Figure 2. CFA final models results. Figure 1a – model for the environmental variables (χ2(507) = 1626.679, CFI = .941, RMSEA [90% CI] = .039 [.037, .041], SRMR = .047; see details regarding model choice in Supplementary Table S1). Figure 1b – model for the developmental outcome variables (χ2(291) = 715.167, CFI = .942, RMSEA [90% CI] = .031 [.028, .034], SRMR = .039; see details regarding model choice in Supplementary Table S1). All estimates are the standardized coefficients. Most of the observed variables represent mean scores of the relevant scales. In cases where the observed variable is denoted with “a”, only one measure (i.e., one mean score) was loaded on a latent factor. To deal with identification issues, the individual items of these scales were modeled to load on the latent factor instead of mean scores. In these cases, the presented estimates are the range of item loadings. SDQ = Strengths and Difficulties Questionnaire (Goodman, Reference Goodman1997). PBQ = Prosocial Behavior Questionnaire (Weir & Duveen, Reference Weir and Duveen1981).
Is environmental susceptibility categorical or continuous?
The visualization of the k-means algorithm results for 2–6 clusters can be seen in Figure 3. The figure clearly shows that there is no clear separation between children in different groups and so children who are very close to each other can mistakenly be classified into different groups. To test whether the classification to clusters describes the data appropriately, we used the average silhouette method, which measures the quality of clustering. A higher average silhouette width indicates good clustering, while a silhouette value of below 0.25 indicates that no substantial structure has been found (Kaufman & Rousseeuw, Reference Kaufman and Rousseeuw2009). While the silhouette coefficient was the highest when testing a 2-cluster solution (0.18), it was still lower than the threshold (< 0.25; see Figure 3). This indicates that the data cannot be separated into two, three, or more (up to six) types of susceptibility (as measured by the E–O associations), suggesting a continuum of environmental susceptibility.

Figure 3. K-means results for testing 2-6 clusters. k = number of clusters tested; SC = Silhouette coefficient. Dimensionality reduction to a 2-dimensional plane using t-SNE was done with perplexity = 50.
Is environmental susceptibility a unidimensional or multidimensional trait?
We examined the dimensionality of the space by checking the cumulative percentage of variance explained by each of the PCA’s principal components (see Supplementary Figure S1). If the environmental susceptibility data was unidimensional, then most of its variance would be represented by one component. However, the first component found in the PCA only explained less than third (27.7%) of the variance, suggesting that environmental susceptibility is more complex, and is not well captured by a one-axis continuum. We note that as the sample of our environmental exposures and developmental outcomes is not exhaustive, we cannot determine the exact dimensionality of such environmental susceptibility space, only that it is probably better captured by several dimensions. Further support for the notion that the data is not well represented by one dimension was found by applying Horn’s parallel analysis method (Horn, Reference Horn1965) on our data, which suggested that a good representation of the data is achieved at four dimensions. However, we chose to reduce the space to a three-dimensional space due to visualization and interpretation advantages. Projecting the children’s data on a new three-axis space explained more than half (54%) of the variation.
Genetic contributions to individual differences in environmental susceptibility
When examining the distances between twins within the reduced space we found significant mean differences in distances according to zygosity (F (2, 702) = 8.44, p < .001; see supplementary Figure S2), demonstrating the validity of the space, and suggesting some heritability of environmental susceptibility (further discussed in the Discussion). MZ twins were significantly closer to each other (M MZ = 1.89, SD MZ = 1.25) than DZ twins (M DZS = 2.40, SD DZS = 1.46; M DZO = 2.47, SD DZO = 1.47; ps < .001), while DZS and DZO twins did not show significant differences in mean distances (p = .530).
Characterizing different environmental susceptibility patterns
To find regions of interest, we started by focusing on the points that constitute the envelope of the data (the convex hull), which include 34 unique points in our dataset (Figure 4a). We then coded each envelope point based on its significant positive or negative correlations with temperament (see full correlations in Supplementary Table S4). We find that close-by points on the envelope show similar temperament associations, even though the children’s data originally used to create the space did not contain any information about temperament (Figure 4b). When examining the patterns of temperament associations, we visually identified four regions, created by multiple envelope points of the same temperament associations pattern in opposite directions of the space, which also demonstrate opposite temperament profiles. In the horizontal axis, as children are closer to the left region they tend to be with higher negative emotionality and shyness but with lower activity and sociability levels (Figure 4c). In contrast, as children are closer to the right region, they tend to be more active and social, but with lower levels of negative emotionality and shyness. The regions of the vertical axis also show opposite patterns regarding negative emotionality and activity, with the children closer to the bottom being high on negative emotionality and activity and low on shyness, and children closer to the top being low on negative emotionality and activity. Thus, the extreme regions of the space were identified using the temperament profiles, and represented four different groups of children (Group 1 = higher negative emotionality and activity, lower shyness; Group 2 = higher negative emotionality and shyness, lower sociability, and activity; Group 3 = lower negative emotionality and shyness and higher sociability and activity; Group 4 = lower negative emotionality and activity). After dropping children that appeared in more than one group and equating group sizes (see Data Analysis), all groups included 104 children.

Figure 4. The envelope of the environmental susceptibility space representing children based on their E–O associations. A) The unique points on the envelope that assemble the convex hull (in color). B) Points on the envelope are color coded according to temperament profile associations. A plus sign means that there is a significant positive correlation between the temperament trait and distance from the point, and a minus sign means that there is a significant negative association between the temperament trait and the distance from the point. Act = activity; Shy = Shyness; Soc = sociability; NE = negative emotionality. C) The clusters of points representing different regions of the data structure, including the observations closest to these regions (N = 104 in each group).
For each group we looked at the significant E–O associations (seven environmental measures and four outcome measures, totaling 28 correlations), implying that these children tend to show susceptibility to these contexts (see Supplementary Table S5 for details and full correlations). We found that different groups demonstrated different environmental susceptibility patterns. Figure 5 presents the E–O associations that were found significant based on permutation analysis (10,000 repetitions). Figure 5 further denotes significance based on corrections for multiple comparisons. However, due to the large number of correlations tested, these corrections resulted only in correlations above .30 being significant. Nonetheless, lower correlations may also be meaningful once considering theoretical associations between environment and development. We therefore also discuss some of the general patterns of results based only on the significance of the permutation analysis, but advise that the specific patterns should be taken with caution and reexamined with a larger sample that is suitable for testing multiple correlations. First, we found that all groups showed susceptibility to at least some contexts but varied in the number of contexts they were susceptible to. Second, we found that the susceptible group differed between different contexts. For example, Group 1 showed a significant association between mother-negative factors and cognitive empathy, but Group 4 showed a significant negative association between mother-positive factors and aggression. Thus, if we would have focused only on one of these contexts, we would probably reach an erroneous conclusion regarding general environmental susceptibility in our sample.

Figure 5. Significant E-O associations for the different groups. The correlations presented are correlations that were found significant based on 10,000 permutations, where we shuffled between children’s environmental variables and outcome variables, but did not shuffle within children’s environmental variables, or within children’s outcome variables (see Supplementary Table S5 for full correlation table). In addition, correlations denoted with ‘a’ were also found significant after corrections for multiple comparisons. Group names represent the temperament profiles of the relevant region. Act = activity; Shy = shyness; Soc = sociability; NE = negative emotionality; + = a positive correlation; − = a negative correlation.
The groups also demonstrated different patterns regarding the breadth of effects they showed susceptibility to. Group 1 showed susceptibility to contexts involving almost all environmental domains and several developmental outcomes, suggesting a more domain-general pattern. On the other hand, Groups 3 and 4 showed susceptibilities to less contexts, with Group 3 showing only limited positive parental effects, and Group 4 showing limited effects mainly on aggression, possibly suggesting a more domain-specific pattern. Group 2 showed a mixed pattern, with effects of both parental and peer sources, but exclusively on positive outcomes, possibly suggesting environmental domain generality and outcome domain specificity (yet note that these correlations did not pass the multiple hypothesis testing correction).
Moreover, our findings show the possible problem with testing environmental susceptibility based on a presumed marker such as temperament. For example, Groups 1 and 2, which were both associated with high negative emotionality, but have a different temperament profile otherwise, showed susceptibility to different contexts. Similarly, Groups 3 and 4, which were both associated with low negative emotionality, and have a different temperament profile otherwise, do not have any common contexts to which they show susceptibility. Interestingly, our findings suggest that the combination of negative emotionality and activity has a role in environmental susceptibility, as no two groups had the same combinations of these two temperamental traits. Figure 6 summarizes the findings regarding the different temperament profiles and domain generality and domain specificity patterns on the multidimensional space. In conclusion, we find preliminary evidence for a multidimensional space of environmental susceptibility (as measured here) where different temperamental profiles show unique susceptibility patterns.

Figure 6. Summary characterization of the environmental susceptibility space. Act = activity; Shy = shyness; Soc = sociability; NE = negative emotionality; + = A positive correlation; − = A negative correlation.
Discussion
The main purpose of the present study was to use a novel empirical approach, relying on a broad array of environmental exposures and developmental outcomes, to advance our understanding of the complexity of environmental susceptibility. We found that the environmental susceptibility space we assessed here, based on multiple E–O associations, is continuous, rather than categorical (Zhang et al., Reference Zhang, Widaman and Belsky2021), and a multidimensional system, rather than a unidimensional trait, showing both domain-general and domain-specific patterns. Using a novel approach, our results join recent papers (Belsky et al., Reference Belsky, Zhang and Sayler2021; Markovitch et al., Reference Markovitch, Kirkpatrick and Knafo-Noam2021; Markovitch & Knafo-Noam, Reference Markovitch and Knafo-Noam2021; Sayler et al., Reference Sayler, Zhang, Steinberg and Belsky2022; Zhang et al., Reference Zhang, Widaman and Belsky2021, Reference Zhang, Schlomer, Ellis and Belsky2022) in empirically addressing the important theoretical questions of continuity and generality of environmental susceptibility, thus presenting a conceptual replication (Crandall & Sherman, Reference Crandall and Sherman2016). We further estimated genetic contributions to environmental susceptibility by comparing MZ and DZ twins, an approach that is rarely used is environmental susceptibility research (Greven et al., Reference Greven, Lionetti, Booth, Aron, Fox, Schendan, Pluess, Bruining, Acevedo, Bijttebier and Homberg2019). We found that MZ twins were closer to each other than DZ twins within the environmental susceptibility space, suggesting genetic contributions. Finally, the different environmental susceptibility patterns we found within our analysis were related to temperament profiles, rather than specific temperament traits.
Such conclusions have importance for the developmental science community, as the question of what makes us who we are is fundamental in developmental science. Even though no one author declared that we should refer to environmental susceptibility as two distinct types of individuals (and previous theoretical papers have even argued for the continuity of environmental susceptibility and discussed its specificity; Belsky et al., Reference Belsky, Bakermans-Kranenburg and van IJzendoorn2007; Belsky, Reference Belsky, Ellis and Bjorklund2005; Belsky & Pluess, Reference Belsky and Pluess2009, Reference Belsky and Pluess2013; Ellis et al., Reference Ellis, Boyce, Belsky, Bakermans-Kranenburg and van IJzendoorn2011), theoretical terms and empirical conclusions regarding environmental susceptibility are often discussed in dichotomic terms (as argued here and in Zhang et al., Reference Zhang, Widaman and Belsky2021). When such writing cumulates, there is a risk that the intricacies discussed as open questions in theoretical papers (e.g., the continuity of environmental susceptibility) will be lost when communicated to students, therapists, and the public. Thus, reframing our language around environmental susceptibility might be important for both research and practice.
Environmental susceptibility as a continuum
Zhang and colleagues (Reference Zhang, Widaman and Belsky2021) examined the continuity of environmental susceptibility using a different age sample than the one in the current investigation, different environmental exposures and outcomes, and a different approach to assess susceptibility. They have tested the modality of environmental susceptibility and found it to have a normal, rather than bimodal, distribution. Here, we chose an approach to specifically test how well a cluster solution fits the data. We have done this by simultaneously taking a combination of environmental exposures and developmental outcomes and applying data-driven cluster approaches to this data. Results revealed that the environmental susceptibility data is not well described by a cluster solution, thus a continuum probably better describes the distribution of the current data. Taken together, these different empirical approaches, applied to different variable samples, on different developmental periods, have supported the hypothesis that environmental susceptibility is probably continuous and not discrete (Belsky, Reference Belsky, Ellis and Bjorklund2005; Ellis et al., Reference Ellis, Boyce, Belsky, Bakermans-Kranenburg and van IJzendoorn2011; Greven et al., Reference Greven, Lionetti, Booth, Aron, Fox, Schendan, Pluess, Bruining, Acevedo, Bijttebier and Homberg2019).
Environmental susceptibility as multidimensional
Even after showing supporting evidence that environmental susceptibility is a continuum, an important question remains: is it a unidimensional continuum, representing one trait where individuals can vary on their degree of susceptibility to many environments and in respect to many outcomes, or is it a multidimensional space, where individuals can be spread across, and show different susceptibility patterns. Our findings suggest that environmental susceptibility is not unidimensional, with individuals varying in their degree of general susceptibility. We found that different children, positioned in different regions of the multidimensional space, showed distinct patterns of E–O associations, suggesting susceptibility to different contexts. Therefore, our findings emphasize the importance of studying multiple contexts within the same sample when trying to draw conclusions regarding general environmental susceptibility, as exploring contexts separately would have led to different conclusions regarding who the susceptible children are.
This question of dimensionality is also closely related to the question of whether environmental susceptibility is more domain-general (i.e., individuals are susceptible to many environments and regarding many outcomes, or not susceptible) or domain-specific (i.e., different individuals will be susceptible to different environmental exposures or regarding different outcomes). Even though the question of domain generality versus domain specificity of environmental susceptibility was raised several times in the past (Belsky & Pluess, Reference Belsky and Pluess2009, Reference Belsky and Pluess2013; Belsky, Reference Belsky, Ellis and Bjorklund2005; Ellis et al., Reference Ellis, Boyce, Belsky, Bakermans-Kranenburg and van IJzendoorn2011), only recently there have been attempts to empirically address this question (Belsky et al., Reference Belsky, Zhang and Sayler2021; Markovitch et al., Reference Markovitch, Kirkpatrick and Knafo-Noam2021; Markovitch & Knafo-Noam, Reference Markovitch and Knafo-Noam2021; Sayler et al., Reference Sayler, Zhang, Steinberg and Belsky2022; Zhang et al., Reference Zhang, Widaman and Belsky2021, Reference Zhang, Schlomer, Ellis and Belsky2022). Interestingly, although all studies have found some signs for domain-general patterns, they also found (perhaps stronger) domain-specific patterns, or as put by Zhang and colleagues (Reference Zhang, Widaman and Belsky2021): “domain specificity may be more the rule than the exception” (p. 11).
Our findings add an interesting perspective to the domain-generality question. First, we did not find a strict domain-general pattern, as no group of children we examined showed susceptibility to all, or even most, contexts, and no group showed no susceptibility at all. Moreover, we found that children differed in the degree of generality versus specificity of the significant E–O associations they demonstrated. Therefore, it might be more accurate to think of domain generality not as a characteristic of environmental susceptibility, but rather as an individual differences’ characteristic.
It is interesting to notice that some E–O associations are in opposite directions than we would have expected. For example, a positive correlation between the mother-negative factor and cognitive empathy in Group 1. Interestingly, the correlation between these two variables for the entire sample is –.03 (see Supplementary Table S2), meaning that other children in the sample probably show the opposite, negative, association. This also seems to be the case for other E–O associations, as exemplified in the association between mother-positive and self-esteem, where mother-positive effects were related to less self-esteem in Group 2, and to more self-esteem in Group 3. This might seem odd at first, but there are previous studies that examined environmental susceptibility in the typical approach (i.e., environmental exposure X susceptibility marker), that found that two groups of children were susceptible to the same context, but in opposite directions (Lengua, Reference Lengua2008; Markovitch et al., Reference Markovitch, Kirkpatrick and Knafo-Noam2021). For example, Lengua (Reference Lengua2008) found that whereas some boys showed more externalizing problems as they received more physical punishment, others showed fewer externalizing problems as they received more physical punishment. The accumulation of such findings might suggest that there is a phenomenon of children being affected by environmental exposures not in the direction we hypothesize and analyzing subgroups of children may show associations that are not revealed when analyzing the whole group.
Genetic contributions to environmental susceptibility
When comparing twins, we found that MZ twins were closer to each other than DZ twins in the multidimensional space, as anticipated due to the expected genetic contributions to our phenotypic and environmental measures. As this multidimensional space represents different patterns of E–O associations, used here as an indication of environmental susceptibility, such MZ and DZ differences suggest heritability of environmental susceptibility patterns. This possibility is supported by previous research that has shown that environmental susceptibility is partially heritable, as measured by sensory-processing sensitivity (Assary et al., Reference Assary, Zavos, Krapohl, Keers and Pluess2020), or other phenotypic measures (Markovitch & Knafo-Noam, Reference Markovitch and Knafo-Noam2021). When considering environmental susceptibility as multidimensional, heritability might be expressed in complex combinations of genetic factors that contribute to different susceptibility patterns (Markovitch & Knafo-Noam, Reference Markovitch and Knafo-Noam2021).
Associations of environmental susceptibility with temperament
We also found that the environmental susceptibility space assessed in this study was closely related to different temperament profiles. As we tried to identify regions of the space, we focused on four groups of children that were determined based on different patterns of temperament associations. Temperament, and especially negative emotionality, has been previously found to be a marker for environmental susceptibility (Slagt et al., Reference Slagt, Dubas, Deković and van Aken2016). Indeed, all four regions showed significant associations with negative emotionality, with two of them related to higher, and the other two to lower, negative emotionality. However, in contrast to the common claim that children higher in negative emotionality are susceptible and children lower in negative emotionality are less susceptible, we found that groups related to both high, and low, negative emotionality demonstrated E–O associations, just different patterns. Interestingly, the patterns of E–O associations of groups related to higher negative emotionality were broader (especially Group 1), showing at least some aspects of domain generality for these children and possibly reflecting the numerous previous studies finding support for negative emotionality as a susceptibility marker (Slagt et al., Reference Slagt, Dubas, Deković and van Aken2016).
Our findings suggest that even though the level of negative emotionality has a role in environmental susceptibility, it is not negative emotionality alone that has an effect, but rather its combination with other temperamental traits, especially activity. While both Groups 1 and 2 showed higher levels of negative emotionality, Group 1 was related to high activity, and Group 2 was related to low activity. Similarly, while both Groups 3 and 4 showed lower levels of negative emotionality, Group 3 was related to high activity and Group 4 to low activity. This suggests that the combination of one’s tendency to feel intense negative emotions, together with one’s energy levels, possibly has a unique role in environmental susceptibility, supporting the importance of employing a person-center approach when studying environmental susceptibility (Moran et al., Reference Moran, Lengua, Zalewski, Ruberry, Klein, Thompson and Kiff2017).
These findings may explain previous inconsistencies, where many studies found high levels of negative emotionality as indicators of susceptibility to environmental effects (Slagt et al., Reference Slagt, Dubas, Deković and van Aken2016), but several studies have also shown environmental susceptibility within individuals low on negative emotionality (e.g., Bush et al., Reference Bush, Lengua and Colder2010; Du Rocher Schudlich et al., Reference Du Rocher Schudlich, White, Fleischhauer and Fitzgerald2011; Lengua, Reference Lengua2008; Markovitch et al., Reference Markovitch, Kirkpatrick and Knafo-Noam2021). Such inconsistencies should also be considered under the limitation that temperament traits change throughout the lifespan (for a meta-analysis, see Bleidorn et al., Reference Bleidorn, Schwaba, Zheng, Hopwood, Sosa, Roberts and Briley2022), and are affected by both genetic and environmental factors (for a meta-analysis, see Polderman et al., Reference Polderman, Benyamin, De Leeuw, Sullivan, Van Bochoven, Visscher and Posthuma2015), and so they can just as easily by an “outcome” of differences in environmental susceptibility, instead of a characterization of variation in environmental susceptibility. However, important to the focus here, all groups of children examined, who were characterized by different temperament profiles and different E–O associations, demonstrated environmental susceptibility at least to some contexts.
Finally, one trait that we did not measure in our study is sensory-processing sensitivity. In recent years, sensory-processing sensitivity has gained support as being related to individual differences in environmental susceptibility and a phenotypic marker for environmental susceptibility (for a review see Greven et al., Reference Greven, Lionetti, Booth, Aron, Fox, Schendan, Pluess, Bruining, Acevedo, Bijttebier and Homberg2019). Thus, future studies should incorporate measures of sensory-processing sensitivity when studying environmental susceptibility patterns.
Strengths and limitations
The present study has several strengths. First, we examined effects of multiple environmental exposures and developmental outcomes within the same sample. This was only recently done for the first time (Markovitch et al., Reference Markovitch, Kirkpatrick and Knafo-Noam2021; Sayler et al., Reference Sayler, Zhang, Steinberg and Belsky2022; Zhang et al., Reference Zhang, Widaman and Belsky2021), but not to this extent, with 28 different measures of environmental exposures and developmental outcomes, across different domains. Such a diverse, multidomain, design to study environmental influences is of special importance, as was recently emphasized (Boardman et al., Reference Boardman, Daw and Freese2013; von Stumm & D’Apice, Reference von Stumm and D’Apice2021). Second, we used a data-driven approach, that tested environmental susceptibility as it appears in the data itself, instead of an a priori categorization of the children into susceptibility groups according to a predisposed marker. Third, our study is one of the first studies to examine the role of genetic factors in environmental susceptibility by using a twin design. Finally, our large (N = 1,465) sample size as well as the multiple sources for our measures (children and their mothers) make our findings more reliable.
Our findings need to be considered in light of several limitations as well. The first, and most important, is regarding the preliminary nature of our findings, their generalizability, and replicability. Because environmental susceptibility is a complex phenomenon, relating to numerous environmental exposures and developmental outcomes, no one study can investigate all of them and answer such complex questions with certainty, and our study is no different. The current findings are restricted as they are based on one sample, a specific developmental period, and specific environmental exposures and outcomes (even if varied). Furthermore, some design limitations (e.g., nonexperimental, cross-sectional design, see below), together with some of the exploratory choices we made (e.g., choosing three dimensions to investigate the environmental susceptibility space, forcing equal sized groups), limit the conclusions and the possibility to create direct replications of our results. However, such findings are not meant to be directly replicated, but rather the aim of this paper was to empirically address important theoretical questions as a ‘proof-of-principle’, serving as a conceptual replication (Crandall & Sherman, Reference Crandall and Sherman2016) to previous studies testing similar theoretical questions using different approaches, samples, developmental periods, environmental exposures, and developmental outcomes (Belsky et al., Reference Belsky, Zhang and Sayler2021; Markovitch et al., Reference Markovitch, Kirkpatrick and Knafo-Noam2021; Markovitch & Knafo-Noam, Reference Markovitch and Knafo-Noam2021; Sayler et al., Reference Sayler, Zhang, Steinberg and Belsky2022; Zhang et al., Reference Zhang, Widaman and Belsky2021, Reference Zhang, Schlomer, Ellis and Belsky2022). Future studies should continue attempts of conceptual replications, using different samples, different developmental periods, examining different E–O associations, and using different analytical approaches.
Second, as we previously mentioned, only recently empirical studies have been conducted to investigate domain specificity of environmental susceptibility (Belsky et al., Reference Belsky, Zhang and Sayler2021; Markovitch et al., Reference Markovitch, Kirkpatrick and Knafo-Noam2021; Markovitch & Knafo-Noam, Reference Markovitch and Knafo-Noam2021; Sayler et al., Reference Sayler, Zhang, Steinberg and Belsky2022; Zhang et al., Reference Zhang, Widaman and Belsky2021, Reference Zhang, Schlomer, Ellis and Belsky2022). Two of these papers are done on the sample of the Longitudinal Israeli Study of Twins (Vertsberger et al., Reference Vertsberger, Abramson and Knafo-Noam2019), which is also the sample tested in the current study. This limitation calls for conceptual replications within different samples.
The analytic approaches we used also have some limitations. Our approach to study environmental susceptibility examined patterns of E–O associations within specific groups and not in the entire sample. As understanding how the environment influences different children’s development is important, future studies should aim to map susceptibility patterns across all children. Furthermore, our choice to measure environmental susceptibility based on multiple contexts simultaneously meant that we assessed environmental effects within groups (based on correlations, providing estimations of trends for the entire group), and not within children. In this respect, the influence statistics method suggested by Belsky (Belsky et al., Reference Belsky, Zhang and Sayler2021; Zhang et al., Reference Zhang, Widaman and Belsky2021) might give a better child-focused estimation. In addition, our choice to examine the multidimensional space on a three-axes coordinate system was arbitrary, as it explained a good portion of the variance and was simple to visualize and thus interpret. Future studies should examine environmental susceptibility patterns within a higher dimensional space. However, as even the three-dimensional space we examined demonstrated a complex pattern of susceptibility, we are doubtful that increasing the dimensionality will contradict our multidimensionality conclusion. Additionally, future studies might want to compare whether the different analytical approaches (i.e., our data-driven approach and the influence statistic approach used by Belsky’s team) yield similar results when applied on the same dataset.
Finally, our design also has some limitations. Even though we had two different sources of reporting (children and mothers), almost all our measures were from questionnaires, which can be biased. Furthermore, our design was nonexperimental and we assessed environmental effects concurrently and not longitudinally. Future studies should aim to examine similar questions with other methods, using additional sources, and both experimental and longitudinal designs.
Conclusions
Individual differences in environmental susceptibility were often discussed in theoretical and empirical papers using dichotomic terms, describing two types of people, those who are susceptible and those who are not. Even though the questions of continuity and specificity were raised already in early works, they have not been empirically tested until recently. Joining recent studies testing similar theoretical issues, we used a novel data-driven approach to suggest that environmental susceptibility is a continuous, multidimensional space, and that domain generality and domain specificity might not be characteristics of the general environmental susceptibility trait, but rather of susceptibility patterns of different children. As how environmental exposures affect the development of different children has been one of the most fundamental questions in developmental science, the need to accurately address such differences is important for researchers, practitioners, and educators. Our finding that all groups of children examined showed some susceptibility might suggest that there is a channel to affect and help every child, we just need to find the right one for them.
Supplementary material
The supplementary material for this article can be found at https://doi.org/10.1017/S0954579423000779.
Funding statement
This work was funded by the Israel Science Foundation (AK grant numbers # 1670/13 and # 1333/18) and the Center of Interdisciplinary Data Science Research (YH and AK grant # 3035000326). The first author was supported by a fellowship from the Israeli Committee for Advancing Psychometrics & the National Institute for Testing and Evaluation (ICAP and NITE).
Competing interests
The authors declare none. The authors would like to thank research assistants who helped with data collection and the families in the Longitudinal Israeli Study of Twins (LIST) for their continued participation.


 Open access