


The metabolic syndrome (MetS) is related to metabolic abnormalities including obesity, hyperglycaemia, dyslipidaemia and hypertension and is prevalent worldwide(Reference Beltrán-Sánchez, Harhay and Harhay1). Compared with people without the MetS, people with MetS had a higher overall number of deaths for all causes(Reference Ho2). Particularly, the evidence demonstrates that genetic variations play a main part in the prevention and treatment of various chronic diseases, particularly in the MetS(Reference Katzmarzyk, Pérusse and Rice3–Reference Pérusse, Després and Tremblay5). The MetS and CVD also demonstrate the role of genetic and environmental factors in diet-related disorders. The genetic background of metabolic disorders has been shown to relate to death rate over the last few decades(Reference Wang, Dong and Xu6). There is therefore a need to identify the genes that derive MetS and to develop new therapies. Caveolin-1 (CAV-1) is a key protein component of caveolae and has been widely studied in dyslipidaemia and CVD due to signal transduction, trafficking in cholesterol haemostasis and TAG metabolism(Reference Jin, Lee and Minshall7). Mice treated with CAV-1 are resistant to high-fat diets, and they show lipodystrophy, hypertension, insulin resistance and abnormal glucose metabolism(Reference Pavlides, Gutierrez-Pajares and Danilo8). Moreover, several studies have indicated that CAV-1 genetic variations might interact with other risk factors, including dietary intake of fatty acids, suggesting a positive association between CAV-1 and hypercholesterolaemia(Reference Shyu, Chen and Hsieh9). In studies conducted among Caucasian and Hispanic cohorts, the prevalence of CAV-1 gene variant rs926198 is related to higher odds of the MetS risk and low HDL(Reference Baudrand, Goodarzi and Vaidya10,Reference Pojoga, Underwood and Goodarzi11) . Also, CAV-1 overexpression has been observed to relate to higher odds of atherosclerosis in experimental models(Reference Fernandez-Hernando, Yu and Davalos12). The exact mechanisms are unclear, but it seems that CAV-1 is able to regulate several key enzymes in lipid metabolism, such as cholesterol ester transfer protein and phospholipid transfer protein(Reference Frank, Pavlides and Cheung13). While the association between CAV-1 polymorphisms and type 2 diabetes risk has been widely reported in various populations(Reference Haddad, Al Madhoun and Nizam14), these relationships with the MetS have been inconsistent, despite several publications on the association between CAV-1 gene variants and serum lipid profiles(Reference Haddad, Al Madhoun and Nizam14–Reference Nizam, Al-Ozairi and Goodson17). To the authors’ knowledge, there has been no study evaluating CAV-1 rs3807992 variant, metabolic risk factor and the interaction of fatty acid intake levels with this SNP. Hence, the aim of the current study was to evaluate the interaction of CAV-1 genetic polymorphism with the types of dietary fatty acids, in terms of the MetS risk factor status.
Materials and methods
Study population
For this cross-sectional study, 404 women in the range of 18–55 years old were recruited from health referral centres. Participants provided written informed consent. The inclusion criteria were: obese or overweight, no alcohol consumption and no smoking. CVD, hypertension, type 2 diabetes, polycystic ovary syndrome, kidney failure, stroke, thyroid disease, liver disease, cancer, inflammatory diseases and those who were on certain therapeutic drugs, weight loss programmes or supplements during the study time were all excluded. Each participant was interviewed in order to obtain demographic data and then referred to the laboratory for blood sampling. Anthropometric measures were taken, including: height (m), weight (kg), waist circumference (cm) measured at the narrowest part of the abdomen, and BMI (kg/m2, calculated by dividing weight by height squared). Blood pressure (BP) was measured with a sphygmomanometer (BP) after 5 min’ rest. The study was approved by the Ethics Committee at the Tehran University of Medical Sciences (97-03-161-41017).
The metabolic syndrome definition
MetS cases were required to meet three or more of the following criteria according to the Adult Treatment Panel III criteria:
-
1) Elevated fasting blood glucose ≥ 100 mg/dl.
-
2) Hypertriacylglycerolaemia TAG ≥ 150 mg/dl
-
3) Elevated BP (≥ 130/85 mmHg)
-
4) Low (HDL-cholesterol) < 50 mg/dl in women
-
5) Waist circumference cut-off 80 cm (women) was considered as an indicator of abdominal obesity(Reference Hu, Rimm and Stampfer18).
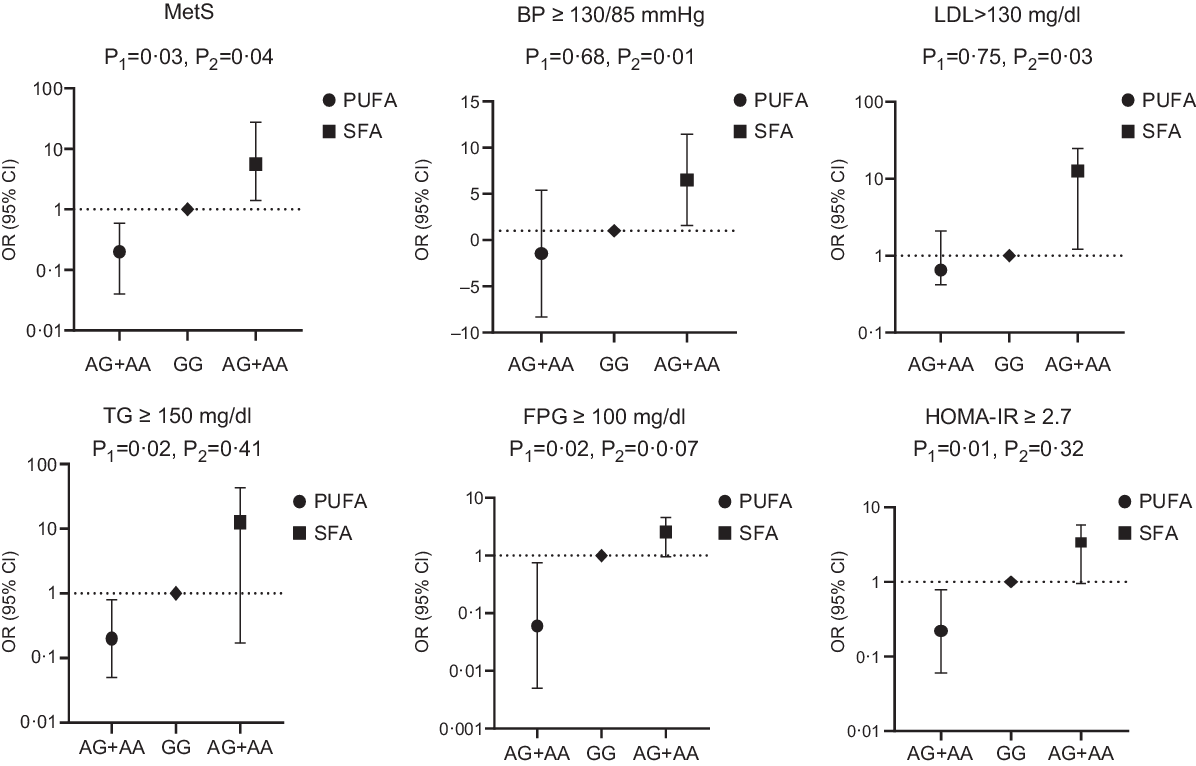
Fig. 1. Adjusted OR (95% CI) for the metabolic syndrome (MetS) and its components according to median of dietary fat intake and CAV-1 rs3807992
Dietary assessment
The FFQ was a useful tool for evaluating dietary intake and included 147 items(Reference Mohammadifard, Sajjadi and Maghroun19). This assessment was carried out by interviewing the occurrence of food items consumed on the basis of a predetermined list of foods. The extracted FFQ values were then changed to g/d. For the evaluation of macro- and micronutrient content, N4 software was used; all measurements were then entered into IBM SPPS.
Physical activity measurement
Physical activity was measured using the International Physical Activity Questionnaire short form. Women’s physical activity was divided into three categories: low (under 600), mild (600–3500) and extreme (over 3500) (MET-h/week). International Physical Activity Questionnaire’s validity and reliability were tested in Iranian people(Reference Moghaddam, Aghdam and Asghari Jafarabadi20).
Genotyping
For genotyping the CAV-1 polymorphisms, DNA was extracted from whole blood via a Mini Columns kit (Type G; Genall; Exgene). The PCR-restriction fragment length polymorphism technique was employed to investigate CAV-1 polymorphisms (rs3807992) in gene fragments (major allele G and minor allele A). PCR was carried out using the following primers: F:3′AGTATTGACCTGATTTGCCATG5′ R:5′GTCTTCTGGAAAAAGCACATGA-3′. PCR were performed in a volume of 20 µl, containing 50 ng extracted DNA, 10 μm Forward primers, 10 μm, Reverse primers,7 µl distilled water and Taq DNA Polymerase Master Mix (2X) in a DNA thermocycler. The DNA templates were denatured at 94°C for 3 min and 40 cycles, including a min denaturation at 94°C, a min annealing at 42–50°C and elongation at 72°C for 2 min. Amplified DNA was digested with Hin1II (NIaIII) (2·5 U) restriction enzyme at 37°C overnight and then separated by electrophoresis on an agarose gel (2·5 %). Fragments concluding three genotypes of the CAV-1 rs3807992 variant were detected: uncut homozygous AA (213bp), cut heterozygous GA (3 bands: 118 & 95 & 213 bp) and cut homozygous GG (2 bands: 118 & 95 bp).
Biochemical analysis
All blood samples were drawn, after 12–14 h of fasting, at the nutrition laboratory of Tehran University of Medical Sciences. Blood samples were centrifuged for 10 min at 3000 rpm to extract serums, then aliquoted into 1 ml tubes and stored at 70°C before analysis. Auto-analyzer BT 1500 (Selectra 2; Vital Scientific) was used to test the samples. Fasting plasma glucose was determined using the Glucose Oxidase Phenol 4-Aminoantipyrine Peroxidase process. TAG kits (Pars Azmoon Inc.) were used to measure serum TAG by colorimetric method tests with Glycerol-3-phosphate oxidase Phenol 4-Aminoantipyrine Peroxidase. The cholesterol oxidase-Phenol 4-Aminoantipyrine Peroxidase was used to calculate total cholesterol, and the direct method and immunoinhibition were used to measure LDL and HDL. Pars Azmoon (Pars Azmoon Inc.) provided all of the kits.
Statistical analysis
Statistical analysis was performed using SPSS version 25 software (SPSS Inc.), and significance level was considered P < 0·05. The Kolmogorov–Smirnov was utilised to test the normality of the data, and all data were expressed as means and standard deviation. The Pearson’s χ 2 test was used to determine the Hardy–Weinberg Equilibrium deviation among allele frequency of CAV-1 G32124A (rs3807992). We used the dominant model for genetic analysis, risk allele carriers (AA, AG) compare with homozygotes major allele (GG). Medians and interquartile ranges were calculated for dietary intakes between CAV-1 genotypes. Mann–Whitney U test and Quade’s ANCOVA were used for associations between dietary and genotypes in crude and adjusted models, respectively. Independent-sample t test was used to evaluate the differences between the two groups. Binary logistic regression was used to estimate interactions between rs3807992 and high and low dietary fat intake on the OR of the MetS component. Interaction analyses were adjusted for variables proven to be related to MetS components (such as age, physical activity, energy intake, BMI, age at onset of obesity, and total SFA and PUFA intake).
Results
Clinical characteristics according to caveolin-1 rs3807992 genotypes
The overall prevalence of rs3807992 genotypes was 38·34% and 61·66 % for the A and G alleles. The genotype distributions had a deviation from HWE (P < 0·05). Table 1 expresses the mean clinical characteristics of all women according to CAV-1 genotypes. It was observed that the (AA + AG) group had significantly higher BMI, waist circumference and DBP (P = 0·02, P = 0·02 and P = 0·01, respectively). Furthermore, women with (AA + AG) allele had significantly lower serum LDL (P = 0·006) and HDL (P < 0·0001) than the GG group. Additionally, no significant differences were detected for age, height, weight, FBG, TAG and SBP.
Table 1. Clinical characteristics of all subjects based on caveolin-1 (CAV-1) rs3807992 genotypes
(Mean values and standard deviations)

WC, waist circumference; FPG, fasting plasma glucose; TC, total cholesterol; SBP, systolic blood pressure; DBP, diastolic blood pressure.
Comparisons between groups were determined based on independent-samples t test.
Bold values indicate statistical significance (P < 0·05).
Genotype frequencies between the metabolic syndrome and control groups
Distributions of allele frequencies and the effect size of rs3807992 on various genetic models (codominant, dominant, recessive) had significant differences between the MetS and control groups. In the codominant model, the A homozygous allele for the CAV-1 (rs3807992) gene was 52 % higher in the control group than the MetS group (OR 2·52 (1·11, 5·70), P = 0·02). In the dominant model, the A homozygous allele for the CAV-1 (rs3807992) gene was 31% higher in the control group than the MetS group (OR 2·31 (1·16, 4·61), P = 0·01) (Table 2).
Table 2. Caveolin-1 (CAV-1) rs3807992 frequencies between the metabolic syndrome (MetS) and control groups
(Numbers and percentages)

Comparisons between groups were determined based on logistic regression analysis.
Bold values indicate statistical significance (P < 0·05).
Associations between caveolin-1 rs3807992 and the risk of the metabolic syndrome and its components
It was found that (rs3807992) A allele carriers were at higher odds of the MetS (OR 2·31 (1·16, 4·16), P = 0·01), abdominal obesity (OR 1·42 (0·98, 2·06), P = 0·06), increased TAG concentration (OR 2·12 (1·13, 3·95), P = 0·01), elevated BP (OR 7·03 (1·43, 34·44), P = 0·01), increased glucose concentration (OR 0·7 (0·27, 1·78), P = 0·45) and decreased HDL-cholesterol concentration (OR −1·4 (1·02, 1·93) P = 0·03) (Table 3).
Table 3. Associations between caveolin-1 (CAV-1) rs3807992 and the risk of the metabolic syndrome (MetS) and its components
(Odds ratios and 95 % confidence intervals)

BP, blood pressure; FPG, fasting plasma glucose.
Comparisons between groups were determined based on binary logistic regression analysis adjusted by age.
Bold values indicate statistical significance (P < 0·05).
Dietary intake relationships between caveolin-1 rs3807992 gene polymorphisms and their interaction on the metabolic syndrome and its components
The results of dietary nutritional intake are described according to genotype groups, which show no significant differences were found in nutrient consumption values (Table 4).
Table 4. Dietary fat intakes of all subjects based on caveolin-1 (CAV-1) rs3807992 genotypes
(Median values and interquartile ranges (IQR))

Mann–Whitney U test and Quade’s ANCOVA were performed to identify significant differences between CAV-1 rs3807992 genotypes in crude and adjusted model respectively.
* (P value): crude model.
† (P value): adjusted model by potential confounding factors (age, energy intake, educational level, DBP).
It was observed that the interaction of CAV-1 rs3807992 gene polymorphism and SFA intake was significant on the MetS (OR 5·60 (1·14, 27·40), P = 0·03) and its components, including LDL (OR 12·95 (1·21, 24·69), P = 0·03), BP (OR 6·52 (1·59, 11·45), P = 0·01) in the multi-adjusted model (adjusted for age, energy intake, BMI, age at onset of obesity and total PUFA intake). There was no further significant interaction between the (AA + AG) group and SFA intake on other biochemical parameters, including HDL and TAG in both the crude and adjusted models (P > 0·05) (Table 5; Fig. 1).
Table 5. Interactions between the caveolin-1 (CAV-1) rs3807992 and SFA intake in relation to the metabolic syndrome (MetS) and its components
(Odd ratios and 95 % confidence intervals)

BP, blood pressure.
Binary logistic was performed.
* P-value: adjusted model by potential confounding factors (age, physical activity, energy intake, BMI, age at onset of obesity, and total PUFA intake).
Interestingly, when CAV-1 (AA + AG) group interaction was analysed by PUFA intake, the relationship was significant in terms of the MetS (OR − 0·207 (0·04, 0·95), P = 0·04) and its components, including TAG (OR − 0·27 (0·05, 0·8), P = 0·02), fasting plasma glucose (OR −0·06 (0·005, 0·75), P = 0·02) and homoeostasis model assessment insulin resistance (OR − 0·22 (0·06, 0·78), P = 0·01) in the multi-adjusted model (adjusted for age, energy intake, BMI, age at onset of obesity and SFA intake) (Table 6; Fig. 1).
Table 6. Interactions between the caveolin-1 (CAV-1) rs3807992 and PUFA intake in relation to the metabolic syndrome (MetS) and its components
(Odds ratios and 95 % confidence intervals)

FPG, fasting plasma glucose; HOMA-IR, homoeostasis model assessment insulin resistance.
Binary logistic was performed.
* P-value: adjusted model by potential confounding factors (age, physical activity, energy intake, BMI, age at onset of obesity and total SFA intake).
Discussion
According to these findings, female A allele carriers had significantly higher BMI, waist circumference and DBP and had lower serum LDL and HDL, compared with GG genotypes. This demonstrates that their clinical parameters are predisposed to the MetS. A allele carriers were at higher odds of the MetS. To the authors’ knowledge, there is little evidence describing an association between CAV-1 and the MetS. It was observed that a genetic variant of CAV-1 (rs3807992) was associated with increased MetS risk, which is consistent with previous studies that revealed a significant association between the minor allele in CAV-1 variations and the odds of metabolic diseases(Reference Baudrand, Goodarzi and Vaidya10,Reference Pojoga, Underwood and Goodarzi11,Reference Chen, Wang and Wang15,Reference Nizam, Al-Ozairi and Goodson17) . Previous studies by our research team have shown association between CAV-1 rs3807992 and metabolic disease(Reference Abaj, Koohdani and Rafiee21,Reference Abaj, Saeedy and Mirzaei22) . Also, compared with other candidate gene studies, no studies had evaluated SNP rs3807992 and MetS risk.
It is proposed that CAV-1 polymorphisms increase MetS risk through altered CAV-1 gene expression, attenuating dyslipidaemia and hypertension, while impairing glucose and insulin homoeostasis(Reference Fernandez-Hernando, Yu and Davalos12–Reference Haddad, Al Madhoun and Nizam14,Reference Razani, Woodman and Lisanti23) . CAV-1 regulates signalling molecules, such as IRS1, that have a key role in appropriate insulin responses, protein kinase A, angiotensin II receptors, active BP molecules, binding sites for Ca ions, insulin, lipids and hormone metabolisms; all of these may affect various clinical traits of the MetS(Reference Haddad, Al Madhoun and Nizam14,Reference Wang, Wang and Liu24–Reference Czikora, Feher and Lucas26) . Apart from genetic mutations, increasing evidence indicates that epigenetic modifications can provide an upstream regulatory switch to regulate the expression of CAV-1 thus leading to disease conditions(Reference Low and Nicholson27). Most of the recent research focuses on the effects of methylation on CAV1 expression. MiRNA-103 and 107 are up-regulated in obese mice, which can lead to impaired glucose homoeostasis, insulin receptor stabilisation and a receptive insulin signalling system(Reference Nystrom, Chen and Cong28,Reference Trajkovski, Hausser and Soutschek29) . In lipid metabolism, DHA has been shown to modify the transcriptome of miRNA. The expression of miRNA-192 in endothelial cells is greatly increased by DHA, and CAV1 is estimated to be a target for miRNA-192. CAV1 expression is decreased when miRNA-192 is overexpressed(Reference Gil-Zamorano, Martin and Daimiel30).
Most previous intervention studies have shown that environmental factors, in particular dietary fat composition, may alter the risk of the MetS. Based on previous studies, higher intake of SFA was detrimental to maintaining insulin sensitivity, whereas PUFA showed beneficial effects(Reference Iggman and Risérus31). Additionally, nutrigenetic research has indicated that dietary fat background can influence genotype–phenotype relations(Reference Phillips32). In our study, the genetic association between CAV-1 polymorphisms and the MetS by dietary fat intake was reported. High dietary SFA intake (≥25 g) especially accentuated the negative effects of rs3807992 in terms of MetS risk.
The evidence for the CAV1 gene and nutrient is limited so far, and it is mostly based on animal studies. In mice models, the role of dietary fat in the relationship between the CAV1 gene and lipid and glucose metabolism has been investigated previously. CAV-1 KO mice have demonstrated resistance to obesity diet, as well as increased plasma levels of chylomicron/VLDL particles and TAG caused by a defect in lipid droplet formation and hydrolysis(Reference Razani, Combs and Wang33). Under fat diet conditions, CAV-1 null mice have shown white adipose tissue atrophy and TAG deposition in plasma. Besides, CAV-1 knockout mice fed a western-type diet represent a significant rise in VLDL and IDL/LDL(Reference Frank, Lee and Park34).
Besides, CAV-1 has also been observed moving from the plasma membrane to lipid droplets in response to NEFA(Reference Cohen, Razani and Schubert35).CAV-1ʼs function in lipid transport had also been confirmed by CAV-1-deficient mice’s lean phenotype, which had significantly higher serum levels of NEFA and TAG in the postprandial state(Reference Pol, Luetterforst and Lindsay36–Reference Pol, Martin and Fernandez38). Accordingly, caveolae are a main centre for several nutrient metabolisms through the cell membrane and play a unique function in the uptake of various lipid and glucose metabolites(Reference Pilch and Liu39). Caveolae are able to uptake fatty acid, TAG and cholesterol in many tissues, which leads to an elevation in caveolae density in obese rats(Reference Grayson, Chadha and Bertrand40,Reference Su and Abumrad41) . In line with previous studies, experimental studies have reported that sphingomyelin is a key phospholipid of caveolae. SFA intake may lead to increases in sphingolipids levels in the cardiac cell membranes, thus disrupting the caveolae contents(Reference Le Lay, Li and Proschogo42,Reference Perona43) . Furthermore, CAV-1 mRNA levels are up-regulated by free cholesterol in human cells(Reference Fielding44). An appropriate level of cholesterol in the cell membrane under dietary fat conditions causes the caveolae activity are disrupted(Reference Thomas and Smart45). Experimental studies suggest that lipid abnormalities can influence caveolae formation and function, thereby disrupting fatty acid metabolism and contributing to the development of the MetS and obesity(Reference Zhang46).
A further novel finding is that high PUFA intake (≥6 % energy) reduced the negative effects of rs3807992 in terms of MetS risk, with the greatest protection achieved by A allele carriers. Caveolae membrane fatty acids (in the internal and external leaflet) are also significantly altered by n-3 PUFA intake and are even able to change the function of the caveolae. In this regard, Chapkin et al. reported that in animal models, n-3 PUFA intake may modulate the function of caveolae proteins/lipid, affecting membrane fusion and cell–cell signalling, and improving insulin signalling(Reference Chapkin, McMurray and Davidson47). Previous studies have indicated that H-Ras and endothelial nitric-oxide synthase are moved from caveolae in n-3 PUFA-supplemented rats, which suppressed the Ras-dependent signalling and reduced BP, thereby lowering the MetS risk(Reference Li, Zhang and Wang48,Reference Ma, Seo and Davidson49) . CAV-1 prevents the production of nitric oxide. These findings demonstrate that PUFA intake affects CAV-1 abundance, which in turn affects endothelial nitric-oxide synthase activity and, as a result, vascular function(Reference Komarova and Malik50,Reference Schubert, Frank and Woodman51) .
Besides, CAV-1 can regulate fatty acid translocase surface accessibility by acting as an intracellular shuttle for long-chain fatty acids to lipid droplets and thus indirectly control long fatty acid uptake(Reference Razani, Combs and Wang33,Reference Ostermeyer, Paci and Zeng37,Reference Pol, Martin and Fernandez38) . Fatty acid translocase is required for long-chain fatty acid uptake. CAV-1 deficiency has previously been linked to a total loss of caveolae, the lack of fatty acid translocase cellular membrane expression and a decrease in fatty acid uptake(Reference Ring, Le Lay and Pohl52).
In this research, we observed that a PUFA can be effective on glucose profile in risk allele carriers. Changes in insulin receptor activity are one of the proposed pathways for the effect of dietary fat and CAV-1 on metabolic markers. According to strong evidence, caveolae are implicated in the pathogenesis of insulin receptor and the MetS(Reference Haddad, Al Madhoun and Nizam14). If animals were fed a high-fat diet, insulin receptor substrate 1 and Protein Kinase B showed reduced activity, indicating insulin resistance. These results point to a mechanism by which a high-cholesterol diet affected CAV-1 expression in vivo, as well as insulin receptor localisation and function(Reference Haddad, Al Madhoun and Nizam14,Reference Cohen, Combs and Scherer53,Reference Hahn-Obercyger, Graeve and Madar54) . It is suggested that a correlation between hyperlipidaemia and insulin receptor through caveolae under dietary fat conditions.
However, another mechanism by which fatty acids can alter the genetic risk posed by CAV-1 polymorphisms may also contribute to the apoA1(Reference Frank, Pavlides and Cheung13). Consistent with our results, CAV-1-deficient animals fed a western-style diet have significantly lower apoA-I plasma levels. Loss of CAV-1 contributes to the development of the MetS, according to apoA-I levels, the key protein marker of HDL(Reference Frank, Cheung and Pavlides55).
The mechanism observed in the present study, by which fatty acids are able to modify the genetic risk posed by CAV-1 polymorphisms, remains unknown; further studies are needed to indicate such gene–diet interventions. Caveolae and its components may become useful sites for further investigation into treating the MetS.
Limitations
Several limitations can also be identified in the current study. Dietary intake was assessed by a FFQ, which is self-reported and thus dependent on patient memory. Due to financial limitations, it was not possible to perform western blot analysis to determine whether rs-3807992 SNP alters the expression of CAV-1. The focus of the current study was on dietary fat composition, but other nutrient components, including carbohydrates or fibre, can also play a role in the progression of the MetS. Furthermore, lipid parameter measurements were taken, while the subjects were fasted, which may have obscured differences in CAV-1 under fed conditions. Given the observational nature of the study, it is not possible to tell whether the associations which were identified in women (but not men) are of a causal nature. Finally, we did not include a normal-weight participant due to financial constraints and instead focused on overweight and obese women as high-risk categories for the MetS(Reference Bradshaw, Monda and Stevens56). However, as the first study in this regard, we recommend that future research concentrate on normal-weight people both men and women.
Conclusion
To the authors’ knowledge, this is the first study presenting the association of a genetic variant of CAV-1 rs3807992 with the risk of the MetS and its components, including TAG, BP and HDL level. However, further studies are needed to determine the strength of this association in a larger population; the contribution of this study is the novel finding that rs3807992 clearly predicts the MetS among obese women. Analyses of the individual components of the MetS confirmed that the rs3807992 variant is related to elevated BP, dyslipidaemia, low HDL-cholesterol and high TAG levels. Also, CAV-1 rs3807992 genotypes are sensitive to dietary SFA and PUFA, which allows individuals to monitor and adjust SFA and PUFA consumption accordingly. Finally, these results can be used in combination with a patient’s genetic history in order to provide more applicable and tailored nutritional advice for preventing or attenuating the MetS in overweight and obese women.
Acknowledgements
We would like to thank all the individuals who participated in this project.
This study was supported by a grant from TUMS (41017).
F. A. contributed to conception, design, data analyses, data interpretation and manuscript drafting. K. H. M. supervised the study. All authors approved the final manuscript for submission.
The authors declare no conflict of interest.


