


Introduction
Non-communicable diseases are the major cause of morbidity and mortality worldwide(Reference Saklayen1). Among non-communicable diseases, metabolic syndrome (MetS) is a complex pathophysiologic state and specific metabolic abnormality defined by anthropometric and biochemical measurements(Reference Saklayen1). The present prevalence of MetS is estimated to be approximately one-quarter of the world population(Reference Saklayen1); epidemic trends have indicated that the prevalence and incidence rate of MetS have been rising globally(Reference Ranasinghe, Mathangasinghe and Jayawardena2–Reference Richelsen4), and that MetS is becoming the major health hazard of modern world(Reference Saklayen1). Additionally, many adverse health effects of MetS have led to an increased risk of CVD(Reference Mottillo, Filion and Genest5), type 2 diabetes mellitus(Reference Ford, Li and Sattar6), cancer(Reference Mendonça, de Sousa and Barbosa7) and all-cause mortality(Reference Saklayen1,Reference Wu, Liu and Ho8) . Early MetS prevention has positively affected public health worldwide, and it is meaningful to identify modifiable risk factors to primarily prevent MetS and reduce the disease burden of MetS.
Sugar-sweetened beverages (SSB) can be defined as some sweetened beverages, including soft drinks (soda) and energy and vitamin water drinks(Reference Imamura, O Connor and Ye9,Reference Malik, Popkin and Bray10) . People have paid considerable attention to excessive and highly prevalent SSB consumption in recent years(Reference Sturt11). Several epidemiological studies have suggested that SSB consumption potentially contributes to an increase in the risk of many medical conditions, such as CVD(Reference Malik, Popkin and Bray12,Reference Hu and Malik13) , type 2 diabetes mellitus(Reference Imamura, O Connor and Ye9,Reference Malik, Popkin and Bray10) , obesity(Reference Hu and Malik13) and fatty liver disease(Reference Chen, Wang and Li14), but the association remains unclear(Reference Imamura, O Connor and Ye9,Reference Malik, Popkin and Bray12,Reference Hu and Malik13,Reference Malik and Hu15) . Moreover, despite growing interest in artificially sweetened beverages (ASB, presented as candidate alternatives for SSB(Reference Imamura, O Connor and Ye9,Reference Malik and Hu15) in the form of diet or non-carbonated low-energetic beverages(Reference Malik, Popkin and Bray10,Reference de Koning, Malik and Rimm16) ), no meta-analysis has investigated the health effects of various doses of ASB. In addition, the current evidence on whether SSB and ASB consumption is associated with the risk of MetS is insufficient(Reference Dhingra, Sullivan and Jacques17–Reference Kang and Kim21). Previous reviews and meta-analyses on the topic did not include several original articles that had yet been published(Reference Malik, Popkin and Bray10,Reference Narain, Kwok and Mamas22–Reference Green and Syn25) . Most importantly, previous studies have not conducted comprehensive quantitative assessments on this topic. It is essential to examine the SSB–MetS or ASB–MetS dose–response relationship, aiming to provide more evidence for the prevention and management of MetS.
Therefore, we performed this meta-analysis of population-based epidemiological studies to test if SSB, ASB and total sweetened beverage (TSB, the combination of SSB and ASB) consumption would be associated with the risk of MetS and to assess the strength and shape of the SSB–MetS, ASB–MetS and TSB–MetS dose–response associations.
Methods
Registry and protocol
The protocol for this systematic review with meta-analysis was not registered in a trial registry. The Preferred Reporting Items for Systematic Reviews and Meta-Analysis (PRISMA) checklist was followed in conducting the current review. We defined this meta-analysis as follows according to the PICOS principle: P (population): general population; I (intervention/exposure): different exposure levels of TSB, SSB and ASB; C (comparison): high v. low consumption group of TSB, SSB and ASB and per 250 ml/d increase in TSB, SSB and ASB consumption; O (outcome): MetS; S (study design): population-based epidemiological study.
Search strategy
We identified population-based epidemiological studies that investigated the SSB–MetS or ASB–MetS relationship of three databases and were published prior to 4 November 2019, using a combination of MeSH terms and free-text terms: PubMed, Embase and Web of Science. Details of the search terms are listed in Supplemental Table 1.
Study selection
We defined the inclusion and exclusion criteria based on the following aspects: (a) studies assessed the SSB–MetS or ASB–MetS relationship in population-based epidemiological studies (longitudinal study, cross-sectional study or case–control study) in humans; (b) studies reported hazard ratios (HR), OR or relative risks (RR) with 95 % CI; and (c) studies reported sufficient information on risk estimates for three or more categories or continuous SSB or ASB levels associated with the risk of MetS for the analysis of dose–response associations. Additionally, we excluded reviews, meta-analyses, conference articles or abstracts, letters, and articles for which the full text was not available (Fig. 1). We chose those with the most informative reporting of exposure levels and/or the larger sample sizes when duplicate publications were published based on same studies.

Fig. 1 Flowchart of study selection
Data extraction and quality assessment
Two authors (XZ & XL) independently performed data extraction (see online supplementary material, Supplemental Table 2), including first author, publication year, country, study design, participant sex, participant age, sample size, number of MetS patients, definition of MetS, dietary assessment method, category, unit of exposure and OR/RR/HR with the 95 % CI. The model was adjusted for potential confounding factors. For some articles that were missing key details, we tried to obtain these data by emailing the corresponding author of the original article. Two authors (XZ & XL) reviewed the data and resolved all discrepancies by discussion. Quality assessments for the included studies were performed using Newcastle–Ottawa scale (NOS) for longitudinal studies and case–control studies(Reference McPheeters26,Reference Stang27) and Agency for Healthcare Research and Quality (AHRQ) for cross-sectional studies(Reference Rostom, Dube and Cranney28).
Data synthesis and analysis
We converted doses to unit millilitres per d for all studies, and we also used original data if they defined portion size; otherwise, the recommendation (one can or glass or bottle = 330 ml, one cup = 200 ml or one serving/drink = 250 ml)(Reference Imamura, O Connor and Ye9,Reference Hinkle, Rawal and Bjerregaard29–Reference Hu, Cheng and Jiang31) was used. We assumed that the OR and HR were approximately the same as the RR(Reference Zhang and Yu32,Reference Orsini, Li and Wolk33) . Moreover, the RR for the risk of MetS related to per 250 ml/d increase in the SSB or ASB levels were calculated. A random effects model was used to estimate the summary RR with the 95 % CI when heterogeneity I 2 was ≥50; otherwise, a fixed effects model was used. If an article reported data separately for men and women, we used the fixed effects model to pool the results of independent studies, and we used the calculated RR in our main analysis(Reference Imamura, O Connor and Ye9). We treated the data as independent studies when original articles reported data by sex in subgroup analyses. We used existing data if level-specific sample size or the number of MetS patients for exposure were not reported in original article.
We assessed heterogeneity by Cochran’s Q and I 2 statistics. Subgroup analyses were stratified by participant characteristics (sex and age), region (Asia, Europe and America), study design (longitudinal study, cross-sectional study or case–control study), sample size, and the number of MetS patients, and the covariates (participant age, education, tobacco smoking, alcohol drinking, physical activity, energy intake and BMI) were adjusted for in the analysis. Sensitivity analyses were performed by excluding one study at a time and were used to assess stability of the results and potential heterogeneity sources. Egger’s test was used to assess publication bias(Reference Egger, Davey and Schneider34), and P ≥ 0·10 indicated no publication bias. We used the trim-and-fill method when we found publication bias.
All the data analyses were performed with Stata 12.0 (Stata Corp.) (two-sided P = 0·05).
Results
Literature search and study characteristics
We identified seventeen articles (twenty-four studies, including twelve longitudinal studies(Reference Dhingra, Sullivan and Jacques17–Reference Nettleton, Lutsey and Wang19,Reference Kang and Kim21,Reference Høstmark35–Reference Lopez-Molina, Parra-Cabrera and Lopez-Ridaura39) , eleven cross-sectional studies(Reference Dhingra, Sullivan and Jacques17,Reference Lin, Lee and Tsai20,Reference Denova-Gutiérrez, Talavera and Huitrón-Bravo40–Reference Velasquez-Melendez, Molina and Benseñor45) and one case–control study(Reference Mattei, Malik and Hu46)) yielding findings on the TSB–MetS and SSB–MetS associations and four articles (five studies) on the ASB–MetS association(Reference Lutsey, Steffen and Stevens18,Reference Nettleton, Lutsey and Wang19,Reference Ferreira-Pêgo, Babio and Bes-Rastrollo37,Reference Crichton, Alkerwi and Elias44) (Fig. 1). Overall, our meta-analysis included 93 095 participants and 20 749 MetS patients.
The main characteristics of each study are presented in Supplemental Table 2. Overall, five studies were conducted in Asia(Reference Lin, Lee and Tsai20,Reference Kang and Kim21,Reference Mirmiran, Yuzbashian and Asghari36,Reference Hooshmand, Asghari and Yuzbashian38,Reference Chan, Lin and Huang43) , seven studies were conducted in Europe(Reference Høstmark35,Reference Ferreira-Pêgo, Babio and Bes-Rastrollo37,Reference Høstmark and Haug41,Reference Grosso, Marventano and Galvano42) and twelve studies were conducted in America(Reference Dhingra, Sullivan and Jacques17–Reference Nettleton, Lutsey and Wang19,Reference Lopez-Molina, Parra-Cabrera and Lopez-Ridaura39,Reference Denova-Gutiérrez, Talavera and Huitrón-Bravo40,Reference Crichton, Alkerwi and Elias44–Reference Mattei, Malik and Hu46) . Twenty studies were conducted in adult populations(Reference Dhingra, Sullivan and Jacques17–Reference Nettleton, Lutsey and Wang19,Reference Kang and Kim21,Reference Høstmark35,Reference Ferreira-Pêgo, Babio and Bes-Rastrollo37,Reference Lopez-Molina, Parra-Cabrera and Lopez-Ridaura39–Reference Grosso, Marventano and Galvano42,Reference Crichton, Alkerwi and Elias44–Reference Mattei, Malik and Hu46) , and four studies were conducted in children and adolescents(Reference Lin, Lee and Tsai20,Reference Mirmiran, Yuzbashian and Asghari36,Reference Hooshmand, Asghari and Yuzbashian38,Reference Chan, Lin and Huang43) . All the studies analysed both sexes, and three studies performed sex-specific analysis(Reference Lin, Lee and Tsai20,Reference Kang and Kim21,Reference Chan, Lin and Huang43) . In all, thirteen studies defined MetS based on National Cholesterol Education Program Adult Treatment Panel III (NCEP ATP III) guidelines(Reference Dhingra, Sullivan and Jacques17,Reference Nettleton, Lutsey and Wang19,Reference Kang and Kim21,Reference Lopez-Molina, Parra-Cabrera and Lopez-Ridaura39,Reference Denova-Gutiérrez, Talavera and Huitrón-Bravo40,Reference Crichton, Alkerwi and Elias44–Reference Mattei, Malik and Hu46) . Analysis of study quality yielded an average NOS score of eight for longitudinal study and seven for case–control study and an average AHRQ score of seven for cross-sectional study.
The total sweetened beverage–metabolic syndrome association
The results suggested a 51 % (RR 1·51, 95 % CI 1·34, 1·69) increase in the risk of MetS for individuals with high TSB consumption group (Fig. 2a), including twenty studies(Reference Dhingra, Sullivan and Jacques17–Reference Kang and Kim21,Reference Mirmiran, Yuzbashian and Asghari36,Reference Ferreira-Pêgo, Babio and Bes-Rastrollo37,Reference Lopez-Molina, Parra-Cabrera and Lopez-Ridaura39,Reference Denova-Gutiérrez, Talavera and Huitrón-Bravo40,Reference Chan, Lin and Huang43–Reference Mattei, Malik and Hu46) .
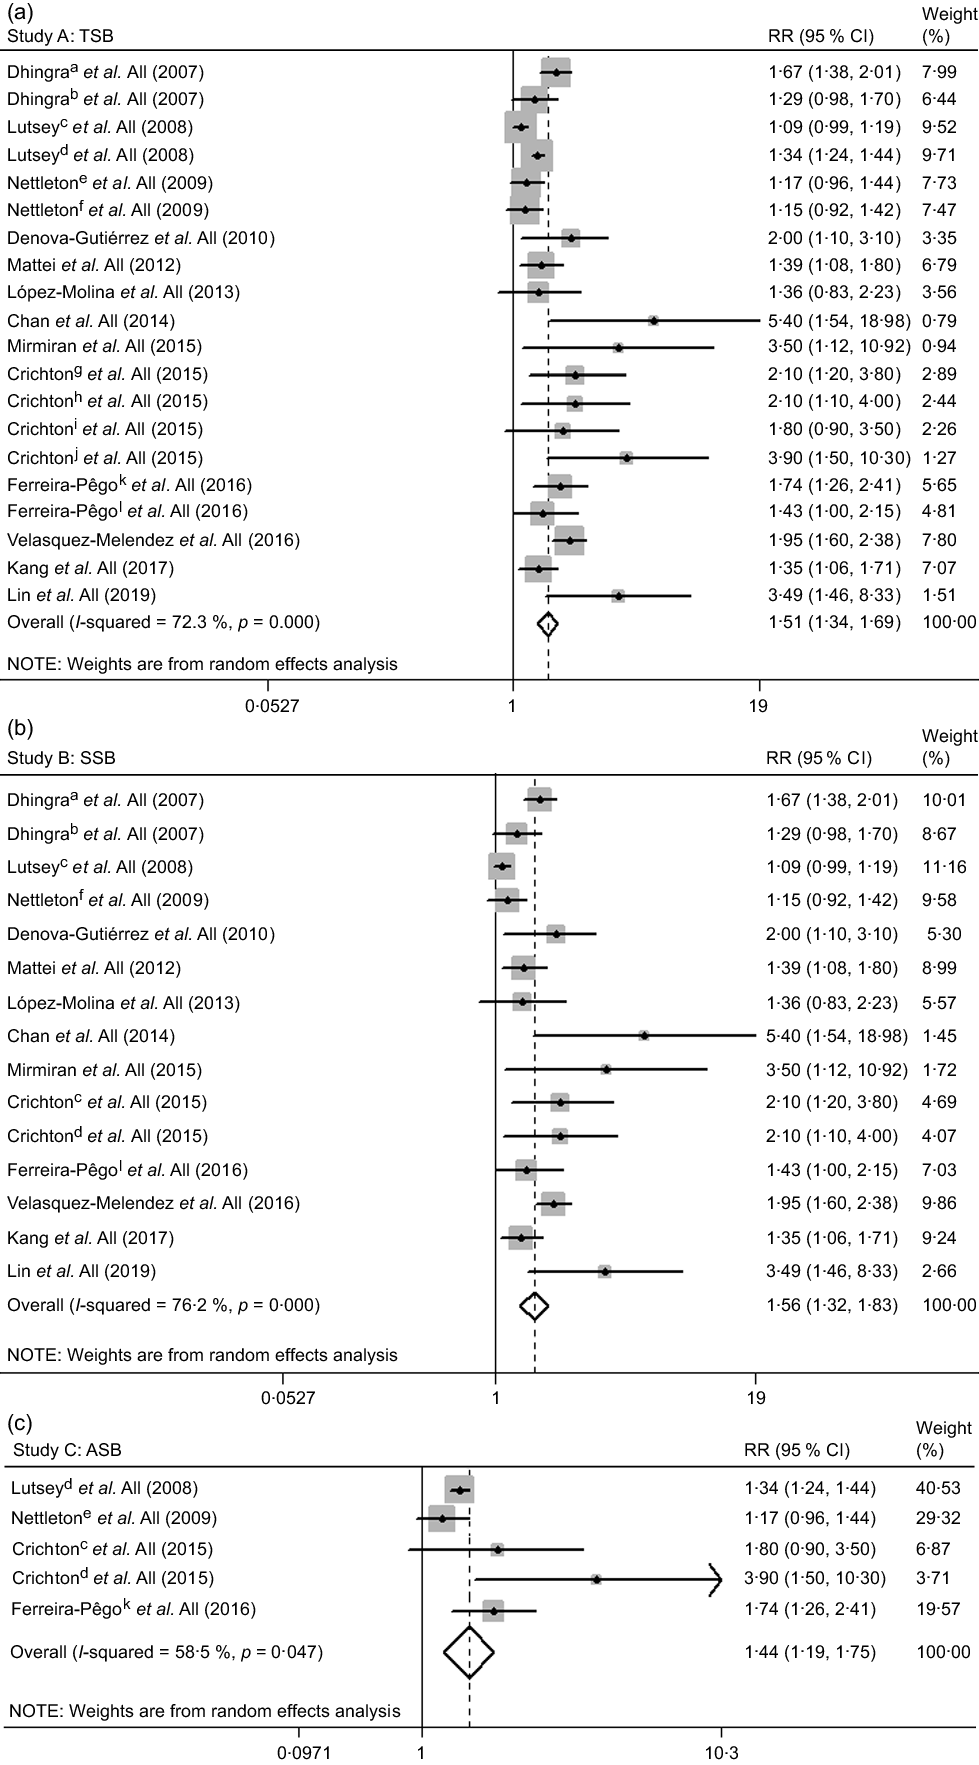
Fig. 2 The association between high total sweetened beverage (a), SSB (b) and ASB (c) consumption groups and the risk of metabolic syndrome. a, cross-sectional study; b, longitudinal study; c, SSB; d, ASB; e, ASB; f, SSB; g, SSB in the Maine-Syracuse Longitudinal Study; h, ASB in the Maine-Syracuse Longitudinal Study; i, SSB in the Observation of Cardiovascular Risk Factors in Luxembourg Study; j, ASB in the Observation of Cardiovascular Risk Factors in Luxembourg Study; k, SSB; l, ASB. ASB, artificially sweetened beverages; RR, relative risk; SSB, sugar-sweetened beverages; TSB, total sweetened beverages
We found similar results in most subgroups. Lower heterogeneity was observed among studies of Europeans, with cross-sectional design, with adjustment for alcohol drinking and without adjustment for education and tobacco smoking (Table 1). Publication bias by Egger’s test was found (P = 0·002). The strength of the TSB–MetS association was attenuated by the trim-and-fill method (RR 1·31, 95 % CI 1·16, 1·48). The results remained similar to the initial analysis during the sensitivity analyses (data not shown).
Table 1 Subgroup associations between high total, sugar and artificially sweetened beverage consumption groups and the risk of metabolic syndrome
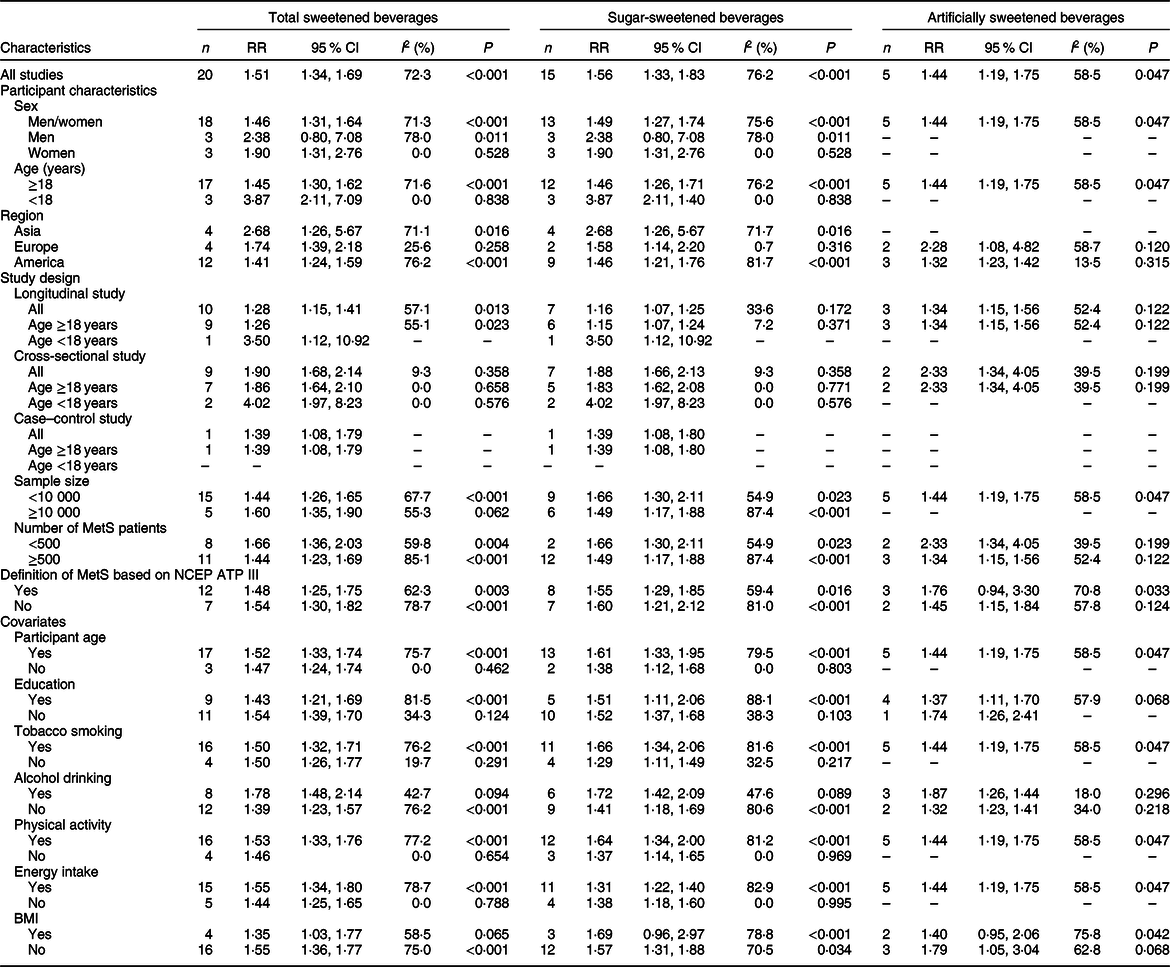
MetS, metabolic syndrome; NCEP ATP III, National Cholesterol Education Program Adult Treatment Panel III; RR, relative risk; –, not applicable.
The total sweetened beverage–metabolic syndrome dose–response association
We included data from nineteen studies(Reference Dhingra, Sullivan and Jacques17,Reference Nettleton, Lutsey and Wang19–Reference Kang and Kim21,Reference Høstmark35,Reference Ferreira-Pêgo, Babio and Bes-Rastrollo37,Reference Hooshmand, Asghari and Yuzbashian38,Reference Denova-Gutiérrez, Talavera and Huitrón-Bravo40–Reference Mattei, Malik and Hu46) in the dose–response analysis of the TSB–MetS association. The risk of MetS increased by 20 % (RR 1·20, 95 % CI 1·13, 1·28) with a 250-ml/d increase in TSB consumption, with high heterogeneity (I 2 = 72·8 %; P heterogeneity < 0·001; Fig. 3a).

Fig. 3 Forest plot of study-specific relative risk statistics for the risk of metabolic syndrome per 250 ml/d increase in total sweetened beverage (a), SSB (b) and ASB (c) consumption. a, cross-sectional study; b, longitudinal study; c, SSB in the Maine-Syracuse Longitudinal Study; d, ASB in the Maine-Syracuse Longitudinal Study; e, SSB in the Observation of Cardiovascular Risk Factors in Luxembourg Study; f, ASB in the Observation of Cardiovascular Risk Factors in Luxembourg Study; g, SSB; h, ASB. ASB, artificially sweetened beverages; RR, relative risk; SSB, sugar-sweetened beverages; TSB, total sweetened beverages
The results were not substantial differences in most subgroups. Additionally, heterogeneity appeared lower among studies of Europeans, with adjustment for alcohol drinking and without adjustment for participant age, physical activity and energy intake (Table 2). We detected publication bias by Egger’s test (P = 0·041). When we used the trim-and-fill method, the initial result was attenuated but remained significant (RR 1·12, 95 % CI 1·04, 1·20). During the sensitivity analyses, the sizes and directions of the pooled estimates remained similar (data not shown).
Table 2 Dose–response subgroup associations between total, sugar and artificially sweetened beverage consumption (per 250 ml/d increment) and the risk of metabolic syndrome
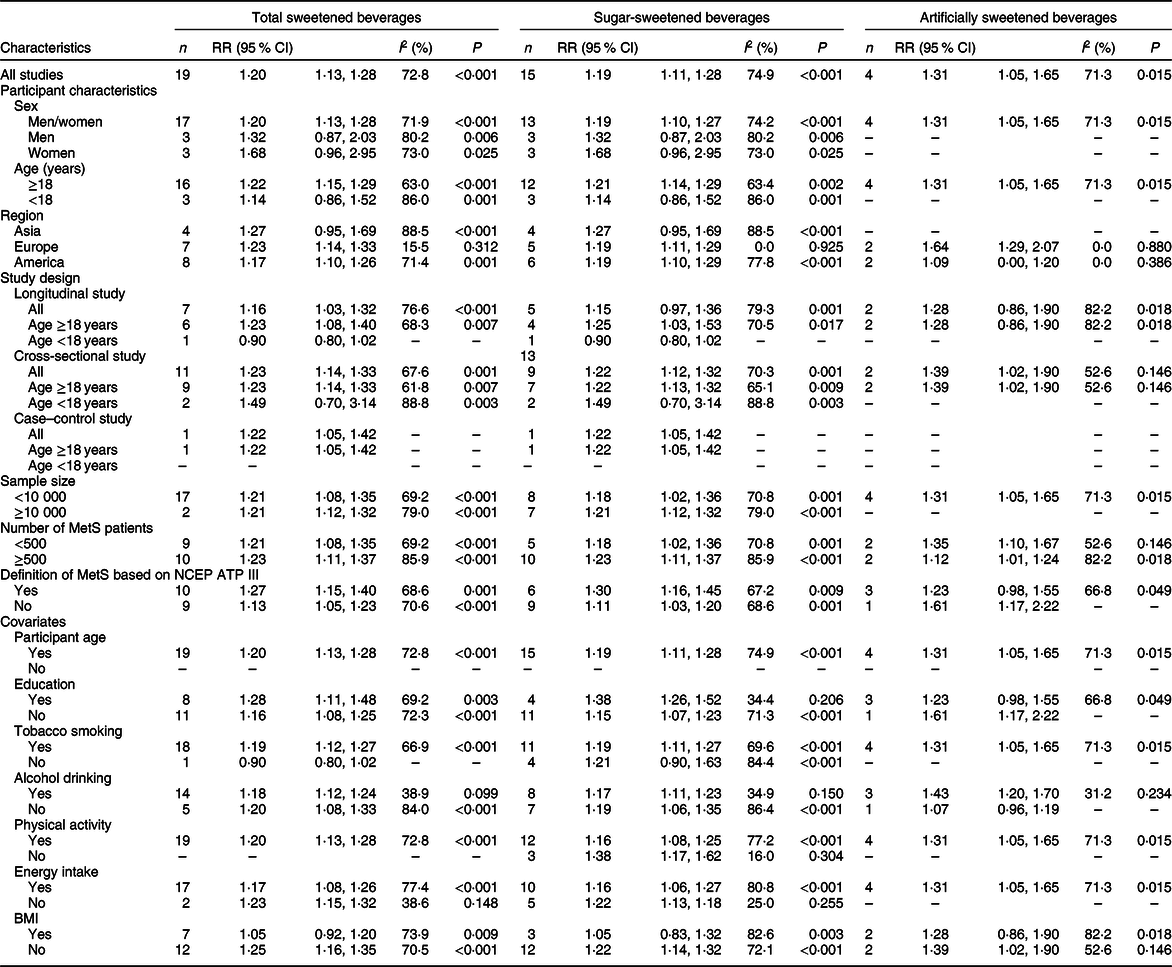
MetS, metabolic syndrome; NCEP ATP III, National Cholesterol Education Program Adult Treatment Panel III; RR, relative risk; –, not applicable.
After excluding four studies(Reference Høstmark35,Reference Hooshmand, Asghari and Yuzbashian38,Reference Høstmark and Haug41,Reference Grosso, Marventano and Galvano42) that reported only continuous risk estimates, we found a non-linear TSB–MetS association (P nonlinearity = 0·003; Fig. 4a), in which the trend suggested no change when TSB consumption was over 400 ml/d. In addition, the linear and positive TSB–MetS dose–response associations persisted in most subgroups, including studies among men, women, children and adolescents, those conducted in Asia and Europe, longitudinal studies based on all people and adult populations, and definition of MetS not based on NCEP ATP III (see online supplementary material, Supplemental Fig. 1).

Fig. 4 Dose–response association between total sweetened beverage (a), SSB (b) and ASB (c) consumption and the risk of metabolic syndrome that was assessed using a restricted cubic splines model. ASB, artificially sweetened beverages; RR, relative risk; SSB, sugar-sweetened beverages; TSB, total sweetened beverages
The sugar-sweetened beverage–metabolic syndrome association
The meta-analysis of fifteen studies(Reference Dhingra, Sullivan and Jacques17–Reference Kang and Kim21,Reference Mirmiran, Yuzbashian and Asghari36,Reference Ferreira-Pêgo, Babio and Bes-Rastrollo37,Reference Lopez-Molina, Parra-Cabrera and Lopez-Ridaura39,Reference Denova-Gutiérrez, Talavera and Huitrón-Bravo40,Reference Chan, Lin and Huang43–Reference Mattei, Malik and Hu46) suggested a 56 % (RR 1·56, 95 % CI 1·32, 1·83) increase in the risk of MetS for high SSB consumption group (Fig. 2b).
The results did not change in most subgroup analyses (Table 1). The heterogeneity appeared to be lower among subgroups, as mentioned above in the TSB–MetS association section. We observed publication bias by Egger’s test (P = 0·003). The initial result was attenuated but remained significant using the trim-and-fill method (RR 1·27, 95 % CI 1·08, 1·51). The results did not substantially change on sensitivity analyses (data not shown).
The sugar-sweetened beverage–metabolic syndrome dose–response association
Fifteen studies(Reference Dhingra, Sullivan and Jacques17,Reference Lin, Lee and Tsai20,Reference Kang and Kim21,Reference Høstmark35,Reference Ferreira-Pêgo, Babio and Bes-Rastrollo37,Reference Hooshmand, Asghari and Yuzbashian38,Reference Denova-Gutiérrez, Talavera and Huitrón-Bravo40–Reference Mattei, Malik and Hu46) reported the SSB–MetS association. The risk of MetS attributable to SSB consumption with a 250-mL/day increment was 19 % (RR 1·19, 95 % CI 1·11, 1·28; I 2 = 74·9 %; P heterogeneity < 0·001; Fig. 3b).
We did not observe substantial differences in most subgroups, and heterogeneity appeared lower among studies, as mentioned above in the TSB–MetS association section (Table 2). No publication bias was detected by Egger’s test (P = 0·143), and no substantial changes were observed in sensitivity analyses (data not shown).
A non-linear SSB–MetS association was identified (P nonlinearity = 0·009; Fig. 4b), in which the trend suggested that the curve remained parallel to the X-axis when SSB consumption was over 400 ml/d. The curve shape remained similar to the initial analyses in the non-linear, dose–response analysis restricted to studies with adult populations, or Americans, cross-sectional studies based on all people and adult population, studies with sample sizes ≥10 000, studies with MetS patient numbers ≥500 and studies with the definition of MetS based on NCEP ATP III. However, by restricting the analysis to studies with sample size <10 000 or number of MetS patients <500, the risk of MetS decreased with increasing SSB. Additionally, the results indicated a linear association among studies with men, women, children and adolescents, Asians, Europeans, longitudinal studies based on all people and adult populations, and definition of MetS not based on NCEP ATP III (see online supplementary material, Supplemental Fig. 2).
The artificially sweetened beverage–metabolic syndrome association
The risk of MetS was increased 44 % for high ASB consumption group (RR 1·44, 95 % CI 1·19, 1·75) (Fig. 2c), including five studies(Reference Lutsey, Steffen and Stevens18,Reference Nettleton, Lutsey and Wang19,Reference Ferreira-Pêgo, Babio and Bes-Rastrollo37,Reference Crichton, Alkerwi and Elias44) .
No significant differences in heterogeneity occurred among the subgroup analyses. Heterogeneity appeared lower among studies with cross-sectional design, with MetS patient numbers <500, with adjustment for alcohol drinking and without adjustment for BMI (Table 1). The results by Egger’s test indicated no publication bias (P = 0·238), and we did not observe substantial changes on sensitivity analyses (data not shown).
The artificially sweetened beverage–metabolic syndrome dose–response association
The pooled RR for a 250-ml/d increase in ASB consumption was 1·31 (95 % CI 1·05, 1·65), and high heterogeneity was found (I 2 = 71·3 %; P heterogeneity = 0·015; Fig. 3c).
No substantial differences in most subgroups were observed. Lower heterogeneity was detected in studies as mentioned above in the ASB–MetS association section (Table 2). In addition, evidence of publication bias was found (Egger’s test P = 0·051). The initial result was non-significant when the trim-and-fill method was used (RR 1·11, 95 % CI 0·88, 1·39). Additionally, we did not observe substantial changes on sensitivity analyses (data not shown).
We found no evidence of a non-linear ASB–MetS association (P nonlinearity = 0·367) including four studies(Reference Nettleton, Lutsey and Wang19,Reference Ferreira-Pêgo, Babio and Bes-Rastrollo37,Reference Crichton, Alkerwi and Elias44) , and the risk of MetS increased with increasing ASB consumption (Fig. 4c).
Discussion
Based on the results from 24 population-based epidemiological studies, including 93 095 participants and 20 749 MetS patients, the findings from our meta-analysis showed positive TSB–MetS, SSB–MetS and ASB–MetS associations, with the risk of MetS increased by 20 %, 19 % and 31 % per 250 ml/d increase in TSB, SSB and ASB consumption, respectively. Additionally, we observed non-linear, TSB–MetS and SSB–MetS dose–response associations and a linear ASB–MetS dose–response association.
The data from a published meta-analysis that included only three longitudinal studies suggested that people with high SSB consumption group had increased risk of MetS, but this study did not conduct the subgroup analyses to discuss heterogeneity source and dose–response association(Reference Malik, Popkin and Bray10). Another meta-analysis, which included eight cross-sectional studies and four longitudinal studies, indicated that the risk of MetS increased for high SSB and ASB consumption group, but dose-related health effect is unclear(Reference Narain, Kwok and Mamas22). Moreover, other review articles and meta-analyses drew similar conclusions but not performed dose–response analyses(Reference Sonestedt, Øverby and Laaksonen23–Reference Green and Syn25,Reference Azad, Abou-Setta and Chauhan47) . Additionally, previous research had a major focus on the SSB–MetS association, but people paid little attention to the ASB–MetS association(Reference Narain, Kwok and Mamas22).
In summary, the results of the previous meta-analyses were consistent with the present study; however, these meta-analyses only focused on the traditional binary analysis. Evidence from our meta-analysis suggested the risk of MetS increased with increasing TSB, SSB and ASB consumption per 250 ml/d and provided dose–response associations on the topic. In addition, we combined SSB and ASB to further explore the TSB–MetS association. Moreover, the TSB–MetS, SSB–MetS and ASB–MetS relationship may be mediated in part by energy intake(Reference Malik, Popkin and Bray10), and we observed that the pooled RR showed a slight reduction after adjusting for energy intake in subgroup analyses.
Multiple potential biological mechanisms have been suggested to explain the positive association between the consumption of SSB and ASB and the risk of MetS. Considering MetS as a cluster of metabolic abnormalities highly associated with type 2 diabetes mellitus and CVD, MetS occurs together with these diseases half the time rather than alone(Reference Alberti, Eckel and Grundy48). We explain the plausible mechanisms based on the association between the consumption of SSB and ASB and the risk of different metabolic outcomes. SSB consumption could result in weight gain associated with higher risk of obesity by decreasing satiety or an incomplete compensatory reduction in energy intake at subsequent meals following ingestion of liquid energies(Reference Malik, Popkin and Bray12,Reference Hu and Malik13,Reference Stanhope49) . Additionally, the positive ASB–MetS association may be driven by waist circumference(Reference Pereira and Odegaard50,Reference Duffey, Steffen and Van Horn51) . Another explanation could be that SSB consumption contributes to rapidly absorbable carbohydrates, such as high-fructose maize syrups or sucrose(Reference Hu and Malik13). SSB consumption could cause a rapid rise in blood glucose and insulin levels and induce a high dietary load of plasma glucose associated with higher risk of type 2 diabetes mellitus(Reference Tey, Salleh and Henry52,Reference Livesey, Taylor and Livesey53) . The excessive consumption of fructose from SSB may increase the risk of metabolic disease by increasing hepatic de novo lipogenesis, atherogenic dyslipidaemia and insulin resistance(Reference Malik and Hu15). Additionally, the production increase in serum uric acid in liver induced hyperuricaemia is directly related to fructose(Reference Tappy and Rosset54), and fructose-induced hyperuricaemia is associated with the risk of MetS(Reference Short, Nakagawa and Tuttle55). In addition, fructose is preferentially metabolised to lipid in the liver, leading to dyslipidaemia(Reference Havel56,Reference Basciano57) . The mechanism is complex and needs to be further confirmed by future research.
Moreover, we observed a positive SSB–MetS and/or ASB–MetS association based on the epidemiologic data; however, in isolation, these findings do not prove causality. Three randomised controlled trials showed that SSB consumption had unfavourable health effects on weight gain, fasting plasma glucose levels and lipid metabolism(Reference Aeberli, Gerber and Hochuli58–Reference Malik, Pan and Willett60), which could provide experimental evidence that changing SSB consumption would actually reduce the risk of MetS. SSB consumption may play a substantial role as a single or additive treatment for MetS. Additional studies are needed to determine the effect of the consumption of SSB and/or ASB on the risk of MetS, and this is the action that we ourselves are taking.
Strengths and limitations
The first strength of the present meta-analysis is in exploring the separate and merged association between the consumption of SSB and ASB and the risk of MetS. Second, a strength of this study is that, to the best of our knowledge, it estimates, for the first time, the risk of MetS with different exposures and doses using the dose–response meta-analysis. Additionally, the differences in definition of MetS are minor, although variation exists among different health care organisations, and we performed subgroup analyses based on the definition of MetS. Moreover, our meta-analysis excluded some studies with incomplete data compared with the previous meta-analyses and updated some important studies and additional original articles published in recent years missed in the previous meta-analyses.
Our study also contains some limitations. Primarily, we could not establish causality because of the population-based epidemiological study design. The second is that the populations were mainly Asian, European and American, and thus, the findings of our meta-analysis may not be applicable to other populations. Third, we did not fully examine the ASB–MetS association due to the limited number of population-based epidemiological studies. Fourth, heterogeneity is high, but the associations persisted on most subgroup and sensitivity analyses. Fifth, the dietary assessment method of all included studies was self-reported, which could result in underestimating the risk of MetS. Finally, we cannot completely exclude confounding, although the extracted risk estimates are the result of final adjustments in the original article.
Conclusions
Higher consumption of TSB, SSB and ASB was positively associated with an increase in the risk of MetS; these associations were especially observed in adults. The present findings could have important implications for public health. The available evidence potentially supports a reduction in sweetened beverage consumption and could be valuable for the prevention and management of MetS. However, dietary habits are difficult to change, requiring the concerted efforts of the country, society, health workers and individuals to enable people to make healthy choices. There are established benefits of substitution from sweetened beverages to milk or water. Specific recommendations for optimal consumption of sweetened beverage consumption or healthy beverage alternatives are still required to translate these findings into practical strategies for clinicians working with MetS patients.
Acknowledgements
Acknowledgements: The investigators are grateful for the dedicated participants and all research staff who participated in the study. Financial support: This work was supported by the National Key R&D Program of China (grant number 2017YFC0907301) and the Research Fund for the Postgraduate Program of Guizhou Medical University (grant number YJSCXJH(2019)008). Conflict of interest: There are no conflicts of interest. Authorship: The authors’ responsibilities were as follows: X.Z. and X.L. conceived the study and designed the search strategy; X.Z., X.L., L.L., F.H., H.Z., L.C., J.Z. and Y.J. conducted the study selection, data extraction, the data analysis and interpretation of results, and evaluated the risk of bias of included studies; X.Z. and X.L. wrote the first draft of the manuscript; J.Z. and P.L. revised the manuscript; and all authors read and approved the final version of the manuscript. Ethics of human subject participation: Not applicable.
Supplementary material
For supplementary material accompanying this, paper visit https://doi.org/10.1017/S1368980020003614


