


Non-communicable diseases (NCD), such as cardiovascular diseases (CVD), diabetes and chronic respiratory diseases, are the leading cause of mortality, equivalent to 71 % of deaths worldwide, and are projected to increase even further, reaching 52 million deaths by 2030(Reference Mendis, Armstrong and Bettcher1).
Risk factors for NCD include both social factors (poverty, education and stress) and biological factors (e.g. genetic predisposition; foetal epigenetic changes with life-course consequence): the former highly affects lifestyle factors such as diet and physical activity(Reference Ajay, Watkins, Prabhakaran, Prabhakaran, Anand and Gaziano2). Early life malnutrition, which in this review is defined as the first 5 years of postnatal life, is also a key risk factor for NCD and refers to insufficient energy- and/or nutrient intake; but also refers to an excessive and imbalanced energy intake, often resulting in overweight or obesity(Reference Branca, Lartey and Oenema3). For assessing nutritional status in children and adults, anthropometric indicators of growth and body size such as weight-for-height (WHZ), weight-for-age (WAZ), BMI and mid-upper arm circumference (MUAC) amongst others are commonly used(Reference Vijayaraghavan4). However, there is growing evidence that anthropometry alone has limitations in describing nutrition-related risk (of morbidity/mortality)(Reference Kerac, McGrath and Connell5). Body composition measures are attracting interest as potentially much better indicators of both short-(Reference Wells6) and long-term risk(Reference Owino, Murphy-Alford and Kerac7,Reference Kumaran, Lubree and Bhat8) . Measures of body composition vary from those related to anthropometry, e.g waist circumference (WC); waist-hip ratio and skinfold (SF) thickness, to indirect measures such as bioelectrical impedance analysis (BIA) to more direct measures such as dual-energy X-ray absorptiometry (DXA/DEXA) scan, isotope dilution or densitometry(Reference Wells and Fewtrell9).
There is extensive evidence that exposure to in-utero undernutrition increases the risk of NCD in later life(Reference Pullar, Wickramasinghe and Demaio10–Reference Forsén, Eriksson and Tuomilehto12) and that being overweight in adulthood also increases the risk of NCD(Reference Pineda, Sanchez-Romero and Brown13,Reference Bogers, Bemelmans and Hoogenveen14) . There is also emerging evidence relating to childhood exposures(Reference Wells, Sawaya and Wibaek15), one recent review found that ‘exposure to severe malnutrition or famine in childhood was consistently associated with increased risk of CVD, hypertension, impaired glucose metabolism and metabolic syndrome in later life’(Reference Grey, Gonzales and Abera16). In attempts to better understand the link between such episodes of early-life malnutrition to later-life health and NCD, an increasing number of studies are assessing body composition in childhood(Reference Fabiansen, Cichon and Yaméogo17,Reference Lelijveld, Musyoki and Adongo18) . Whilst plausible(Reference Wells19), the links between body composition in early life and later-life NCD are not currently well understood(Reference Ford, Martorell and Mehta20–Reference Park, Falconer and Viner25). Moreover, this linkage has not been evaluated through a systematic review: previous work focuses on early-life anthropmetry and NCD rather than body composition and NCD. This represents a major evidence gap, since anthropometry alone is a relatively crude measure of nutrition and growth. It does not, for example, reflect the fact that two similar-sized individuals can have very different percentages of underlying fat and muscle mass(Reference Yajnik and Yudkin26). This matters because both fat and muscle are metabolically active organs and have a bearing on an individuals’ physiology, metabolism and in turn risks of health and disease. Hence, understanding body composition in early childhood rather than body size alone may transform our understanding of the mechanisms by which early undernutrition affects later life NCD risk. Such understanding is particularly important to those in the global child nutrition community where a traditional focus of malnutrition treatment programmes has been on regaining as much weight as quickly as possible. This may have implications for short-term body composition(Reference Lelijveld, Musyoki and Adongo18) and in turn for long-term adult NCD risk. Potential policy implications include greater focus on healthy growth rather than just growth alone in programmes managing child malnutrition.
Our review thus aims to synthesise evidence on early life body composition and long-term cardiometabolic health and examine which measures of body composition best predict the risk of NCD.
Materials and methods
The PRISMA (Preferred Reporting Items for Systematic review and Meta-Analysis) protocol was used for this systematic review(Reference Moher, Liberati and Tetzlaff27).
Inclusion/exclusion criteria
Inclusion criteria were based on PICOS outline:
-
Population: Subjects who had nutritional status (BMI or body composition) measured at baseline at any time from birth up to 5 years of age with a follow-up time ≥ 10 years.
-
Intervention/exposure: Exposure to any of the following body composition measurements: SF, BIA, dual-energy X-ray absorptiometry (DXA/DEXA) scan, isotope dilution and PEA POD air displacement plethysmography. Despite only being proxy indicators of body composition, we also included BMI and Ponderal index (PI) (measures of weight relative to height).
-
Comparator/control: Studies with and without a control group are included.
-
Outcome: Cardiometabolic NCD (coronary artery disease, type 2 diabetes, metabolic syndrome (MetS)) and their associated risk factors (obesity, blood pressure (BP), blood glucose levels, lipid levels, WC) were measured ≥ 10 years after exposure.
-
Study design: All study designs were considered eligible.
The review excluded studies with a high-risk study population, grey literature, unpublished studies, reviews, non-human studies and studies not published in English, in full format and before 1990.
Search strategy
The search was completed independently by two authors in three databases: Embase Classic + Embase, Ovid MEDLINE (R) and In-Process & Other non-Indexed Citations and Daily, and Global Health. The final search was conducted on 27 July 2020. A detailed search strategy is shown in Appendix A.
Study selection
All records generated from the search were imported into Mendeley Reference Manager (version 1·19·4) and were screened by title and abstract. Articles that were deemed relevant or where more information was needed to determine relevance were screened by full text.
Data extraction
A data extraction form developed for this review was used to extract information from eligible studies. When obtainable, the following information was extracted: author, year, title, country, study design, sample size, percentage female, inclusion and exclusion criteria, type of exposure and assessment method, type of outcome and assessment method, years of follow-up, adjustment for current body size, key findings and strength of evidence (a judgement made by us based on numerous factors including study type, quality/risk of bias and certainty of results).
Data analysis
Due to heterogeneity amongst studies identified, the analysis is presented as a narrative synthesis. Results from high-income countries and low- and middle-income countries are analysed separately and should not be compared.
Assessing risk of bias
An individual risk of bias assessment for each study was determined using the ‘Quality appraisal checklist for quantitative studies reporting correlation and associations’ in ‘Methods for the development of NICE public health guidance’(28).
Study protocol
A pre-registered protocol for this review can be found at: https://www.crd.york.ac.uk/prospero/display_record.php?RecordID = 188 393
Results
Study selection
Selection process and search results are presented in Fig. 1. The search generated 5772 records. Following deduplication and initial screening of titles and abstract, seventy-eight articles were eligible for full-text review. Of these, forty-nine did not meet the inclusion criteria which led to a total of twenty-nine studies included in the review.
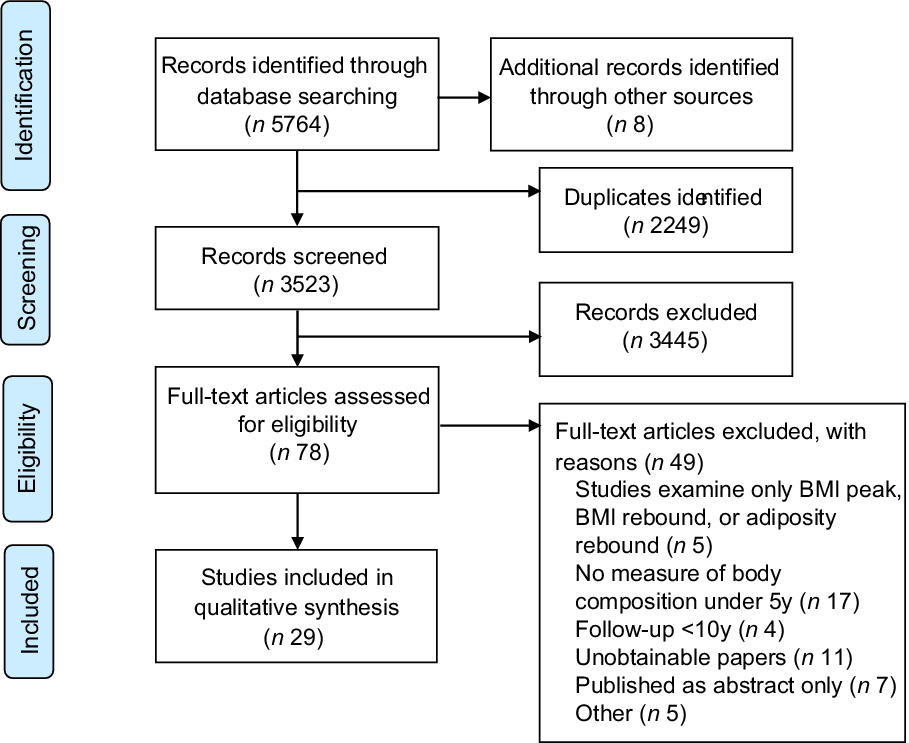
Fig. 1 Study selection flow diagram
Study characteristics
Study characteristics are presented in Table 1. Most studies were from high-income countries (n 21, 72 %), and all but one study used BMI as the indicator of early life exposure/body composition (n 28, 97 %). Few studies (n 7, 25 %) used an additional indictor, which was either PI (n 4, 40 %) or SF thickness (n 3, 38 %). No studies used direct measures of body composition: BIA, (DXA/DEXA) scan, isotope dilution and PEA POD air displacement plethysmography.
Table 1 Study characteristics of included studies
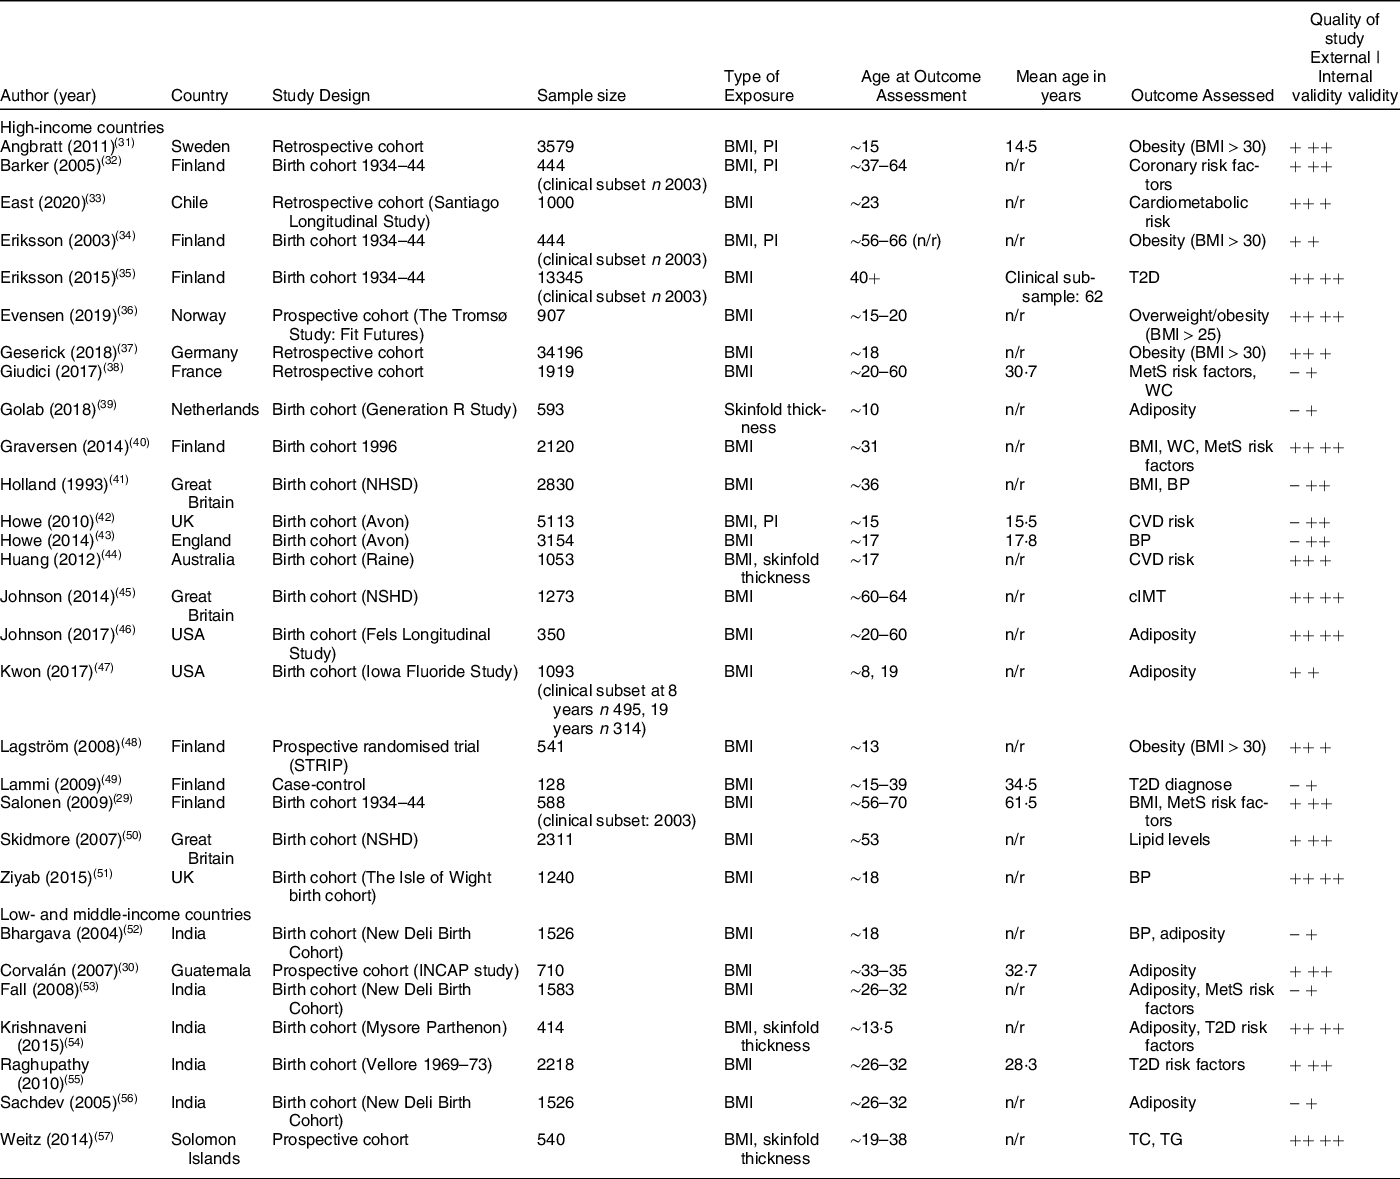
BMI: body mass index; BP: blood pressure; cIMT: carotid intima-media thickness; MetS: metabolic syndrome; n/r: not reported; TC: total cholesterol; TG: total glucose; T2D: type 2 diabetes; PI: Ponderal index; WC: waist circumference.
(++) means ‘good quality of study’, (+) means ‘adequate quality of study’, (-) means ‘poor quality of study’.
Sample size included in the analysis ranged from 128 to 34 196 participants. Participants were most often drawn from existing cohorts (of which nineteen were birth cohorts), and four studies from high-income countries recruited the study population from health care registers from the respective countries. All studies were representative cohorts, although the study population in one Finnish study were exclusively normal weight in adulthood(Reference Salonen, Kajantie and Osmond29) and the Guatemalan study population had a high prevalence of stunting (53 % stunted by age 7)(Reference Corvalán, Gregory and Ramirez-Zea30).
Studies included in the review were a mix of good, adequate and poor quality. External validity for nine studies was rated to be of poor quality due to various reasons, e.g. reduced power and significant proven differences between study population and participants who were lost to follow-up.
Synthesis of results
Tables 2–5 present a summary of included studies reporting on CVD outcomes, glucose metablisme, MetS outcomes and obesity-related outcomes respectively. A detailed summary of all studies can be found in Appendix B. The following section describes the results of the included studies.
Table 2 Summary of studies reporting on CVD outcomes
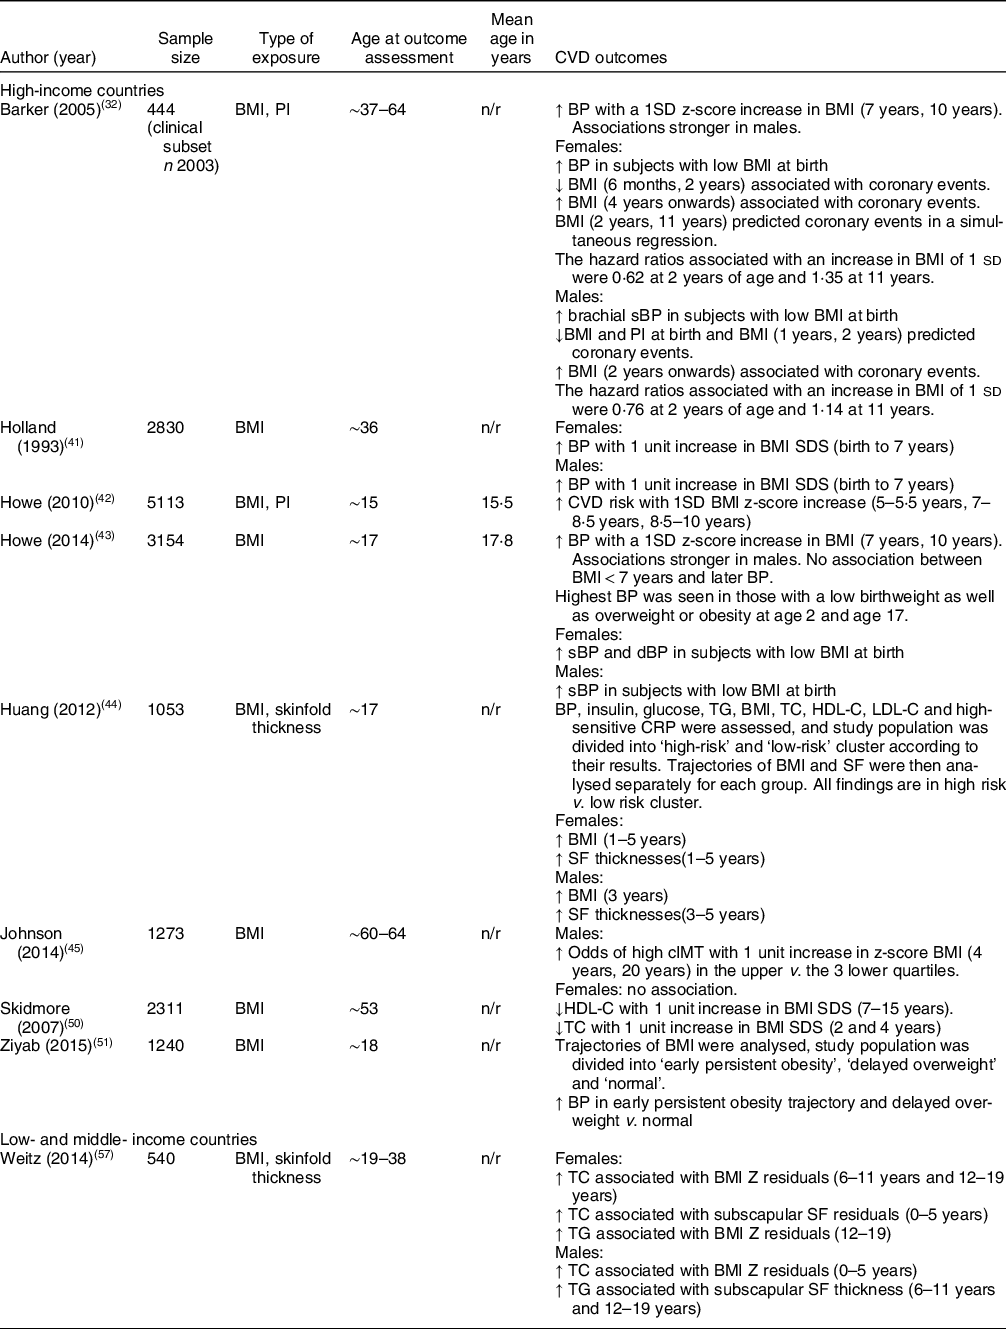
BP: blood pressure; cIMT: carotid intima-media thickness; dBP: diastolic blood pressure; HDL-C: HDL-cholesterol; HR: hazard ratio; n: sample size included in analysis; n/r: not reported; PI: Ponderal index; sBP: systolic blood pressure; SDS: standard deviation score; SF: skinfold; TC: total cholesterol; TG: total glucose.
↑ = increased;↓ = decreased.
Table 3 Summary of studies reporting on glucose metabolism outcomes
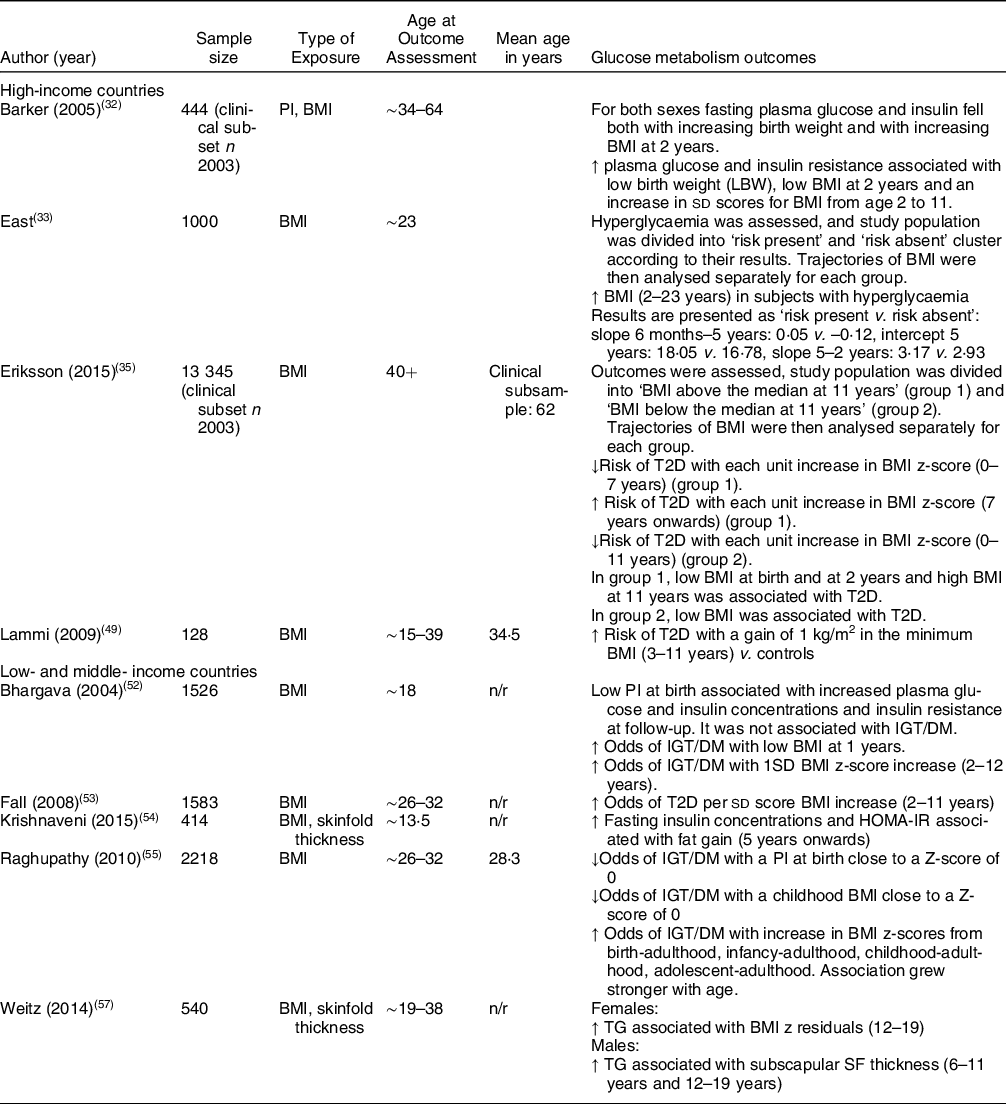
DM: diabetes mellitus; HOMA-IR: Homeostatic Model Assesment for Insulin Resistance; IGT: impaired glucose tolerance; LBW: low birth weight; n: sample size included in analysis; n/r: not reported; SDS: standard deviation score; SF: skinfold; TG: total glucose; T2D: type 2 diabetes.
↑ = increased;↓ = decreased.
Table 4 Summary of studies reporting on metabolic syndrome outcomes
a: adult; BP: blood pressure; HDL-C: HDL-cholesterol; MetS: metabolic syndrome n; sample size included in analysis; n/r: not reported; WC: waist circumference.
↑ = increased;↓ = decreased.
Table 5 Summary of studies reporting on obesity-related outcomes
a: adult ; FM: fat mass; FFMI: fat-free mass index; FM: fat mass; FMI: fat mass index; n; sample size included in analysis; n/r: not reported; PI: Ponderal index; SF: skinfold; WC: waist circumference.
↑ = increased; ↓ = decreased.
Cardiovascular outcomes (Table 2)
High-income countries
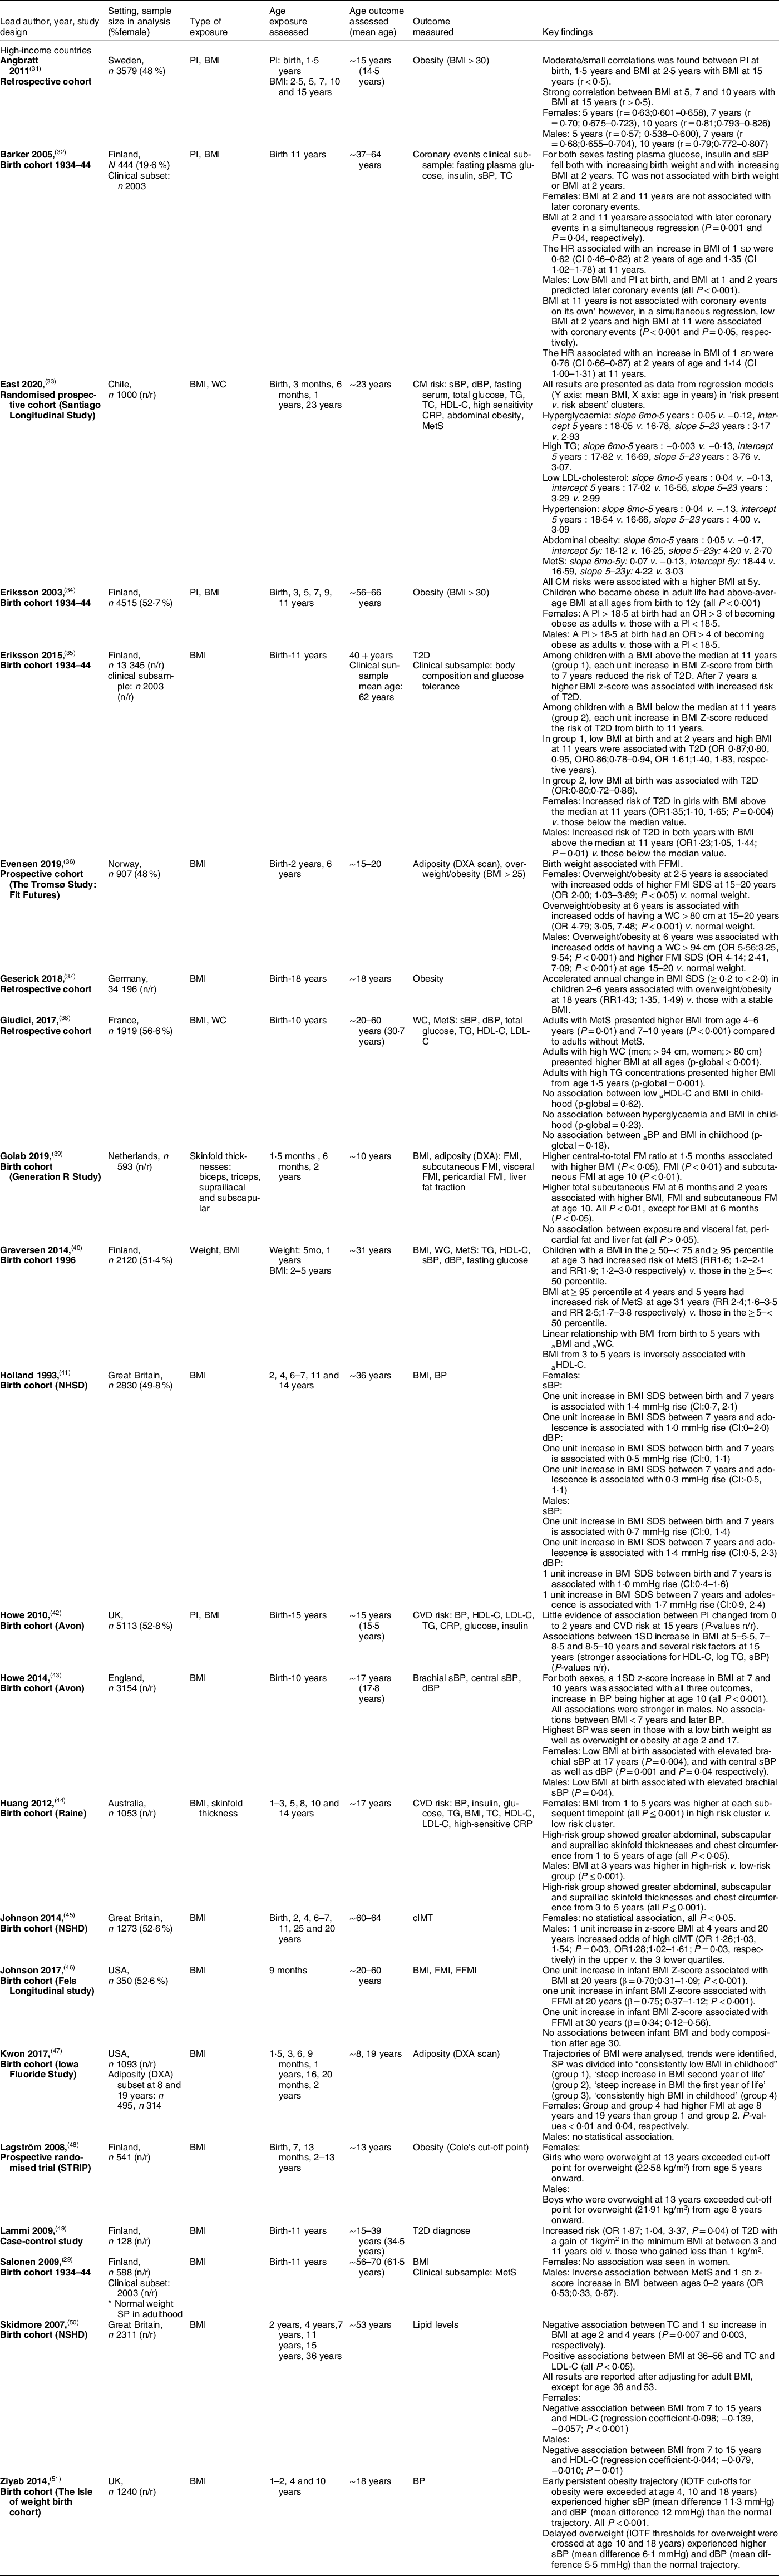
A study looking at CVD risk found that females who had increased BMI and SF thicknesses from ages 1 to 5 years had increased risk of CVD (BMI: P < 0·001; SF thicknesses: P < 0·05). High-risk males had increased BMI at 3 years (P < 0·001) and increased SF thicknesses from 3 to 5 years (P < 0·001)(Reference Huang, Mori and Burrows44). Another study reporting on CVD risk did not find any association before 5 years, but reported that increased BMI in later childhood was associated with increased CVD risk(Reference Howe, Tilling and Benfield42).
Four studies reported on BP. One found that low BMI at birth was associated with increased BP. The researchers also found that there was no association between BMI below 7 years and later BP; however, those subjects with the highest BP had a low birthweight and were overweight or obese at age 2 and time of exposure(Reference Howe, Chaturvedi and Lawlor43). Another reported that a one unit increase in BMI standard deviation score (SDS) from birth to 7 years was associated with elevated BP. Changes in systolic blood pressure were greater in females than in males (1·4 mmHg v. 0·7 mmHg), but in contrast diastolic blood pressure was greater in males than in females (1·0 mmHg v. 0·5 mmHg)(Reference Holland, Stark and Ades41). Another study measuring BP reported that children who became obese early in life and who had a delayed overweight (overweight at 10 and 18 years) had higher BP at follow-up than those with a healthy weight in childhood (all P < 0·001)(Reference Ziyab, Karmaus and Kurukulaaratchy51). A Finnish study found that systolic blood pressure fell both with increasing birth weight and increasing BMI at 2 years. The researchers also reported on the prevalence of coronary events and found that adults who experienced coronary events were smaller than average at birth and had a BMI below average at age 2. After age 2 and 4 (for boys and girls, respectively), their BMI increased progressively. The authors concluded that ‘The risk of coronary events was more strongly related to the tempo of childhood gain in BMI than to the BMI attained at any particular age’(Reference Barker, Osmond and Forsén32).
Results from a British cohort examined carotid intima-media thickness and grouped the study populations (male and female) into quartiles. Boys with a BMI in the upper quartiles had increased odds of high carotid intima-media thickness with 1 unit increase in z-score BMI at 4 years (OR1·26; P = 0·03) v. boys with a BMI in the three lower quartiles. They found no such association in girls (P > 0·05)(Reference Johnson, Kuh and Tikhonoff45).
Another British cohort reported on lipid levels at age 53 and found that a 1 sd increase in BMI at ages 2 and 4 was associated with lower levels of total cholesterol (P = 0·007 and P = 0·003, respectively) and an increase in BMI from 7 to 15 years was associated with lower levels of HDL-cholesterol with the association being stronger and greater in females. The researchers adjusted for the current body size(Reference Skidmore, Hardy and Kuh50).
Low- and middle-income countries
A study from India found that fat gain measured by SF from 5 years onwards was associated with elevated systolic blood pressure in adulthood(Reference Krishnaveni, Veena and Srinivasan54).
A study from Melanesia reporting on total cholesterol found that BMI z residuals from 0 to 5 years in males were associated with increased total cholesterol. In females, there was a positive association between SF residuals from 0 to 5 years and CVD, and BMI z residuals from 6 to 11 years and CVD(Reference Weitz, Friedlaender and Friedlaender57).
Glucose metabolism outcomes (Table 3)
High-income countries
Two Finnish studies reported the risk of type 2 diabetes (T2D). One study found that a gain of 1 kg/m2 in subjects who had the minimum BMI from 3 to 11 years had an increased risk of T2D v. those who gained less than 1 kg/m2 (OR1·87; P = 0·04)(Reference Lammi, Moltchanova and Blomstedt49). Another study reported that children who had a BMI above the study population median at 11 years had a decreased risk of T2D with each unit increase in BMI z-score from 0–7 years. After 7 years, the same group had an increased risk of T2D with each unit increase in BMI z-score. Association was greater and stronger in females (females: OR1·35; P = 0·004, males: OR1·23; P = 0·01). Researchers found that within the same group, a low BMI at birth and at 2 years and a high BMI at 11 years were associated with T2D. The group with a BMI below the study population median at 11 years had a decreased risk of T2D with each unit increase in BMI z-score from 0 to 11 years. In this group, a low BMI at birth was associated with T2D(Reference Eriksson, Kajantie and Lampl35).
A different Finnish study assessed fasting plasma glucose and insulin resistance and found that low birth weight, low BMI at 2 years and an increase in sd scores for BMI from 2 to 11 years were associated with raised fasting plasma glucose and insulin resistance in adulthood(Reference Barker, Osmond and Forsén32).
A study reporting on hyperglycaemia in Chile found that subjects with hyperglycaemia typically had an increased BMI from approximately 2 years onwards(Reference East, Delker and Blanco33).
Low- and middle-income countries
A study from India looking at impaired glucose tolerance/diabetes mellitus (IGT/DM) found that a PI at birth and BMI in childhood close to a z-score of 0 were protective against IGT/DM (OR0·80; P = 0·04 and OR0·77; P < 0·001, respectively). Greater changes in BMI z-score from birth to adulthood were associated with increased odds of IGT/DM that grew stronger by age (all P < 0·001, see Appendix B for all OR). Researchers concluded that those with IGT/DM in adulthood were typically LBW infants and that IGT/DM was associated with low BMI in childhood, followed by an accelerated BMI gain between birth, infancy, childhood or adolescence and adulthood(Reference Raghupathy, Antonisamy and Geethanjali55).
Another study from India reporting on DM found that there were increased odds of diabetes per sd score BMI increase from 2 to 11 years (OR1·25; P = 0·01) and that subjects with diabetes had more rapid weight/BMI gain throughout infancy, childhood and adolescence as well as a lower BMI in infancy(Reference Fall, Sachdev and Osmond53). A different study, using the study population from the same birth cohort, found a similar association: increased odds of IGT/DM with a low BMI at 1 year and with a 1SD BMI z-score increase from 2 to 12 years, which attenuated after adjustment for current body size (OR1·36; P < 0·001 and OR1·26; P = 0·004, respectively). Researchers also found an association with low PI at birth and increased plasma glucose and insulin concentrations and insulin resistance at follow-up, and noted that subjects who developed DM/IGT typically had a lower PI and BMI up to the age of 2(Reference Bhargava, Sachdev and Fall52). A study reporting on insulin concentrations did not find an association with BMI and SF in the first 5 years post-natal but did associate fat gain measured by SF from 5 years onwards with increased fasting insulin concentrations and insulin resistance(Reference Krishnaveni, Veena and Srinivasan54).
One study reporting on total glucose did not find any association with BMI and SF in early life but did find that BMI residuals in females aged 12–19 years were associated with increased total glucose. In males, the researchers reported that SF residuals at ages 6–11 years and 12–19 years were associated with increased levels of total glucose(Reference Weitz, Friedlaender and Friedlaender57).
Metabolic syndrome outcomes (Table 4)
High-income countries
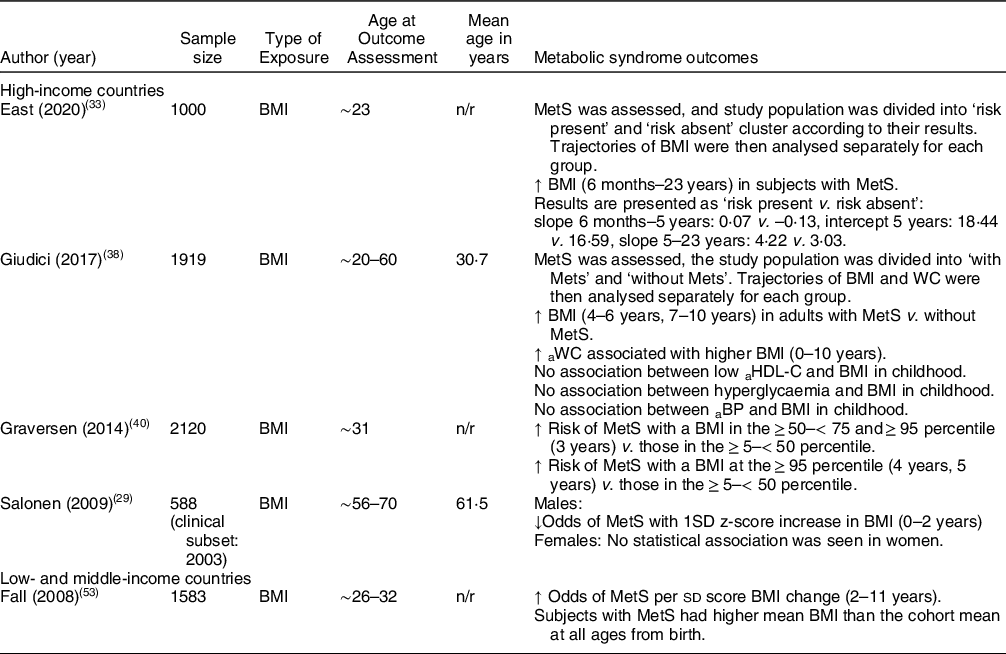
Four studies reported on MetS. One study found no association with MetS and body size at birth and 2 years. However, changes in BMI in infancy were predictive, with a 1 sd z-score increase in BMI from 0 to 2 years in males associated with decreased odds of MetS in adulthood (OR0·53;0·33–0·87). Though there were similar observations in women, the changes were not statistically significant. Researchers adjusted for current body size and did not report unadjusted results(Reference Salonen, Kajantie and Osmond29).
Another study reported that subjects with a BMI in the ≥ 50–< 75 and ≥ 95 percentile had increased risk of MetS v. those in the ≥ 5–< 50 percentile (RR1·9 v. RR1·6). Subjects with a BMI above the ≥ 95 percentile at 4 years and 5 years had a slightly greater risk of MetS v. those in the ≥ 5–< 50 percentile (RR2·5 v. RR2·4)(Reference Graversen, Sørensen and Petersen40). Similarly, another study from France found that subjects with MetS had an increased BMI at 4–6 years and 7–10 years (P = 0·01 and P < 0·001, respectively)(Reference Giudici, Rolland-Cachera and Gusto38).
A Chilean study reported that subjects who had MetS, had higher and faster growth in BMI from ages 6 months–23 years(Reference East, Delker and Blanco33).
Low- and middle-income countries
Fall et al. found that the odds of MetS increased per sd score BMI change from 2 to 11 years (OR1·48; P < 0·001) and that subjects with MetS had a more rapid weight/BMI gain throughout infancy, childhood and adolescence(Reference Fall, Sachdev and Osmond53).
Obesity-related outcomes (Table 5)
High-income countries
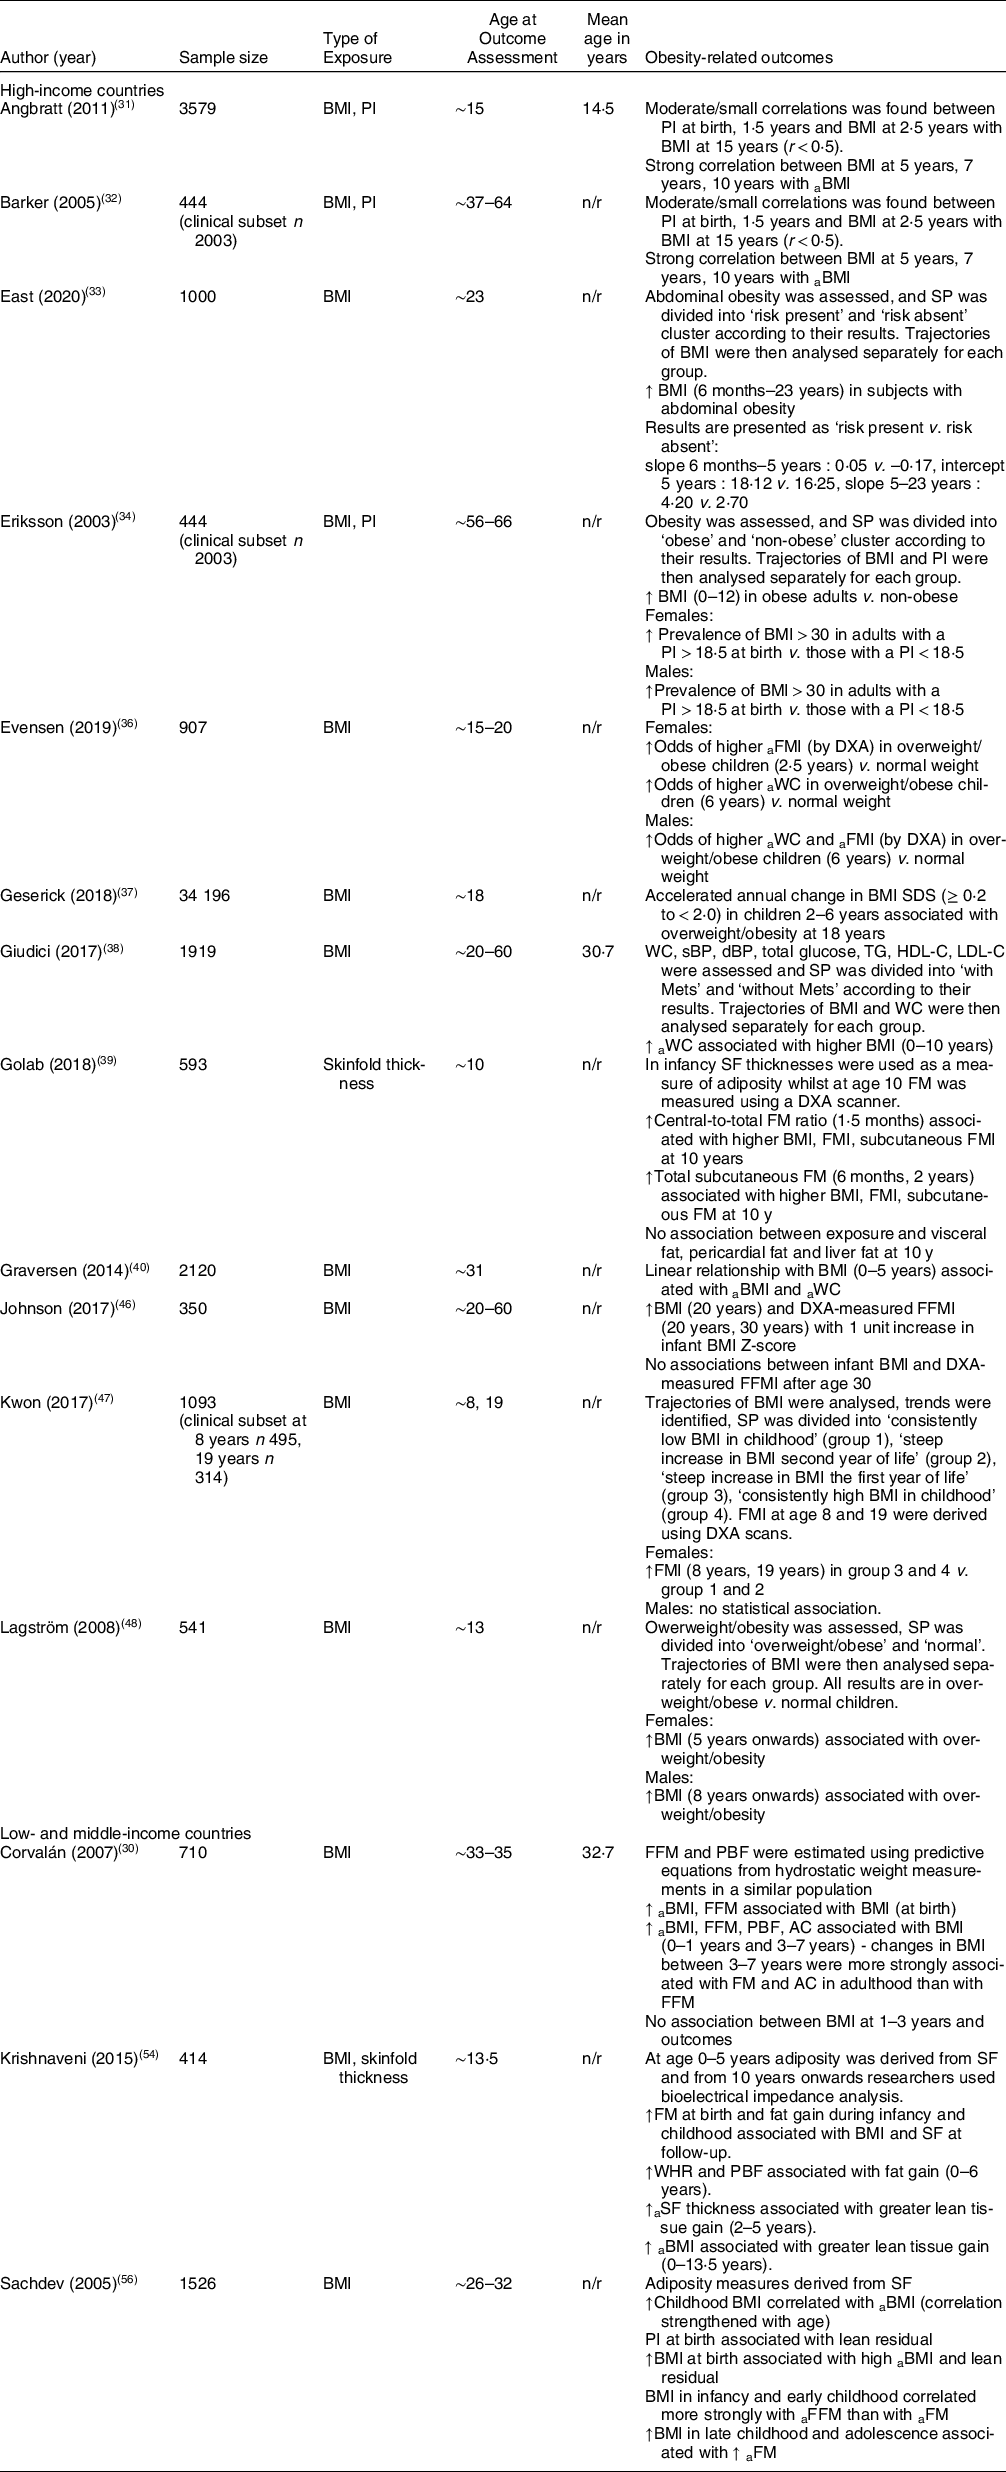
Eleven studies reported on obesity-related outcomes. A study reporting on BMI did not find any association before the age of 5. BMI from 5 years onwards was associated with overweight/obesity in females whilst this association in males was seen from age 8 years onwards(Reference Lagström, Hakanen and Niinikoski48).
Angbratt et al. found a small correlation with PI at birth, 1·5 years and BMI at 2·5 years (r < 0·5) and overweight/obesity at follow-up whilst BMI at age 5, 7 and 10 years was strongly correlated with BMI at follow-up (r > 0·5)(Reference Angbratt, Ekberg and Walter31). Another study found that a linear relationship with BMI at ages 0–5 years was associated with higher BMI and WC at follow-up(Reference Graversen, Sørensen and Petersen40).
One study reported that an increased BMI from 0 to 10 years was associated with elevated WC at follow-up (P < 0·001)(Reference Giudici, Rolland-Cachera and Gusto38). Similarly, a study reported that obese subjects at follow-up had a high BMI between 0 and 12 years (all P < 0·001). The researchers also found that females and males with a PI < 18·5 at birth had increased odds of becoming obese adults v. those with a PI > 18·5 (OR3 and OR4, respectively)(Reference Eriksson, Forsén and Osmond34). Similarly, another study found that subjects with abdominal obesity had an increased BMI gain from infancy to follow-up v. those without abdominal obesity(Reference East, Delker and Blanco33).
A study reporting on the accelerated annual change in BMI SDS found that an annual change of ≥ 0·2 to < 2·0 BMI SDS in children 2–6 years increased their risk of overweight/obesity later in life v. children with a stable BMI between age 2 and 6 years (RR1·43; CI 1·35, 1·49)(Reference Geserick, Vogel and Gausche37).
One study reported on infant BMI only and found that a 1 unit increase in infant BMI z-score was associated with high BMI at 20 years (β = 0·70; CI 0·31, 1·09; P < 0·001) and high DXA-measured fat-free mass index at 20 years (β = 0·75; CI 0·37, 1·12; P < 0·001) and 30 years (β = 0·34; CI 0·12, 0·56). They found no association between infant BMI and body composition after age 30(Reference Johnson, Choh and Lee46).
Golab et al. reported on different adiposity measures using SF and found that an increased central-to-total fat mass (FM) ratio at 1·5 months and increased total subcutaneous FM at 6 months and 2 years was associated with higher BMI and fat mass index at follow-up(Reference Golab, Voerman and van der Lugt39). Similarly, another study reported that females who had a steep increase in BMI during the first year of life had higher DXA-measured fat mass index at follow-up. There was no association in males(Reference Kwon, Janz and Letuchy47).
The Norwegian study showed that females who were overweight/obese at 2·5 years had increased odds of a higher fat mass index measured by DXA at follow-up v. those with a normal weight at 2·5 years (OR: 2·00; P < 0·05); however, the association was stronger with overweight/obesity at 6 years and increased WC at follow-up v. normal weight at 6 years (OR: 4·79; P < 0·001). In males, there was no association between overweight/obesity at age 2·5 and obesity-related outcomes at follow-up; however, overweight/obesity at 6 years was associated with increased odds of increased WC (OR: 5·56; P < 0·001) and DXA-measured fat mass index (OR: 4·14; P < 0·001) at follow-up(Reference Evensen, Emaus and Furberg36).
Low- and middle-income countries
A Guatemalan study found an association between BMI at birth and BMI (β = 0·33; P < 0·05) and fat-free mass (FFM) (β = 0·49; P < 0·01) at follow-up. FFM was estimated using predictive equations from hydrostatic weight measurements in a similar population. Results also showed that BMI at 0–1 years and 3–7 years was associated with BMI, FFM, percentage body fat and abdominal circumference, and that changes in BMI from 3 to 7 years were most strongly associated with adult FM and abdominal circumference (see Appendix B for details). There was no association between BMI at ages 1–3 years and measured outcomes at follow-up(Reference Corvalán, Gregory and Ramirez-Zea30).
A similar study in India found a correlation between BMI in childhood and BMI at follow-up; the correlation strengthened with age (6 months: r = 0·19, 2 years: r = 0·24, 5 years: r = 0·32, 14 years: r = 0·65). The study reported that PI at birth was associated with FFM in adulthood and that BMI in infancy and early childhood correlated more strongly with adult FFM whilst increased BMI in late childhood and adolescence was associated with adult FM. FFM and FM were derived from SF(Reference Sachdev, Fall and Osmond56).
Another Indian study reported an association between fat gain from 0 to 6 years and waist–hip ratio, BMI and percentage body fat at follow-up. In addition, the results showed that greater lean tissue gain from 2 to 5 years and 0–13·5 years was associated with SF thickness and BMI at follow-up, respectively. FM, FFM and percentage body fat were derived from SF up to age 5 whereafter researchers used BIA(Reference Krishnaveni, Veena and Srinivasan54).
Discussion
Summary
The major finding from our review is that evidence on childhood body composition and later-life NCD is severely limited. Though four studies assessed SF thickness in childhood, we did not find any using the more direct and technically superior methods such as isotope dilution, plethysmography or DXA. We did however find numerous studies using BMI (and a smaller number using PI)—but it is important to note that these are only proxy measures of body composition. Among children of the same age, sex and BMI, the level of body fat may vary twofold(Reference Wells58). Even with BMI as the childhood exposure variable, associations with later NCD are difficult to interpret due to marked inter-study heterogeneity, especially in terms of NCD measure and age at follow-up. Varied approaches to analysing, reporting and presenting data in addition to disparities of cut-off points add to the challenge of interpreting what is. Most studies showed that childhood BMI is associated with later-life cardiometabolic NCD risk and that changes in BMI rather than absolute BMI appear to be important. Some studies also showed sex-specific differences. Most studies were unadjusted for current body size and thus the independent effect of childhood BMI is open to question. Because most studies were from high-income settings, wider generalisability to populations in low- and middle-income settings is unknown.
Interpretation of findings
Most of our interpretable data uses BMI as the childhood exposure variable. BMI is widely used to categorise nutritional status because it is simple and can be compared with reference standards(Reference Gallagher, Visser and Sepúlveda59). Many people and even many non-specialist scientists/clinicians also view it as ‘an indicator of body fatness’(60) – hence why it was so common in our search results. It is however just an indicator of variability in weight relative to height, not variability in FM and it cannot differentiate between FM and FFM. In children, this issue is further complicated by the variety of other factors such as age, sex, pubertal status and ethnicity. In relation to using BMI as an indicator of body fat in early life, another big limitation arises: specifically, that low BMI at birth and during infancy can act as a proxy for low FFM(Reference Kumaran, Lubree and Bhat8), and hence as a marker of poor capacity for metabolic homeostasis(Reference Wells61). This is highly problematic as this implies that greater relative weight may index different components of body composition at different time points. Although several studies in this review have shown that infant weight gain is protective of NCD in later life and that both low BMI at birth and in infancy and high childhood BMI are associated with an increased risk of NCD, the lack of information about the relationship between BMI and body composition makes it difficult to interpret the data and establish clear associations. Infancy is a particularly challenging period to investigate, as low BMI may indicate low FFM, whereas rapid BMI increases over time may indicate fat deposition through catch-up growth(Reference Wells61).
In the studies that did differentiate between FM and FFM, low BMI in infancy and high BMI in childhood both predicted later NCD risk. This pattern links with the ‘capacity-load model’ which hypothesises that increased size at birth indicates a greater metabolic (homoeostatic) capacity, although those born in the highest weight categories may deviate from this pattern since a higher proportion of their weight is likely due to adipose tissue, which imposes a metabolic load(Reference Wells19,Reference Wells and Shirley62) .
Several studies have associated birth weight and BMI in infancy with adult FFM, whilst BMI in later childhood was associated with both FM and FFM(Reference Aihie Sayer, Syddall and Dennison63–Reference Singhal, Wells and Cole65). This is consistent with the studies included in this review. Four studies found that early BMI was associated with adult FFM whilst BMI in later childhood was associated with FM and FFM(Reference Corvalán, Gregory and Ramirez-Zea30,Reference Evensen, Emaus and Furberg36,Reference Johnson, Bann and Hardy66,Reference Sachdev, Fall and Osmond67) . These were also the only studies distinguishing between FM and FFM while the rest of the studies reported on BMI as a whole. As BMI does not distinguish between FM and FFM, associations between early BMI and overweight/obesity are likely to be confounded by the gain in FFM, thus threatening the validity of its use. This might also explain why some studies did find an association between BMI and NCD, while others did not.
Other inconsistencies of our results among studies reporting on the same outcome measure can be explained by the follow-up time of the respective studies. In our review, years of follow-up varied widely from 10 to 70 years. In studies with relatively short follow-up time that show no association between exposure and outcome, it is likely that some subjects will go on to develop a NCD with time as most NCD do not develop until later in life(Reference Kraja, Borecki and North68–Reference Olokoba, Obateru and Olokoba70). T2D, for instance, is most commonly seen in people over the age of 45(Reference Olokoba, Obateru and Olokoba70), and only one-third studies in current review with T2D as an outcome had a study population above age 45(Reference Eriksson, Kajantie and Lampl35).
Lack of adjusting for current body size also impacts the interpretation of our findings. In 1999, Lucas et al. criticised researchers’ lack of understanding and communication of the statistical implications of this. Over 20 years later, our review suggests that the problem remains. Adjustment for current size is important because it implies that change in size as well as initial size can contribute to an association(Reference Lucas, Fewtrell and Cole71). Previous reviews found that studies which had adjusted for current body size experienced a partial attenuation in effect size(Reference Ajala, Mold and Boughton72) and that some associations completely disappeared after adjustment for current body size(Reference Umer, Kelley and Cottrell73). These discoveries show that studies that fail to undertake these adjustments may be confounded by adult body size, and therefore the observed associations might in fact reflect the tracking of childhood BMI across the lifespan instead of an actual association(Reference Lloyd, Langley-Evans and McMullen74).
In our review, eleven of twenty-nine studies adjusted for current body size(Reference Salonen, Kajantie and Osmond29,Reference Barker, Osmond and Forsén32,Reference Howe, Tilling and Benfield42,Reference Howe, Chaturvedi and Lawlor43,Reference Johnson, Choh and Lee46,Reference Skidmore, Hardy and Kuh50–Reference Fall, Sachdev and Osmond53,Reference Raghupathy, Antonisamy and Geethanjali55,Reference Johnson, Kuh and Tikhonoff75) and like previously reported, some associations attenuated or became statistically insignificant after adjustments or even reversed. However, while the researchers did comment on the effect adjustment for body size had on the results, most of the studies did not report both adjusted v. unadjusted results with respect to adjustment for current body size, making readers unable to analyse and interpret raw data to draw their own conclusions.
Research in context
Similar to our review, Park et al. found an association between childhood overweight (2–12 years), unadjusted for adult body size and CVD outcomes in adulthood. They were unable to conclude that childhood overweight is an independent risk factor of adult CVD as the few studies that did report adjusted results were inconclusive. Furthermore, studies were mainly from high-income settings and thus the generalisability is limited(Reference Park, Falconer and Viner25). In contrast, a review from Owen et al. in 2009 concluded that BMI gain from age 2 to 6 years had a weak inverse association (RR0·94, 95 % CI: 0·82, 1·07) with CHD risk(Reference Owen, Whincup and Orfei76); however, statistical findings are weak with CI including 1·00. It is also important to notice that this conclusion was based on only three estimates and that the researchers for this review did not exclude cohorts with high-risk subjects (e.g. LBW babies). Owen et al. also reported that the inverse association between childhood BMI and CHD risk became weakly positive after age 7 years and grew stronger with age(Reference Owen, Whincup and Orfei76). The inverse association is consistent with some studies included in the current review that found an association between low BMI in infancy and NCD risk factors in adulthood. The evidence supports the capacity-load model hypothesis(Reference Wright, Cole and Fewtrell77), where LBW means lower capacity, but an excessively high birthweight indicates macrosomia and also means lower homeostatic capacity in terms of ability to prevent NCD. Results from a number of studies in the current review suggest the same trend but whether this is due to the uncontrolled adjustments for current body size remains unanswered.
A review by Simmonds et al. based on high-income countries studies reported that BMI has poor sensitivity in identifying healthy-weight children, who later would become obese adults. However, BMI was found to be a reasonable accurate measure of obesity and thus can identify obese children who most likely will become obese adults. The researchers also reported that obese children had more than five times the risk of becoming obese adults than non-obese children (RR5·21; 95 % CI 4·50, 6·02)(Reference Simmonds, Burch and Llewellyn22). These findings are consistent with studies we found, which suggest a pattern whereby increased BMI at different ages throughout childhood is associated with NCD/obesity-related outcomes in adult life. However, a recent evaluation of a large dataset on children’s body composition found that below 6 years, there was a very weak relationship between high BMI and high body fatness, suggesting that the use of high BMI centile to index excess adiposity in young children is methodologically flawed(Reference Wright, Cole and Fewtrell77). Consistent with that, Simmonds et al. found that BMI was a poor predictor of obesity-related diseases, as only 40 % of adult diabetes and 20 % of CHD would occur in overweight/obese children(Reference Simmonds, Burch and Llewellyn22). This further underlines the importance of using better body composition measurements in future studies to examine the effect of childhood FM and FFM on adult NCD.
These three reviews also experienced challenges with the diversity in reporting, which for Simmonds et al. meant that a number of assumptions were made to conduct the meta-analysis and thus the reliability of the pooled estimate may be limited(Reference Simmonds, Burch and Llewellyn22). Due to the limitations of these reviews, results should be interpreted as a general trend rather than a precise estimate of an association or predictive accuracy.
Finally, a 2021 review focussed on NCD risk in survivors of childhood undernutrition/famine(Reference Grey, Gonzales and Abera16). Though the exposure was to undernutrition (as assessed by standard anthropometric measures) and thus the opposite type of malnutrition to most studies in this review, authors also found an association with numerous NCD-related outcomes. Strength and consistency of the association also varied according to the outcome. Interpreting the reviews together, it seems that extremes at both ends of the malnutrition spectrum risk long-term adverse outcomes. Our observation that rate of weight change can mediate risk might offer insights into the mechanism spanning the two types of malnutrition. As that review highlights in the conclusions, this work on mechanisms is urgently needed.
Limitations
All included studies controlled for some known confounders. However, all studies were also of observational design, and there is therefore an inherent risk of residual confounding affecting the results. Whilst it is impossible to control for all confounders, the most evident and important confounders should be taken into consideration. For example, Bhargava et al. did not adjust for socio-economic status (SES)(Reference Bhargava, Sachdev and Fall52). SES is a well-known confounder and lack of controlling thereof may lead to significantly affected and incorrect effect size(Reference Ahrens78). Though not simple, it might also have been possible to control for different times of follow-up, e.g. using age-standardised reporting of NCD-related outcome measures. Another important confounder is in utero growth and nutrition, as manifested by low birth weight and weight-for-gestational age. We hope that future studies will better take this into account and adjust accordingly since its impact on metabolic programming is well established. It is currently difficult to disentangle the relative contribution of in utero exposures from early child (u5 years) exposures on future NCD-related risk.
As mentioned, very few studies reported on actual body composition in relation to NCD which consequently highly limits our understanding of how FM and FFM in early childhood relates to later NCD risk. Alongside the problem of using BMI rather than other true measures of body composition, adjustment for current body size was a major limitation in this review. Since under half of the studies included in the narrative synthesis adjusted for current size, we are unable to confirm the independent effect of early childhood body size on long-term cardiometabolic health, and thus there is a possibility that the associations seen in studies that failed to undertake these adjustments is mediated through adult body size.
Several studies were greatly affected by the loss to follow-up and only four had an attrition rate below 20 %(Reference Corvalán, Gregory and Ramirez-Zea30,Reference Evensen, Emaus and Furberg36,Reference Ziyab, Karmaus and Kurukulaaratchy51,Reference Krishnaveni, Veena and Srinivasan54) . Seven studies reported a loss to follow-up above 60 % of the original cohort(Reference Howe, Tilling and Benfield42–Reference Huang, Mori and Burrows44,Reference Skidmore, Hardy and Kuh50,Reference Raghupathy, Antonisamy and Geethanjali55,Reference Weitz, Friedlaender and Friedlaender57,Reference Sachdev, Fall and Osmond67) , while eight did not address the attrition rate at all nor did they report it(Reference Angbratt, Ekberg and Walter31,Reference Barker, Osmond and Forsén32,Reference Eriksson, Forsén and Osmond34,Reference Eriksson, Kajantie and Lampl35,Reference Kwon, Janz and Letuchy47–Reference Lammi, Moltchanova and Blomstedt49,Reference Johnson, Kuh and Tikhonoff75) .
None of the studies presented power calculations for their sample size, and only four studies(Reference East, Delker and Blanco33,Reference Howe, Chaturvedi and Lawlor43,Reference Lammi, Moltchanova and Blomstedt49,Reference Raghupathy, Antonisamy and Geethanjali55) identified reduced power as a limitation of their study and possible explanation for the lack of weak association/difference in groups.
Research recommendations
This review has highlighted several areas needing urgent research attention.
Heterogeneity among future studies might be reduced by researchers reading our review when planning their own work and choosing outcome variables/measurement timings which can then be more directly compared with this past work. Checklists of key items to report in such nutrition/NCD follow-up studies might also help, forming the basis for a STROBE checklist extension(Reference Sharp, Hren and Altman79).
Based on the risk of bias assessment, it is recommended that future longitudinal studies improve their reporting on several potential sources of bias and include a flow diagram to demonstrate their participation and response rates. In particular, follow-up rates should be reported as well as implications should be clearly discussed.
BMI is a poor measure of adiposity as it does not distinguish between FM and FFM. Future work should use additional, more direct measures of adiposity, e.g. peapod, isotope dilution and DXA. These studies are urgently needed and could offer valuable insights into mechanisms linking early-life malnutrition (both undernutrition and overweight/obesity) with later-life NCD risk. Studies are also needed to explore the relative utility of different methods, e.g. which field-appropriate measures (such as BIA) are most closely associated with the more complex, costly but arguably more ‘gold standards’ measures such as DXA scans. Different tools are appropriate for different settings and different study types and budgets (e.g. large-scale population research might use field-friendly BIA machines which are portable and increasingly affordable; smaller studies requiring fewer individuals who can travel to a clinic setting might use a more robust but less portable measure like densitometry or DXA. Isotope dilution studies represent an intermediate option, accurate and viable for large field studies but relatively expensive for lab analyses).
Future research should also explore the impact of body composition at other stages of childhood and adolescence. Different ages may be more or less important in influencing the risk of later-life adult NCD. Our focus was on children aged under 5 years since these are the focus of much global policy and practice on child nutrition—but other ages also matter. What happens later on may either exacerbate or attenuate any effect of ‘adverse’ body composition in younger children. This would be important for programmers and policy-makers working on under 5’s to know.
Sex differences also matter and should be explored in future work. Not enough papers presented disaggregated data for us to comment on sex-specific differences in this review but differences are well recognised for the risks of both early-life malnutrition(Reference Thurstans, Opondo and Seal80,Reference Thurstans, Opondo and Seal81) and adult NCD(82). Thus, we hope that future researchers will carefully account for sex when documenting any links between early body composition and later-life NCD.
Finally, less than half of the studies in this review adjusted for current body size. Future studies should present both crude and adjusted associations.
Conclusion
Our review found that early life (first 5 years of postnatal life) nutritional status, mostly as assessed by low BMI in infancy and increased BMI in later childhood, was often associated with increased risk of cardiometabolic diseases and risk factors in adult life. Although exact patterns of association varied in different studies and settings (i.e. whether absolute BMI or BMI change in childhood matter most), some evidence in our review suggests a pattern where low BMI at birth and infancy followed by a rapid weight gain in childhood exceeding recommended levels increases the risk of NCD. Whether different patterns of body composition mediate or explain some of these variations is not possible to say. Neither is it known whether childhood BMI is an independent risk factor for NCD in adulthood, or whether the association is simply mediated through adult overweight/obesity. Due to the limited evidence on nutritional status measures other than BMI, it is not possible to identify which measure of body composition best predicts NCD in adulthood.
We highlight several gaps in the literature: high-quality evidence on this topic—in particular, evidence from low- and middle-income countries and the use of more direct measures of body composition to better describe nutritional status. As technology is rapidly improving, better equipment/solutions are more accessible and can provide research with adequate measures of body composition. Findings from our review underline the necessity to improve and continue the tracking of body composition from birth to adulthood to help understand relevant mechanisms linking child nutrition to adult health/NCD. This has a key role to play in preventing the increasing rates of overweight/obesity among children and adults and ultimately prevent the rising prevalence of NCD.
Acknowledgements
Acknowledgements: Not applicable. Financial support: Marko Kerac thanks the Medical Research Council, UK for time on this work (CHANGE project: Child malnutrition & Adult NCD: Generating Evidence on mechanistic links to inform future policy/practice (UKRI GCRF Grant Ref: MR/V000802/1). Authorship: Conceptualisation, M.K. and A.B.; methodology, M.K. and A.B.; formal analysis, A.B.; investigation, A.B. and I.G.; resources, writing—original draft preparation, A.B.; writing—review and editing, A.B., M.K., J.C.K.W., A.J.M., V.O.O., C.U.L. visualisation, A.B.; supervision, M.K.; project administration, A.B.; funding acquisition, M.K. All authors have read and agreed to the published version of the manuscript. Ethics of human subject participation: Not applicable.
Conflict of interest:
There are no conflicts of interest.
Appendix A
Full search strategy
Database: Ovid MEDLINE(R) and In-Process & Other Non-Indexed Citations and Daily <1946 to July 27, 2020>
Search Strategy:
-
(diabetes type 2 or type 2 diabetes or diabetes mellitus or insulin resistance syndrome* or insulin resistan* or hyperglycaemia or hypertension or arteriosclerosis or cardiovascular disease* or cardio vascular disease* or blood pressure or coronary heart disease* or metabolic syndrome* or dysmetabolic syndrome* or cardio metabolic disorder* or cardiometabolic disorder* or lipid profile or lipid metabolism or lipid* profile or glucose metaboli* disorder* or glucose intoleran* or glucose toleran* or obes* or artheroscleros*).mp. (1781365)
-
((infan* or baby or babies or child* preschool or preschool child or early childhood or young children or kindergarten* or children under 5 or children under five or under 5's) adj10 (body composition or body fat or fat percentage or fat % or lean mass or fat mass of fat free mass or muscle mass or grip strength or hand strength or antropometr* or skinfold or skinfold thickness or body mass index or BMI or percent fat or fat percent or densitometry)).mp. (5242)
-
1 and 2 (2221)
-
((infan* or baby or babies or child* preschool or preschool child or early childhood or young children or kindergarten* or children under 5 or children under five or under 5's) adj10 (body composition or body fat or fat percentage or fat % or lean mass or fat mass of fat free mass or muscle mass or grip strength or hand strength or antropometr* or skinfold or skinfold thickness or body mass index or BMI)).mp. [mp=title, abstract, original title, name of substance word, subject heading word, floating sub-heading word, keyword heading word, organism supplementary concept word, protocol supplementary concept word, rare disease supplementary concept word, unique identifier, synonyms] (5194)
-
1 and 4 (2219)
-
body composition.mp. [mp=title, abstract, original title, name of substance word, subject heading word, floating sub-heading word, keyword heading word, organism supplementary concept word, protocol supplementary concept word, rare disease supplementary concept word, unique identifier, synonyms] (57816)
-
body fat.mp. [mp=title, abstract, original title, name of substance word, subject heading word, floating sub-heading word, keyword heading word, organism supplementary concept word, protocol supplementary concept word, rare disease supplementary concept word, unique identifier, synonyms] (33004)
-
(fat percentage or fat %).mp. [mp=title, abstract, original title, name of substance word, subject heading word, floating sub-heading word, keyword heading word, organism supplementary concept word, protocol supplementary concept word, rare disease supplementary concept word, unique identifier, synonyms] (271026)
-
fat mass.mp. [mp=title, abstract, original title, name of substance word, subject heading word, floating sub-heading word, keyword heading word, organism supplementary concept word, protocol supplementary concept word, rare disease supplementary concept word, unique identifier, synonyms] (20698)
-
lean mass.mp. [mp=title, abstract, original title, name of substance word, subject heading word, floating sub-heading word, keyword heading word, organism supplementary concept word, protocol supplementary concept word, rare disease supplementary concept word, unique identifier, synonyms] (5400)
-
fat free mass.mp. [mp=title, abstract, original title, name of substance word, subject heading word, floating sub-heading word, keyword heading word, organism supplementary concept word, protocol supplementary concept word, rare disease supplementary concept word, unique identifier, synonyms] (7537)
-
muscle mass.mp. [mp=title, abstract, original title, name of substance word, subject heading word, floating sub-heading word, keyword heading word, organism supplementary concept word, protocol supplementary concept word, rare disease supplementary concept word, unique identifier, synonyms] (17698)
-
grip strength.mp. [mp=title, abstract, original title, name of substance word, subject heading word, floating sub-heading word, keyword heading word, organism supplementary concept word, protocol supplementary concept word, rare disease supplementary concept word, unique identifier, synonyms] (11357)
-
hand strength.mp. [mp=title, abstract, original title, name of substance word, subject heading word, floating sub-heading word, keyword heading word, organism supplementary concept word, protocol supplementary concept word, rare disease supplementary concept word, unique identifier, synonyms] (15132)
-
anthropometr*.mp. [mp=title, abstract, original title, name of substance word, subject heading word, floating sub-heading word, keyword heading word, organism supplementary concept word, protocol supplementary concept word, rare disease supplementary concept word, unique identifier, synonyms] (78466)
-
(skinfold or skin fold thickness).mp. [mp=title, abstract, original title, name of substance word, subject heading word, floating sub-heading word, keyword heading word, organism supplementary concept word, protocol supplementary concept word, rare disease supplementary concept word, unique identifier, synonyms] (10959)
-
(body mass index or BMI).mp. [mp=title, abstract, original title, name of substance word, subject heading word, floating sub-heading word, keyword heading word, organism supplementary concept word, protocol supplementary concept word, rare disease supplementary concept word, unique identifier, synonyms] (279689)
-
6 or 7 or 8 or 9 or 10 or 11 or 12 or 13 or 14 or 15 or 16 or 17 (608903)
-
(infan* adj10 #13).mp. [mp=title, abstract, original title, name of substance word, subject heading word, floating sub-heading word, keyword heading word, organism supplementary concept word, protocol supplementary concept word, rare disease supplementary concept word, unique identifier, synonyms] (4182)
-
((baby or babies) adj10 #13).mp. [mp=title, abstract, original title, name of substance word, subject heading word, floating sub-heading word, keyword heading word, organism supplementary concept word, protocol supplementary concept word, rare disease supplementary concept word, unique identifier, synonyms] (551)
-
((child* preschool or preschool child) adj10 #13).mp. [mp=title, abstract, original title, name of substance word, subject heading word, floating sub-heading word, keyword heading word, organism supplementary concept word, protocol supplementary concept word, rare disease supplementary concept word, unique identifier, synonyms] (2)
-
(early childhood adj10 #13).mp. [mp=title, abstract, original title, name of substance word, subject heading word, floating sub-heading word, keyword heading word, organism supplementary concept word, protocol supplementary concept word, rare disease supplementary concept word, unique identifier, synonyms] (60)
-
(young children adj10 #13).mp. [mp=title, abstract, original title, name of substance word, subject heading word, floating sub-heading word, keyword heading word, organism supplementary concept word, protocol supplementary concept word, rare disease supplementary concept word, unique identifier, synonyms] (91)
-
(kindergarten adj10 #13).mp. [mp=title, abstract, original title, name of substance word, subject heading word, floating sub-heading word, keyword heading word, organism supplementary concept word, protocol supplementary concept word, rare disease supplementary concept word, unique identifier, synonyms] (50)
-
((children under 5 or children under five or under 5's) adj10 #13).mp. [mp=title, abstract, original title, name of substance word, subject heading word, floating sub-heading word, keyword heading word, organism supplementary concept word, protocol supplementary concept word, rare disease supplementary concept word, unique identifier, synonyms] (66)
-
19 or 20 or 21 or 22 or 23 or 24 or 25 (4931)
-
(diabetes type 2 or type 2 diabetes or diabetes mellitus or insulin resistance syndrome* or insulin resistan* or hyperglycaemia or hypertension or arteriosclerosis or cardiovascular disease* or cardio vascular disease* or blood pressure or coronary heart disease* or metabolic syndrome* or dysmetabolic syndrome* or cardio metabolic disorder* or cardiometabolic disorder* or lipid profile or lipid metabolism or lipid* profile or glucose metaboli* disorder* or glucose intoleran* or glucose toleran* or obes* or hypertension or artheroscleros*).mp. (1781365)
-
(diabetes type 2 or type 2 diabetes).mp. [mp=title, abstract, original title, name of substance word, subject heading word, floating sub-heading word, keyword heading word, organism supplementary concept word, protocol supplementary concept word, rare disease supplementary concept word, unique identifier, synonyms] (126496)
-
diabetes mellitus.mp. [mp=title, abstract, original title, name of substance word, subject heading word, floating sub-heading word, keyword heading word, organism supplementary concept word, protocol supplementary concept word, rare disease supplementary concept word, unique identifier, synonyms] (433938)
-
insulin resistance syndrome*.mp. [mp=title, abstract, original title, name of substance word, subject heading word, floating sub-heading word, keyword heading word, organism supplementary concept word, protocol supplementary concept word, rare disease supplementary concept word, unique identifier, synonyms] (1746)
-
insulin resistan*.mp. [mp=title, abstract, original title, name of substance word, subject heading word, floating sub-heading word, keyword heading word, organism supplementary concept word, protocol supplementary concept word, rare disease supplementary concept word, unique identifier, synonyms] (98055)
-
hyperglycaemia.mp. [mp=title, abstract, original title, name of substance word, subject heading word, floating sub-heading word, keyword heading word, organism supplementary concept word, protocol supplementary concept word, rare disease supplementary concept word, unique identifier, synonyms] (10223)
-
hypertension.mp. [mp=title, abstract, original title, name of substance word, subject heading word, floating sub-heading word, keyword heading word, organism supplementary concept word, protocol supplementary concept word, rare disease supplementary concept word, unique identifier, synonyms] (485390)
-
arteriosclerosis.mp. [mp=title, abstract, original title, name of substance word, subject heading word, floating sub-heading word, keyword heading word, organism supplementary concept word, protocol supplementary concept word, rare disease supplementary concept word, unique identifier, synonyms] (70980)
-
cardiovascular disease*.mp. [mp=title, abstract, original title, name of substance word, subject heading word, floating sub-heading word, keyword heading word, organism supplementary concept word, protocol supplementary concept word, rare disease supplementary concept word, unique identifier, synonyms] (260492)
-
cardio vascular disease*.mp. [mp=title, abstract, original title, name of substance word, subject heading word, floating sub-heading word, keyword heading word, organism supplementary concept word, protocol supplementary concept word, rare disease supplementary concept word, unique identifier, synonyms] (705)
-
blood pressure.mp. [mp=title, abstract, original title, name of substance word, subject heading word, floating sub-heading word, keyword heading word, organism supplementary concept word, protocol supplementary concept word, rare disease supplementary concept word, unique identifier, synonyms] (442915)
-
coronary heart disease*.mp. [mp=title, abstract, original title, name of substance word, subject heading word, floating sub-heading word, keyword heading word, organism supplementary concept word, protocol supplementary concept word, rare disease supplementary concept word, unique identifier, synonyms] (50273)
-
metabolic syndrome*.mp. [mp=title, abstract, original title, name of substance word, subject heading word, floating sub-heading word, keyword heading word, organism supplementary concept word, protocol supplementary concept word, rare disease supplementary concept word, unique identifier, synonyms] (57036)
-
dysmetabolic syndrome*.mp. [mp=title, abstract, original title, name of substance word, subject heading word, floating sub-heading word, keyword heading word, organism supplementary concept word, protocol supplementary concept word, rare disease supplementary concept word, unique identifier, synonyms] (111)
-
cardio metabolic disorder*.mp. [mp=title, abstract, original title, name of substance word, subject heading word, floating sub-heading word, keyword heading word, organism supplementary concept word, protocol supplementary concept word, rare disease supplementary concept word, unique identifier, synonyms] (87)
-
cardiometabolic disorder*.mp. [mp=title, abstract, original title, name of substance word, subject heading word, floating sub-heading word, keyword heading word, organism supplementary concept word, protocol supplementary concept word, rare disease supplementary concept word, unique identifier, synonyms] (562)
-
lipid* profile.mp. [mp=title, abstract, original title, name of substance word, subject heading word, floating sub-heading word, keyword heading word, organism supplementary concept word, protocol supplementary concept word, rare disease supplementary concept word, unique identifier, synonyms] (22957)
-
lipid metabolism.mp. [mp=title, abstract, original title, name of substance word, subject heading word, floating sub-heading word, keyword heading word, organism supplementary concept word, protocol supplementary concept word, rare disease supplementary concept word, unique identifier, synonyms] (99667)
-
glucose metaboli* disorder*.mp. [mp=title, abstract, original title, name of substance word, subject heading word, floating sub-heading word, keyword heading word, organism supplementary concept word, protocol supplementary concept word, rare disease supplementary concept word, unique identifier, synonyms] (1189)
-
glucose intoleran*.mp. [mp=title, abstract, original title, name of substance word, subject heading word, floating sub-heading word, keyword heading word, organism supplementary concept word, protocol supplementary concept word, rare disease supplementary concept word, unique identifier, synonyms] (16545)
-
glucose toleran*.mp. [mp=title, abstract, original title, name of substance word, subject heading word, floating sub-heading word, keyword heading word, organism supplementary concept word, protocol supplementary concept word, rare disease supplementary concept word, unique identifier, synonyms] (59483)
-
obes*.mp. [mp=title, abstract, original title, name of substance word, subject heading word, floating sub-heading word, keyword heading word, organism supplementary concept word, protocol supplementary concept word, rare disease supplementary concept word, unique identifier, synonyms] (352263)
-
artheroscleros*.mp. [mp=title, abstract, original title, name of substance word, subject heading word, floating sub-heading word, keyword heading word, organism supplementary concept word, protocol supplementary concept word, rare disease supplementary concept word, unique identifier, synonyms] (149)
-
28 or 29 or 30 or 31 or 32 or 33 or 34 or 35 or 36 or 37 or 38 or 39 or 40 or 41 or 42 or 43 or 44 or 45 or 46 or 47 or 48 or 49 (1781365)
-
26 and 50 (337)
-
remove duplicates from 51 (334)
-
(infan* adj10 (body composition or body fat or fat percentage or fat % or lean mass or fat mass of fat free mass or muscle mass or grip strength or hand strength or antropometr* or skinfold or skinfold thickness or body mass index or BMI)).mp. [mp=title, abstract, original title, name of substance word, subject heading word, floating sub-heading word, keyword heading word, organism supplementary concept word, protocol supplementary concept word, rare disease supplementary concept word, unique identifier, synonyms] (3773)
-
((baby or babies) adj10 (body composition or body fat or fat percentage or fat % or lean mass or fat mass of fat free mass or muscle mass or grip strength or hand strength or antropometr* or skinfold or skinfold thickness or body mass index or BMI)).mp. [mp=title, abstract, original title, name of substance word, subject heading word, floating sub-heading word, keyword heading word, organism supplementary concept word, protocol supplementary concept word, rare disease supplementary concept word, unique identifier, synonyms] (312)
-
(baby adj10 (body composition or body fat or fat percentage or fat % or lean mass or fat mass of fat free mass or muscle mass or grip strength or hand strength or antropometr* or skinfold or skinfold thickness or body mass index or BMI)).mp. [mp=title, abstract, original title, name of substance word, subject heading word, floating sub-heading word, keyword heading word, organism supplementary concept word, protocol supplementary concept word, rare disease supplementary concept word, unique identifier, synonyms] (131)
-
(babies adj10 (body composition or body fat or fat percentage or fat % or lean mass or fat mass of fat free mass or muscle mass or grip strength or hand strength or antropometr* or skinfold or skinfold thickness or body mass index or BMI)).mp. [mp=title, abstract, original title, name of substance word, subject heading word, floating sub-heading word, keyword heading word, organism supplementary concept word, protocol supplementary concept word, rare disease supplementary concept word, unique identifier, synonyms] (190)
-
((child* preschool or preschool child) adj10 (body composition or body fat or fat percentage or fat % or lean mass or fat mass of fat free mass or muscle mass or grip strength or hand strength or antropometr* or skinfold or skinfold thickness or body mass index or BMI)).mp. [mp=title, abstract, original title, name of substance word, subject heading word, floating sub-heading word, keyword heading word, organism supplementary concept word, protocol supplementary concept word, rare disease supplementary concept word, unique identifier, synonyms] (670)
-
(early childhood adj10 (body composition or body fat or fat percentage or fat % or lean mass or fat mass of fat free mass or muscle mass or grip strength or hand strength or antropometr* or skinfold or skinfold thickness or body mass index or BMI)).mp. [mp=title, abstract, original title, name of substance word, subject heading word, floating sub-heading word, keyword heading word, organism supplementary concept word, protocol supplementary concept word, rare disease supplementary concept word, unique identifier, synonyms] (357)
-
(young children adj10 (body composition or body fat or fat percentage or fat % or lean mass or fat mass of fat free mass or muscle mass or grip strength or hand strength or antropometr* or skinfold or skinfold thickness or body mass index or BMI)).mp. [mp=title, abstract, original title, name of substance word, subject heading word, floating sub-heading word, keyword heading word, organism supplementary concept word, protocol supplementary concept word, rare disease supplementary concept word, unique identifier, synonyms] (269)
-
(kindergarten* adj10 (body composition or body fat or fat percentage or fat % or lean mass or fat mass of fat free mass or muscle mass or grip strength or hand strength or antropometr* or skinfold or skinfold thickness or body mass index or BMI)).mp. [mp=title, abstract, original title, name of substance word, subject heading word, floating sub-heading word, keyword heading word, organism supplementary concept word, protocol supplementary concept word, rare disease supplementary concept word, unique identifier, synonyms] (74)
-
(children under 5 adj10 (body composition or body fat or fat percentage or fat % or lean mass or fat mass of fat free mass or muscle mass or grip strength or hand strength or antropometr* or skinfold or skinfold thickness or body mass index or BMI)).mp. [mp=title, abstract, original title, name of substance word, subject heading word, floating sub-heading word, keyword heading word, organism supplementary concept word, protocol supplementary concept word, rare disease supplementary concept word, unique identifier, synonyms] (3)
-
(children under five adj10 (body composition or body fat or fat percentage or fat % or lean mass or fat mass of fat free mass or muscle mass or grip strength or hand strength or antropometr* or skinfold or skinfold thickness or body mass index or BMI)).mp. [mp=title, abstract, original title, name of substance word, subject heading word, floating sub-heading word, keyword heading word, organism supplementary concept word, protocol supplementary concept word, rare disease supplementary concept word, unique identifier, synonyms] (2)
-
(under 5's adj10 (body composition or body fat or fat percentage or fat % or lean mass or fat mass of fat free mass or muscle mass or grip strength or hand strength or antropometr* or skinfold or skinfold thickness or body mass index or BMI)).mp. [mp=title, abstract, original title, name of substance word, subject heading word, floating sub-heading word, keyword heading word, organism supplementary concept word, protocol supplementary concept word, rare disease supplementary concept word, unique identifier, synonyms] (0)
-
53 or 54 or 57 or 58 or 59 or 60 or 61 or 62 or 63 (5194)
-
50 and 64 (2219)
-
(diabetes type 2 or type 2 diabetes or diabetes mellitus or insulin resistance syndrome* or insulin resistan* or hyperglycaemia or hypertension or arteriosclerosis or cardiovascular disease* or cardio vascular disease* or blood pressure or coronary heart disease* or metabolic syndrome* or dysmetabolic syndrome* or cardio metabolic disorder* or cardiometabolic disorder* or lipid profile or lipid metabolism or lipid* profile or glucose metaboli* disorder* or glucose intoleran* or glucose toleran* or obes* or artheroscleros*).mp. (1781365)
-
((infan* or baby or babies or child* preschool or preschool child or early childhood or young children or kindergarten* or children under 5 or children under five or under 5's) adj10 (body composition or body fat or fat percentage or fat % or lean mass or fat mass of fat free mass or muscle mass or grip strength or hand strength or anthropometr* or skinfold or skinfold thickness or body mass index or BMI)).mp. (5194)
-
66 and 67 (2219)
-
((infant* or baby or babies or child* preschool or preschool child or early childhood or young children or kindergarten* or children under 5 or children under five or under 5's) adj10 (percent fat or fat percent or densitometry)).mp. [mp=title, abstract, original title, name of substance word, subject heading word, floating sub-heading word, keyword heading word, organism supplementary concept word, protocol supplementary concept word, rare disease supplementary concept word, unique identifier, synonyms] (71)
-
67 or 69 (5242)
-
66 and 70 (2221)
-
limit 71 to english language (2110)
-
limit 72 to humans (1911)
-
limit 73 to yr="1990 -Current” (1817)
-
remove duplicates from 74 (1817)
Appendix B
Detailed summary of included studies
Table B1 Full summary of included studies
↑ = increased.
a: adult; BP: blood pressure; CI: confidence intervals; CM: cardiometabolic; cIMT: carotid intima-media thickness; CRP: c-reactive protein; dBP: diastolic blood pressure; DM; diabetes mellitus; DXA: dual energy X-ray absorptiometry; FFM: fat free mass; FFMI: fat free mass index; FM: fat mass; FMI: fat mass index; HDL-C: HDL-cholesterol; HOMA-IR; Homeostatic Model Assessment for Insulin Resistance; HR: hazard ratio; LBW: low birth weight; LDL-C: LDL-cholesterol; IGT; impaired glucose tolerance; INCAP: Institute of Nutrition of Central America and Panama Oriente; IOTF: International Obesity Taskforce; MetS: metabolic syndrome; n; sample size included in analysis; NHSD: National Survey of Health and Development Cohort; n/r; not reported; PBF: percentage body fat; PI: Ponderal index; RR: risk ratio; sBP: systolic blood pressure; SF: skinfold; SP: study population; STRIP: Special Turku Coronary Risk Factor Intervention Project; TC: total cholesterol; TG: total glucose; T2D: type 2 diabetes; WC: waist circumference; WHR; waist hip ratio.


 Open access