


Diet quality is a concept first developed in nutritional epidemiology to evaluate dietary patterns of populations and their association with health outcomes or the effectiveness of dietary interventions(Reference Alkerwi1). While no universal definition for the concept exists presently, it is generally understood that diet quality comprises of four dimensions: adequacy, balance, moderation and variety(Reference Burggraf, Teuber and Brosig2). Adequacy of a diet is defined by sufficiency of intake to meet specific dietary recommendations based on requirements(Reference Alkerwi1). The ‘balance’ dimension addresses the proportionality of energy-yielding macronutrients and fatty acid composition in the overall diet to maintain health(Reference Alkerwi1). Moderation refers to the restriction of food portions that pose an increased risk of adverse health outcomes(Reference Alkerwi1). Lastly, the variety dimension accounts for both across and within food groups consumed over a specific period(Reference Alkerwi1). The inclusion of these dimensions in diet quality assessments provides a holistic evaluation of the healthfulness of diets by accounting for the synergistic effect of diversity and quantity in diet compositions.
Diet quality indices (DQIs) are frameworks using scoring systems to measure, evaluate and categorise diet quality based on the extent of the healthfulness of dietary patterns, with data most often derived from FFQ or dietary recalls(Reference Gil, Martinez de Victoria and Olza3). Using these indices, compliance to national dietary recommendations could be assessed, areas requiring public health interventions could be identified, changes and trends in population’s food choices may be tracked and chronic disease risk factors and mortality may be predicted(Reference Alkerwi1,Reference Gil, Martinez de Victoria and Olza3–Reference Haines, Siega-Riz and Popkin5) . Depending on research objectives, the constructs of DQIs vary in the number of components, in cut-off values that define adherence to recommendations or optimal diet and in scoring criteria. Indices may be food based, nutrient based or a combination of both to best reflect their research purposes and may also be standardised to a 100-point scale to improve interpretability and for comparison with other indices(Reference Rodríguez-Martin, Alonso-Domínguez and Patino-Alonso6–Reference Krebs-Smith, Pannucci and Subar11).
Several systematic reviews have been conducted to identify, assess and summarise the quality of existing DQI(Reference Kant12–Reference Wirt and Collins14). Kant recommended food-based DQIs to account for the complexity of the whole diet(Reference Kant12). Indices of diet quality based on foods and food groups should undergo a validation process, be assessed against established parameters of nutritional status and be administered repeatedly to demonstrate reliability(Reference Kant13). In 2009, a systematic review on DQIs emphasised further the difficulties of direct comparison of the quality of indices, given their differences in design, and suggested that most indices required further validation to enable practical application to different contexts, such as the clinical field and in public health(Reference Wirt and Collins14). More recently in 2019, Trijsburg et al. conducted a systematic review on indices for low- and middle-income countries(Reference Trijsburg, Talsma and de Vries15). While the scope of the reviews differed, both concluded there was a need for more robust validation of the indices, especially in establishing an association with the intended health outcomes.
Given the numerous tools available, clinicians and researchers need to consider the constructs of the DQIs and their suitability in relation to research aims when selecting an appropriate index because no standard framework for the validation of DQI currently exists(Reference Wirt and Collins14–Reference Prinsen, Mokkink and Bouter16). Despite being non-region specific in its study selection, the previous systematic review conducted in 2009 did not identify DQIs developed based on the Australian Dietary Guidelines(Reference Wirt and Collins14). This omission presented a gap in the literature for identification of DQI that can be used in Australian contexts, including those with constructs similar to food groups or principles mentioned in the Australian Dietary Guidelines, and dietary patterns that are relevant to Australia, for example, Western eating pattern and the Mediterranean Diet (MD)(Reference Wirt and Collins14,17) . Thus, this review aims to provide clinicians and researchers with information on the new validated DQI by describing the indices and assessing their validation processes to facilitate decision making in the selection of the most appropriate tool for the defined purpose, within Australian settings(Reference Wirt and Collins14).
Methods
The study methods and reporting comply with the Preferred Reporting Items for Systematic Reviews and Meta-Analyses(Reference Moher, Liberati and Tetzlaff18).
Search strategy and eligibility criteria
The literature search was conducted in CINAHL, PubMed and Scopus to identify publications on existing validated DQI. Search strategies were created using Boolean operators ‘AND’ and ‘OR’. The basic search strategy was ‘(diet × OR ‘diet × qualit×’ OR food × OR meal×) AND (index OR indice × OR scor × OR tool × OR indicat × OR guideline × OR pattern × OR divers × OR variet×) OR ‘Healthy Eating Index’ OR ‘HEI’ OR ‘Healthy Eating Index for Australian’ OR ‘Aust-HEI’ OR ‘HEIFA’ OR ‘Mediterranean Diet Score’ OR ‘Diet Quality Index’ OR ‘DQI’ OR ‘Alternative Healthy Eating Index’ OR ‘AHEI’ OR ‘Recommended Food Score’. Limits applied included human, English language and published in 2010–2020. The full search strategy for each electronic database is attached in online Supplementary Material 1.
Study eligibility was guided by PICO (Population, Intervention, Comparator, Outcome) criteria: Population – adults 18 years of age and over; Intervention – DQI that have undergone a validation process as stated or indicated in the study to assess its ability to measure dietary patterns or diet quality; Comparator – N/A; Outcome – validity of indices to measure dietary patterns or diet quality. Articles were included if (i) they described and/or evaluated a DQI for its validity – which may include separate articles on the same tool; (ii) they stated an evaluation process to validate the tool or claimed validity of the tool; (iii) the tool was food based and measured more than one dimension of diet quality; and (iv) the tool was applicable to the Australian context – with constructs similar to food groups or principles reflected in the Australian Dietary Guidelines; dietary patterns prevalent in Australia, for example, Western eating pattern (characterised by high intake of processed meat, red meat, high-fat dairy products and refined grains); and MD(Reference Strate, Keeley and Cao19). For tools that have been regularly updated in accordance with national dietary guidelines, only the latest versions of the tools were included as they reflect the latest nutrition science.
Articles were excluded if (i) the tool was a nutrient-based index, due to the growing body of research on benefits of using a whole food approach, as reflected in the adoption of dietary patterns approach in national dietary guidelines globally and (ii) constructs of the DQI did not encompass key food groups of the Australian Dietary Guidelines(20–Reference Freeland-Graves and Nitzke22). Articles were not excluded based on study design.
Screening and data synthesis
Title–abstract eligibility for full-text screening was first assessed independently by two reviewers (M. S. T. and H. C. C.) and disagreements were resolved by consensus and then checked by a third reviewer (H. L. M. or L. J. R.). Subsequently, M. S. T. and H. C. C. performed full-text screening individually and cited references were checked for potentially relevant articles. All outcomes of the screening were cross-checked for proposed articles inclusions by M. S. T. and H. C. C., and any discrepancy was discussed until an agreement was reached, or on occasions referred for consensus decision by H. L. M. and L. J. R. on the final inclusion list.
Data extraction
Data extraction was performed by M. S. T. and H. C. C. who each independently extracted half of the included articles and reviewed one another’s extracted data. The information extracted from the studies included the index name, country where the study was held, basis of index and target population. Key features and limitations of the indices were extracted and summarised, including, constructs, scoring system and aspects of diet quality they measure. Indices were categorised according to their theoretical constructs (i.e. adherence to national dietary guidelines, MD pattern and for specific populations and chronic disease risk).
Quality assessment and risk of bias assessment
Quality of evidence assessment of the DQIs’ validation process consisted of two parts – quality assessment using Joanna Briggs Institute’s critical appraisal tools and the risk of bias assessment using Consensus-based Standards for the selection of health Measurement Instruments (COSMIN) Risk of Bias checklist(Reference Prinsen, Mokkink and Bouter16,Reference Aromataris and Munn23) . Validation methods used by the DQIs were also summarised.
Joanna Briggs Institute’s critical appraisal tools for cross-sectional and cohort studies were utilised to assess the methodological quality of the study design and the extent to which the study design addressed the possibility of bias. Each aspect was assessed with a ‘yes’, ‘no’, ‘unclear’ or ‘not applicable’ and a brief explanation was provided for those indicated with a ‘no’ or ‘unclear’. The overall rating of the quality assessment was allocated at the level of the criteria with the lowest quality rating.
The COSMIN Risk of Bias checklist was developed to assess the methodological quality of Patient-Reported Outcome Measures (PROMs): content validity, structural validity, internal consistency, cross-cultural validity, measurement invariance, reliability, measurement error, criterion validity, construct validity and responsiveness(Reference Prinsen, Mokkink and Bouter16). Each measurement property, apart from content validity, was rated on a 4-point rating scale of ‘very good’, ‘adequate’, ‘doubtful’ or ‘inadequate’ and an overall methodological quality score was derived by taking the worst score count of the standards that fall under the measurement property(Reference Prinsen, Mokkink and Bouter16). The standards used to evaluate content validity were not applicable to DQIs and therefore excluded from the appraisal. COSMIN components of structural validity, internal consistency, cross-cultural validity and measurement invariance – which reflects the internal structure of the tool – were not evaluated(Reference Prinsen, Mokkink and Bouter16).
M. S. T. and H. C. C. independently assessed the quality and risk of bias assessments, with each assessing 50 % of the included articles. Both reviewers then cross-checked half of each other’s allocated articles. Upon disagreement, discussions were conducted among both reviewers until 100 % agreement was reached and consistency in ratings was achieved.
Results
A total of twenty-seven studies and twenty-seven DQIs were included in the analysis(Reference Rodríguez-Martin, Alonso-Domínguez and Patino-Alonso6,Reference Chiuve, Fung and Rimm8,Reference Bailey, Miller and Mitchell24–Reference Zarrin, Ibiebele and Marks48) . Details of the literature search and selection processes are summarised in Fig. 1.
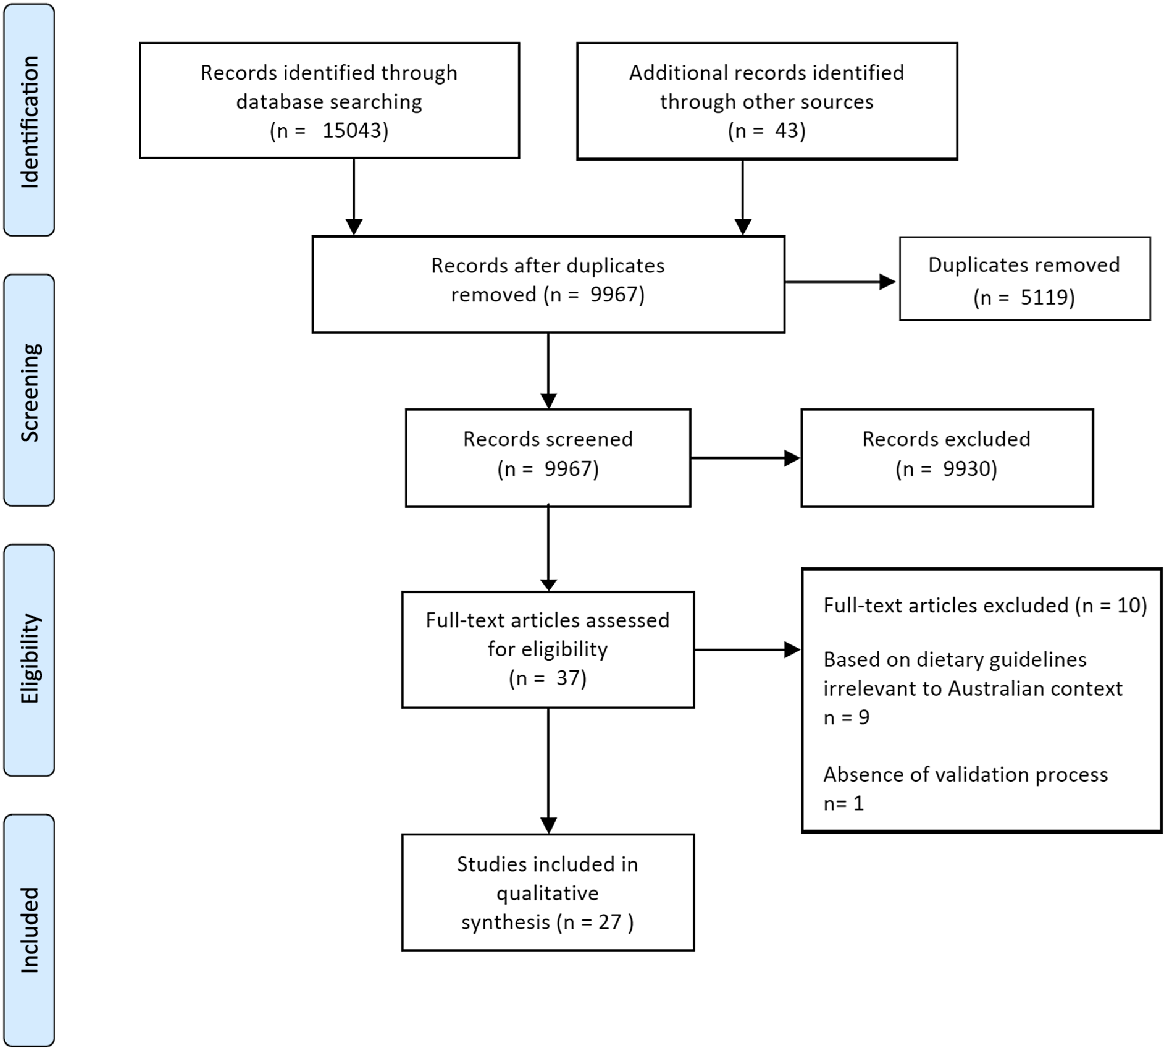
Fig. 1. Flow diagram of study selection for a systematic review of validated diet quality indices.
The indices were categorised into three broad groups depending on the dietary pattern they measured and their theoretical basis: thirteen indices were based on national dietary guidelines in Australia, Canada, New Zealand, Spain or the USA; eight were based on the MD published in Australia, Greece, Italy, Spain and USA; and six indices relating to specific sub-populations and chronic disease risk(Reference Rodríguez-Martin, Alonso-Domínguez and Patino-Alonso6,Reference Chiuve, Fung and Rimm8,Reference Bailey, Miller and Mitchell24–Reference Zarrin, Ibiebele and Marks48) . These included indices targeted at older adults or individuals at risk of CVD or assessed dietary patterns for the prevention of chronic diseases(Reference Chiuve, Fung and Rimm8,Reference Bailey, Miller and Mitchell24,Reference Jilcott, Keyserling and Samuel-Hodge28–Reference Marra, Thuppal and Johnson31,Reference O’Reilly and Mccann33,Reference Warren-Findlow, Reeve and Racine46) .
Scoring systems of the indices generally followed a positive-scoring algorithm where higher scores reflect better diet quality or greater adherence, and two DQIs have standardised scores out of 100 for easier interpretation and comparison(Reference Rodríguez-Martin, Alonso-Domínguez and Patino-Alonso6,Reference Rumawas, Dwyer and McKeown38) . All DQIs utilise continuous scores to reflect the extent to which the assessed diet conforms to the dietary guidelines. In addition, MEDI-LITE, Mediterranean Diet Serving Score, Evident Diet Index, Elderly Dietary Index and Dietary Screening Tool (DST) further translated the continuous scores to dichotomised scores to classify individuals as adherent or non-adherent to the diet(Reference Rodríguez-Martin, Alonso-Domínguez and Patino-Alonso6,Reference Bailey, Miller and Mitchell24,Reference Kourlaba, Polychronopoulos and Zampelas29,Reference Monteagudo, Mariscal-Arcas and Rivas32,Reference Sofi, Dinu and Pagliai42) . The descriptions of the included indices are summarised in Table 1.
Table 1. Characteristics of identified validated diet quality indices
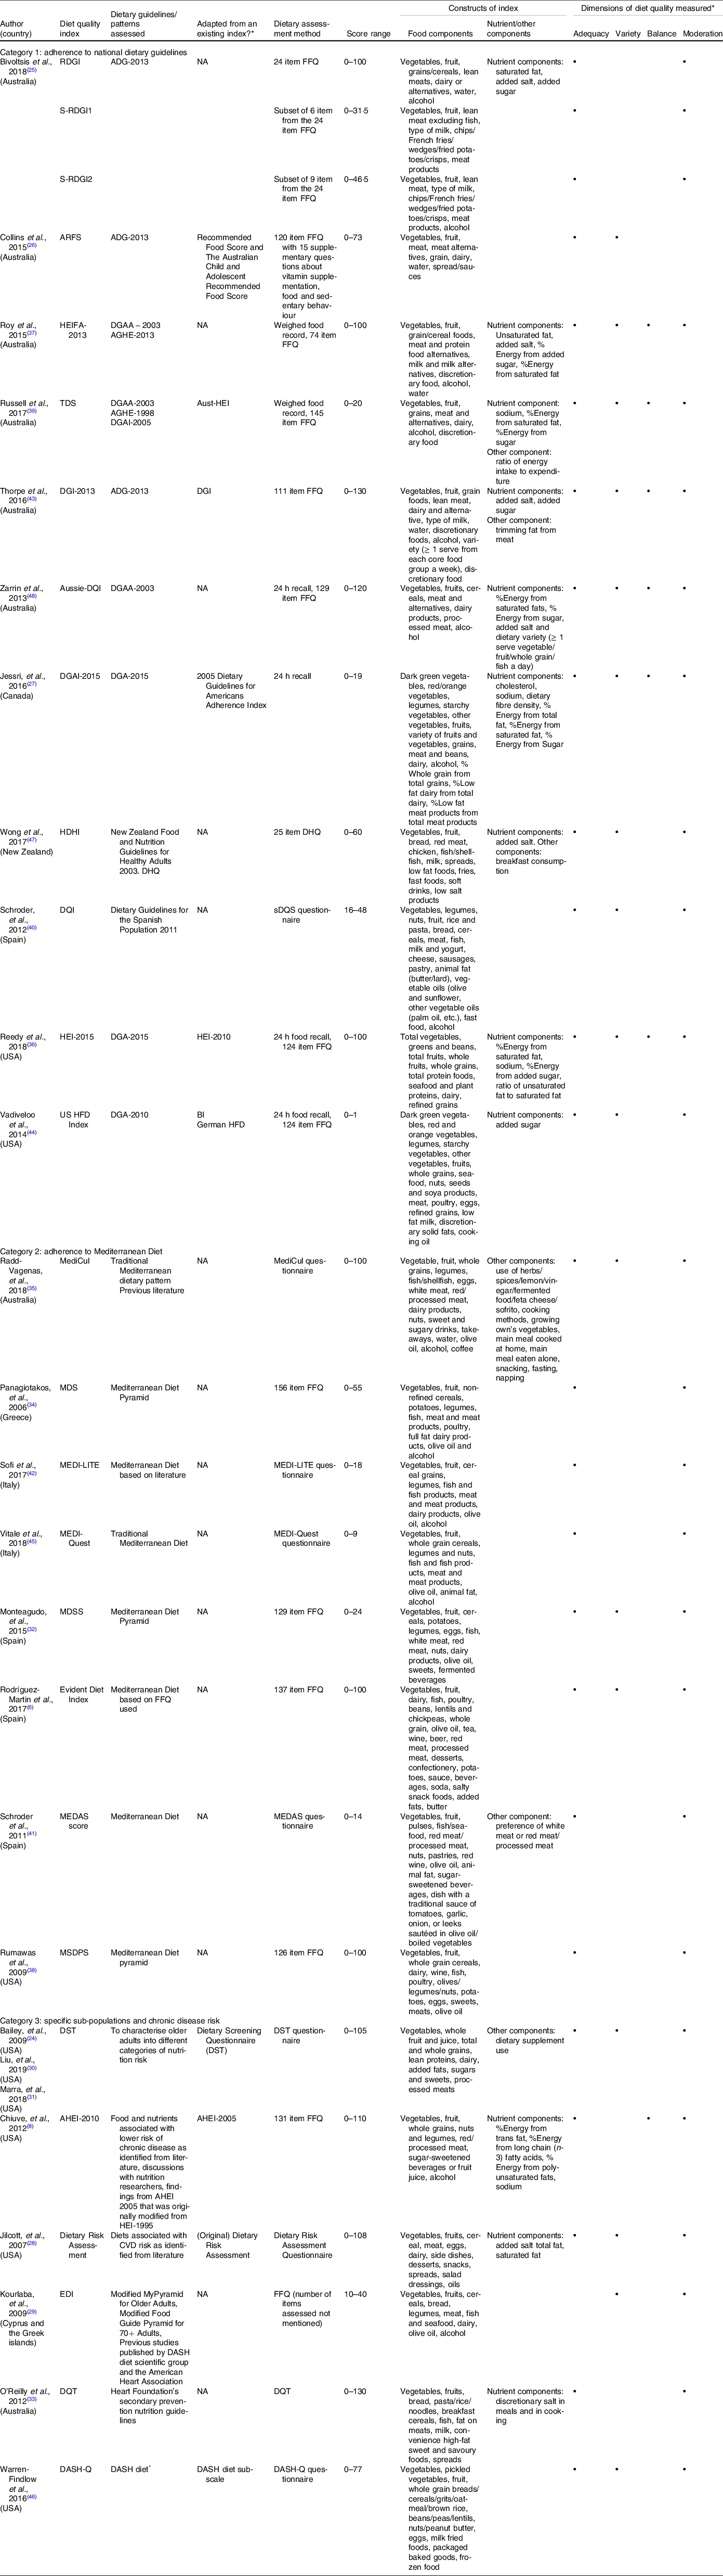
RDGI, RESIDE Dietary Guideline Index; S-RDGI1, Simple RESIDE Dietary Guideline Index 1; S-RDGI2, Simple RESIDE Dietary Guideline Index 2; ARFS, Australian Recommended Food Score; ADG, Australian Dietary Guidelines; NA, not applicable; HEIFA, Healthy Eating Index For Australian; DGAA, Dietary Guidelines For Australian Adults; AGHE, Australian Guide to Healthy Eating; TDS, Total Diet Score; DGAI, Dietary Guidelines Adherence Index; Aust-HEI, Australian Healthy Eating Index; DGI, Dietary Guideline Index; DQI, Diet Quality Index; DGA, Dietary Guidelines For Americans; HDHI, Healthy Dietary Habits Index; DHQ, Dietary Habits Questionnaire; sDQS, Short Diet Quality Screener; HEI, Healthy Eating Index; HFD, Healthy Food Diversity; BI, Berry Index; MediCul, Mediterranean Diet and Culinary Index; MDS, Mediterranean Diet Score; MDSS, Mediterranean Diet Serving Score; MEDAS, Mediterranean Diet Adherence Screener; MSDPS, Mediterranean-Style Dietary Pattern Score; DST, Dietary Screening Tool, AHEI, Alternative Healthy Eating Index; EDI, Elderly Dietary Index; DQT, Diet Quality Tool; DASH-Q, DASH Quality; DASH, Dietary Approaches To Stop Hypertension.
* These columns describe the dimensions of diet quality that are measured by the DQIs. These columns describe the dimensions of diet quality that are measured by the DQIs.
Common constructs and dimensions of diet quality measures
Category 1: national dietary guidelines
Most indices used an approach that measured a combination of whole foods and nutrients, and seven were based on food only(Reference Bivoltsis, Trapp and Knuiman25,Reference Collins, Burrows and Rollo26,Reference Reedy, Lerman and Krebs-Smith36,Reference Roy, Hebden and Rangan37,Reference Schröder, Benitez Arciniega and Soler40,Reference Vadiveloo, Dixon and Mijanovich44,Reference Wong, Haszard and Howe47) . The number of components included in the constructs of the indices varied, even for those indices based on the same dietary guidelines(Reference Bivoltsis, Trapp and Knuiman25,Reference Collins, Burrows and Rollo26,Reference Thorpe, Milte and Crawford43) . Only one index included a consideration of lifestyle factors, which was the frequency of breakfast consumption(Reference Wong, Haszard and Howe47). To measure dietary intake, most of the included studies utilised a FFQ or a specific questionnaire designed for this purpose(Reference Bivoltsis, Trapp and Knuiman25,Reference Collins, Burrows and Rollo26,Reference Reedy, Lerman and Krebs-Smith36,Reference Roy, Hebden and Rangan37,Reference Russell, Flood and Sadeghpour39,Reference Schröder, Benitez Arciniega and Soler40,Reference Thorpe, Milte and Crawford43,Reference Vadiveloo, Dixon and Mijanovich44,Reference Wong, Haszard and Howe47,Reference Zarrin, Ibiebele and Marks48) . In some cases, different studies utilised different dietary measurement tools for the same DQI(Reference Reedy, Lerman and Krebs-Smith36,Reference Roy, Hebden and Rangan37,Reference Russell, Flood and Sadeghpour39,Reference Vadiveloo, Dixon and Mijanovich44,Reference Zarrin, Ibiebele and Marks48) . The number of individual responses required to ascertain dietary intake in the dietary assessment method ranged from six for screening tools to more than 100 for indices using FFQ to assess dietary intake, indicating variability in respondent burden. DQI in this category measure at least two dimensions of diet quality, with ‘adequacy’ measured in all indices(Reference Bivoltsis, Trapp and Knuiman25–Reference Jessri, Lou and L’Abbé27,Reference Reedy, Lerman and Krebs-Smith36,Reference Roy, Hebden and Rangan37,Reference Russell, Flood and Sadeghpour39,Reference Schröder, Benitez Arciniega and Soler40,Reference Vadiveloo, Dixon and Mijanovich44,Reference Wong, Haszard and Howe47) . Healthy Eating Index For Australian 2013 (HEIFA-2013), Total Diet Score (TDS), Dietary Guideline Index 2013, Aussie Diet Quality Index, Dietary Guidelines Adherence Index 2015, Healthy Eating Index-2015 and the US Healthy Food Diversity Index all assessed dimensions of diet quality(Reference Jessri, Lou and L’Abbé27,Reference Reedy, Lerman and Krebs-Smith36,Reference Roy, Hebden and Rangan37,Reference Russell, Flood and Sadeghpour39,Reference Thorpe, Milte and Crawford43,Reference Vadiveloo, Dixon and Mijanovich44,Reference Zarrin, Ibiebele and Marks48) .
Category 2: adherence to the Mediterranean Diet
All indices in this category were published in the Mediterranean region including Greece, Italy and Spain, with the exceptions of Mediterranean Diet and Culinary Index (MediCul) and Mediterranean-Style Dietary Pattern Score which were published in Australia and the USA, respectively(Reference Rodríguez-Martin, Alonso-Domínguez and Patino-Alonso6,Reference Monteagudo, Mariscal-Arcas and Rivas32,Reference Panagiotakos, Pitsavos and Stefanadis34,Reference Radd-Vagenas, Fiatarone Singh and Inskip35,Reference Rumawas, Dwyer and McKeown38,Reference Schröder, Fitó and Estruch41,Reference Sofi, Dinu and Pagliai42,Reference Vitale, Racca and Izzo45) . All indices used a food-based approach only(Reference Rodríguez-Martin, Alonso-Domínguez and Patino-Alonso6,Reference Monteagudo, Mariscal-Arcas and Rivas32,Reference Panagiotakos, Pitsavos and Stefanadis34,Reference Radd-Vagenas, Fiatarone Singh and Inskip35,Reference Rumawas, Dwyer and McKeown38,Reference Schröder, Fitó and Estruch41,Reference Sofi, Dinu and Pagliai42,Reference Vitale, Racca and Izzo45) . Only MediCul assessed for lifestyle factors, which included habits with meal preparation, eating meals, fasting and napping(Reference Radd-Vagenas, Fiatarone Singh and Inskip35). DQIs of this category consist of the characteristic components: fish, olive oil and alcohol, due to their contribution to the beneficial effects of the Mediterranean dietary pattern, with olive oil (primarily) and fish contributing to the high unsaturated fat intake in the diet and the consumption of wine contributing to antioxidants(Reference Gerber, Scali and Michaud49,Reference Giacosa, Barale and Bavaresco50) . Some indices only assessed certain types of alcohol, such as wine only in MEDI-Quest, beer and wine only in Mediterranean Diet Serving Score, red wine only in Mediterranean Diet Adherence Screener (MEDAS) score(Reference Monteagudo, Mariscal-Arcas and Rivas32,Reference Schröder, Fitó and Estruch41,Reference Vitale, Racca and Izzo45) . Adequacy and moderation were assessed in all indices(Reference Rodríguez-Martin, Alonso-Domínguez and Patino-Alonso6,Reference Monteagudo, Mariscal-Arcas and Rivas32,Reference Panagiotakos, Pitsavos and Stefanadis34,Reference Radd-Vagenas, Fiatarone Singh and Inskip35,Reference Rumawas, Dwyer and McKeown38,Reference Schröder, Fitó and Estruch41,Reference Sofi, Dinu and Pagliai42,Reference Vitale, Racca and Izzo45) . None of the indices measured ‘balance’(Reference Rodríguez-Martin, Alonso-Domínguez and Patino-Alonso6,Reference Monteagudo, Mariscal-Arcas and Rivas32,Reference Panagiotakos, Pitsavos and Stefanadis34,Reference Radd-Vagenas, Fiatarone Singh and Inskip35,Reference Rumawas, Dwyer and McKeown38,Reference Schröder, Fitó and Estruch41,Reference Sofi, Dinu and Pagliai42,Reference Vitale, Racca and Izzo45) .
Category 3: specific sub-populations and chronic disease risk
Alternative Healthy Eating Index (AHEI-2010), Dietary Risk Assessment (DRA), Diet Quality Tool (DQT) and Dietary Approaches To Stop Hypertension Quality (DASH-Q) were based on literature-identified evidence, multiple modified national or disease-specific dietary guidelines, or a combination of these(Reference Chiuve, Fung and Rimm8,Reference Jilcott, Keyserling and Samuel-Hodge28,Reference O’Reilly and Mccann33,Reference Warren-Findlow, Reeve and Racine46) . Indices in this category used a food-based approach, with the exceptions of AHEI-2010 and DRA that utilised both food and nutrient components(Reference Chiuve, Fung and Rimm8,Reference Bailey, Miller and Mitchell24,Reference Jilcott, Keyserling and Samuel-Hodge28–Reference Marra, Thuppal and Johnson31,Reference O’Reilly and Mccann33,Reference Warren-Findlow, Reeve and Racine46) . Since AHEI-2010, DQT, DRA and DASH-Q are disease-related DQIs, their constructs include food and nutrients of concern(Reference Chiuve, Fung and Rimm8,Reference Collins, Burrows and Rollo26,Reference Marra, Thuppal and Johnson31,Reference Vadiveloo, Dixon and Mijanovich44) . For example, high-sodium foods were included in DASH-Q and constructs of DQT more specifically focused on dietary fats(Reference O’Reilly and Mccann33,Reference Warren-Findlow, Reeve and Racine46) . Elderly Dietary Index and DST were both developed for older adults and included similar basic food groups in their constructs (fruits, vegetables, meat, dairy and grains)(Reference Bailey, Miller and Mitchell24,Reference Kourlaba, Polychronopoulos and Zampelas29–Reference Marra, Thuppal and Johnson31) . However, Elderly Dietary Index consists of elements from MD (olive oil, fish and alcohol) as it was developed in the Mediterranean region, whereas DST aims to identify individuals at risk of malnutrition and, therefore, awarded more points for dietary supplement use(Reference Bailey, Miller and Mitchell24,Reference Kourlaba, Polychronopoulos and Zampelas29–Reference Marra, Thuppal and Johnson31) . Four indices measured three dimensions of diet quality and two indices measured two dimensions.
Scoring system
For most of the indices, score calculation involved the simple summation of individual construct scores, with the exceptions of EVIDENT Diet Score and Mediterranean-Style Dietary Pattern Score which involved standardising the total score into a 0–100 range(Reference Rodríguez-Martin, Alonso-Domínguez and Patino-Alonso6,Reference Chiuve, Fung and Rimm8,Reference Bailey, Miller and Mitchell24–Reference Zarrin, Ibiebele and Marks48) . Individual constructs are scored based on inclusion or exclusion in diet, meeting specific cut-off values for minimum or maximum intake, or scored in proportion to a defined range based on guidelines. Indices may attribute additional points for certain dietary behaviours such as choosing non-refined grains over refined grains or having fish or white meat over red or processed meat depending on the dietary pattern being assessed. However, six indices penalised individuals for having intakes exceeding the recommended serve of a food group(Reference Kourlaba, Polychronopoulos and Zampelas29,Reference Monteagudo, Mariscal-Arcas and Rivas32,Reference Rumawas, Dwyer and McKeown38,Reference Sofi, Dinu and Pagliai42,Reference Vitale, Racca and Izzo45,Reference Zarrin, Ibiebele and Marks48) . For example, Aussie Diet Quality Index assigned a lower score to individuals having more than four serves of dairy per day than those only having two to four serves(Reference Zarrin, Ibiebele and Marks48).
In many indices, meat and meat alternatives were scored separately as independent adequacy constructs(Reference Rodríguez-Martin, Alonso-Domínguez and Patino-Alonso6,Reference Bivoltsis, Trapp and Knuiman25,Reference Collins, Burrows and Rollo26,Reference Monteagudo, Mariscal-Arcas and Rivas32,Reference Panagiotakos, Pitsavos and Stefanadis34,Reference Radd-Vagenas, Fiatarone Singh and Inskip35,Reference Rumawas, Dwyer and McKeown38–Reference Vitale, Racca and Izzo45,Reference Wong, Haszard and Howe47,Reference Zarrin, Ibiebele and Marks48) . The exceptions were HEIFA-2013, Dietary Guideline Index 2013, Dietary Guidelines Adherence Index 2015 and Healthy Eating Index-2015, which scored meat alternatives in the same component as meat(Reference Jessri, Lou and L’Abbé27,Reference Reedy, Lerman and Krebs-Smith36,Reference Roy, Hebden and Rangan37,Reference Thorpe, Milte and Crawford43) . DASH-Q included nuts or legumes as constructs, and only measured processed meat intake, with no meat constructs(Reference Warren-Findlow, Reeve and Racine46). For AHEI-2010, no penalty was given for having no meat intake because meat was scored as a ‘moderation component’ where meat intake is to be limited(Reference Chiuve, Fung and Rimm8). See online Supplementary Material 2 for details on the scoring systems of DQI.
Quality of evidence and validation framework
Table 2 summarises the indices’ overall quality of evidence, including the outcomes of risk of bias and quality assessments, limitations and implications for use(Reference Rodríguez-Martin, Alonso-Domínguez and Patino-Alonso6,Reference Chiuve, Fung and Rimm8,Reference Bailey, Miller and Mitchell24–Reference Zarrin, Ibiebele and Marks48) .
Table 2. Quality of evidence of diet quality indices
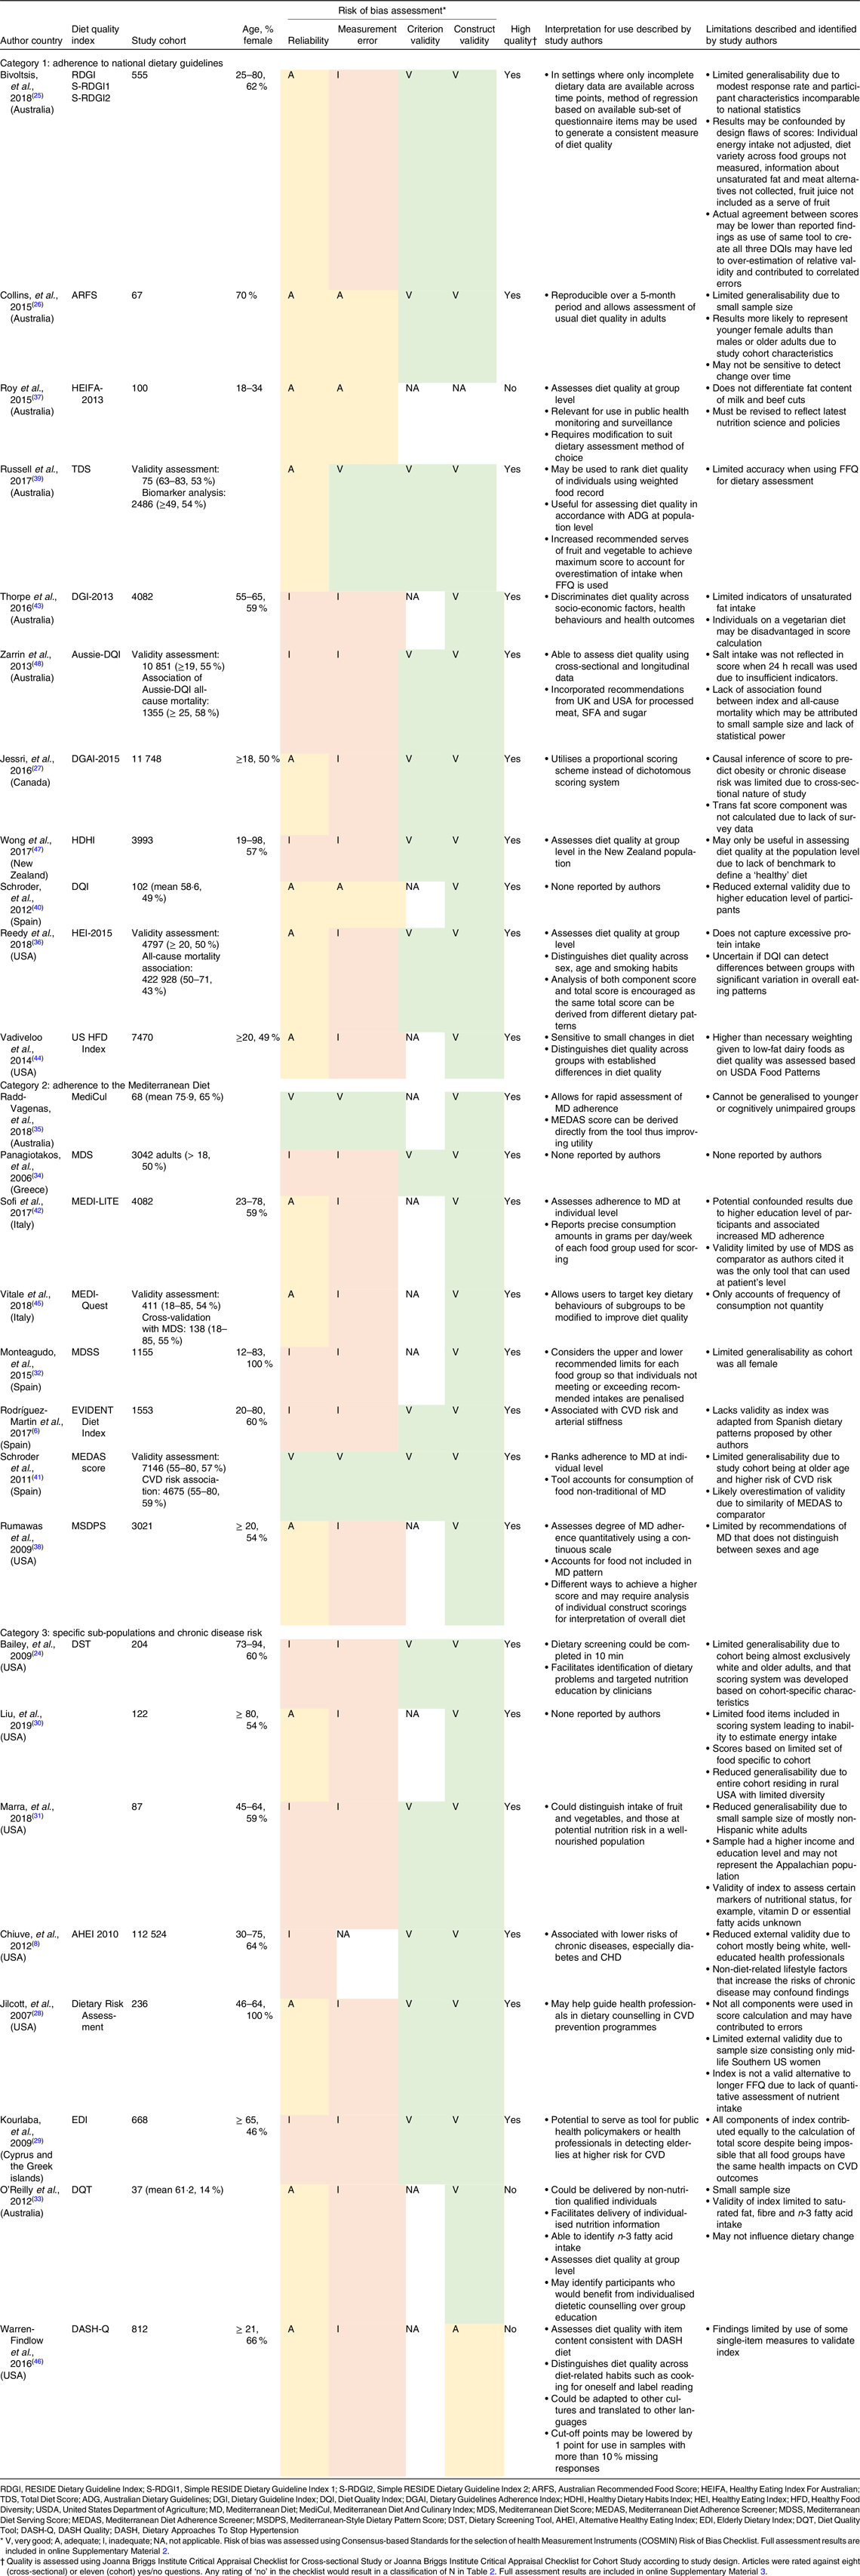
The Joanna Briggs Institute’s quality assessment determined all but HEIFA-2013, DASH-Q and DQT to have clearly defined criteria for participant inclusion, measurement and objective statistical analysis(Reference Rodríguez-Martin, Alonso-Domínguez and Patino-Alonso6,Reference Chiuve, Fung and Rimm8,Reference Bailey, Miller and Mitchell24–Reference Zarrin, Ibiebele and Marks48) . The risk of bias assessment deemed seven studies of category 1, six studies of category 2 and eight studies of category 3 to be at an increased risk of bias(Reference Rodríguez-Martin, Alonso-Domínguez and Patino-Alonso6,Reference Chiuve, Fung and Rimm8,Reference Bailey, Miller and Mitchell24,Reference Bivoltsis, Trapp and Knuiman25,Reference Jessri, Lou and L’Abbé27–Reference Panagiotakos, Pitsavos and Stefanadis34,Reference Reedy, Lerman and Krebs-Smith36,Reference Rumawas, Dwyer and McKeown38,Reference Sofi, Dinu and Pagliai42–Reference Zarrin, Ibiebele and Marks48) .
Table 3 summarises the validation methods used in the studies in demonstration of their validity and key findings of the indices(Reference Rodríguez-Martin, Alonso-Domínguez and Patino-Alonso6,Reference Chiuve, Fung and Rimm8,Reference Bailey, Miller and Mitchell24–Reference Zarrin, Ibiebele and Marks48) . The validation methods varied largely across indices or studies, and each index may have been evaluated using several means to establish validity(Reference Rodríguez-Martin, Alonso-Domínguez and Patino-Alonso6,Reference Chiuve, Fung and Rimm8,Reference Bailey, Miller and Mitchell24–Reference Zarrin, Ibiebele and Marks48) . Construct validity was most commonly assessed. Risk of bias in this area was well-accounted for in the validation process as all indices, except HEIFA-2013 and DASH-Q, were rated ‘very good’ according to COSMIN(Reference Rodríguez-Martin, Alonso-Domínguez and Patino-Alonso6,Reference Chiuve, Fung and Rimm8,Reference Bailey, Miller and Mitchell24–Reference Reedy, Lerman and Krebs-Smith36,Reference Rumawas, Dwyer and McKeown38–Reference Vitale, Racca and Izzo45,Reference Wong, Haszard and Howe47,Reference Zarrin, Ibiebele and Marks48) . Most of the indices were evaluated for their association or correlation between index scores and a healthful food or nutrient profile in participants’ diets(Reference Bailey, Miller and Mitchell24,Reference Bivoltsis, Trapp and Knuiman25,Reference Jessri, Lou and L’Abbé27–Reference Kourlaba, Polychronopoulos and Zampelas29,Reference Marra, Thuppal and Johnson31,Reference O’Reilly and Mccann33–Reference Rumawas, Dwyer and McKeown38,Reference Schröder, Benitez Arciniega and Soler40,Reference Schröder, Fitó and Estruch41,Reference Vadiveloo, Dixon and Mijanovich44,Reference Warren-Findlow, Reeve and Racine46–Reference Zarrin, Ibiebele and Marks48) . This was to determine if an index was able to attribute a more favourable score to individuals with better diet quality (i.e. increased adherence to the dietary pattern being assessed). Most indices were also evaluated for their ability to measure diet quality independent of energy intake through inclusion in scoring system or adjustments in statistical analysis(Reference Rodríguez-Martin, Alonso-Domínguez and Patino-Alonso6,Reference Chiuve, Fung and Rimm8,Reference Collins, Burrows and Rollo26–Reference Jilcott, Keyserling and Samuel-Hodge28,Reference Liu, Gao and Mitchell30,Reference Marra, Thuppal and Johnson31,Reference Panagiotakos, Pitsavos and Stefanadis34,Reference Reedy, Lerman and Krebs-Smith36,Reference Rumawas, Dwyer and McKeown38,Reference Russell, Flood and Sadeghpour39,Reference Schröder, Fitó and Estruch41,Reference Vadiveloo, Dixon and Mijanovich44,Reference Wong, Haszard and Howe47,Reference Zarrin, Ibiebele and Marks48) . In addition, five indices were evaluated against existing validated DQI by determining the extent of agreement between overall scores or between the scores of similar constructs present in both(Reference Rodríguez-Martin, Alonso-Domínguez and Patino-Alonso6,Reference Liu, Gao and Mitchell30,Reference Monteagudo, Mariscal-Arcas and Rivas32,Reference Sofi, Dinu and Pagliai42,Reference Vitale, Racca and Izzo45) .
Table 3. Key validation framework and findings
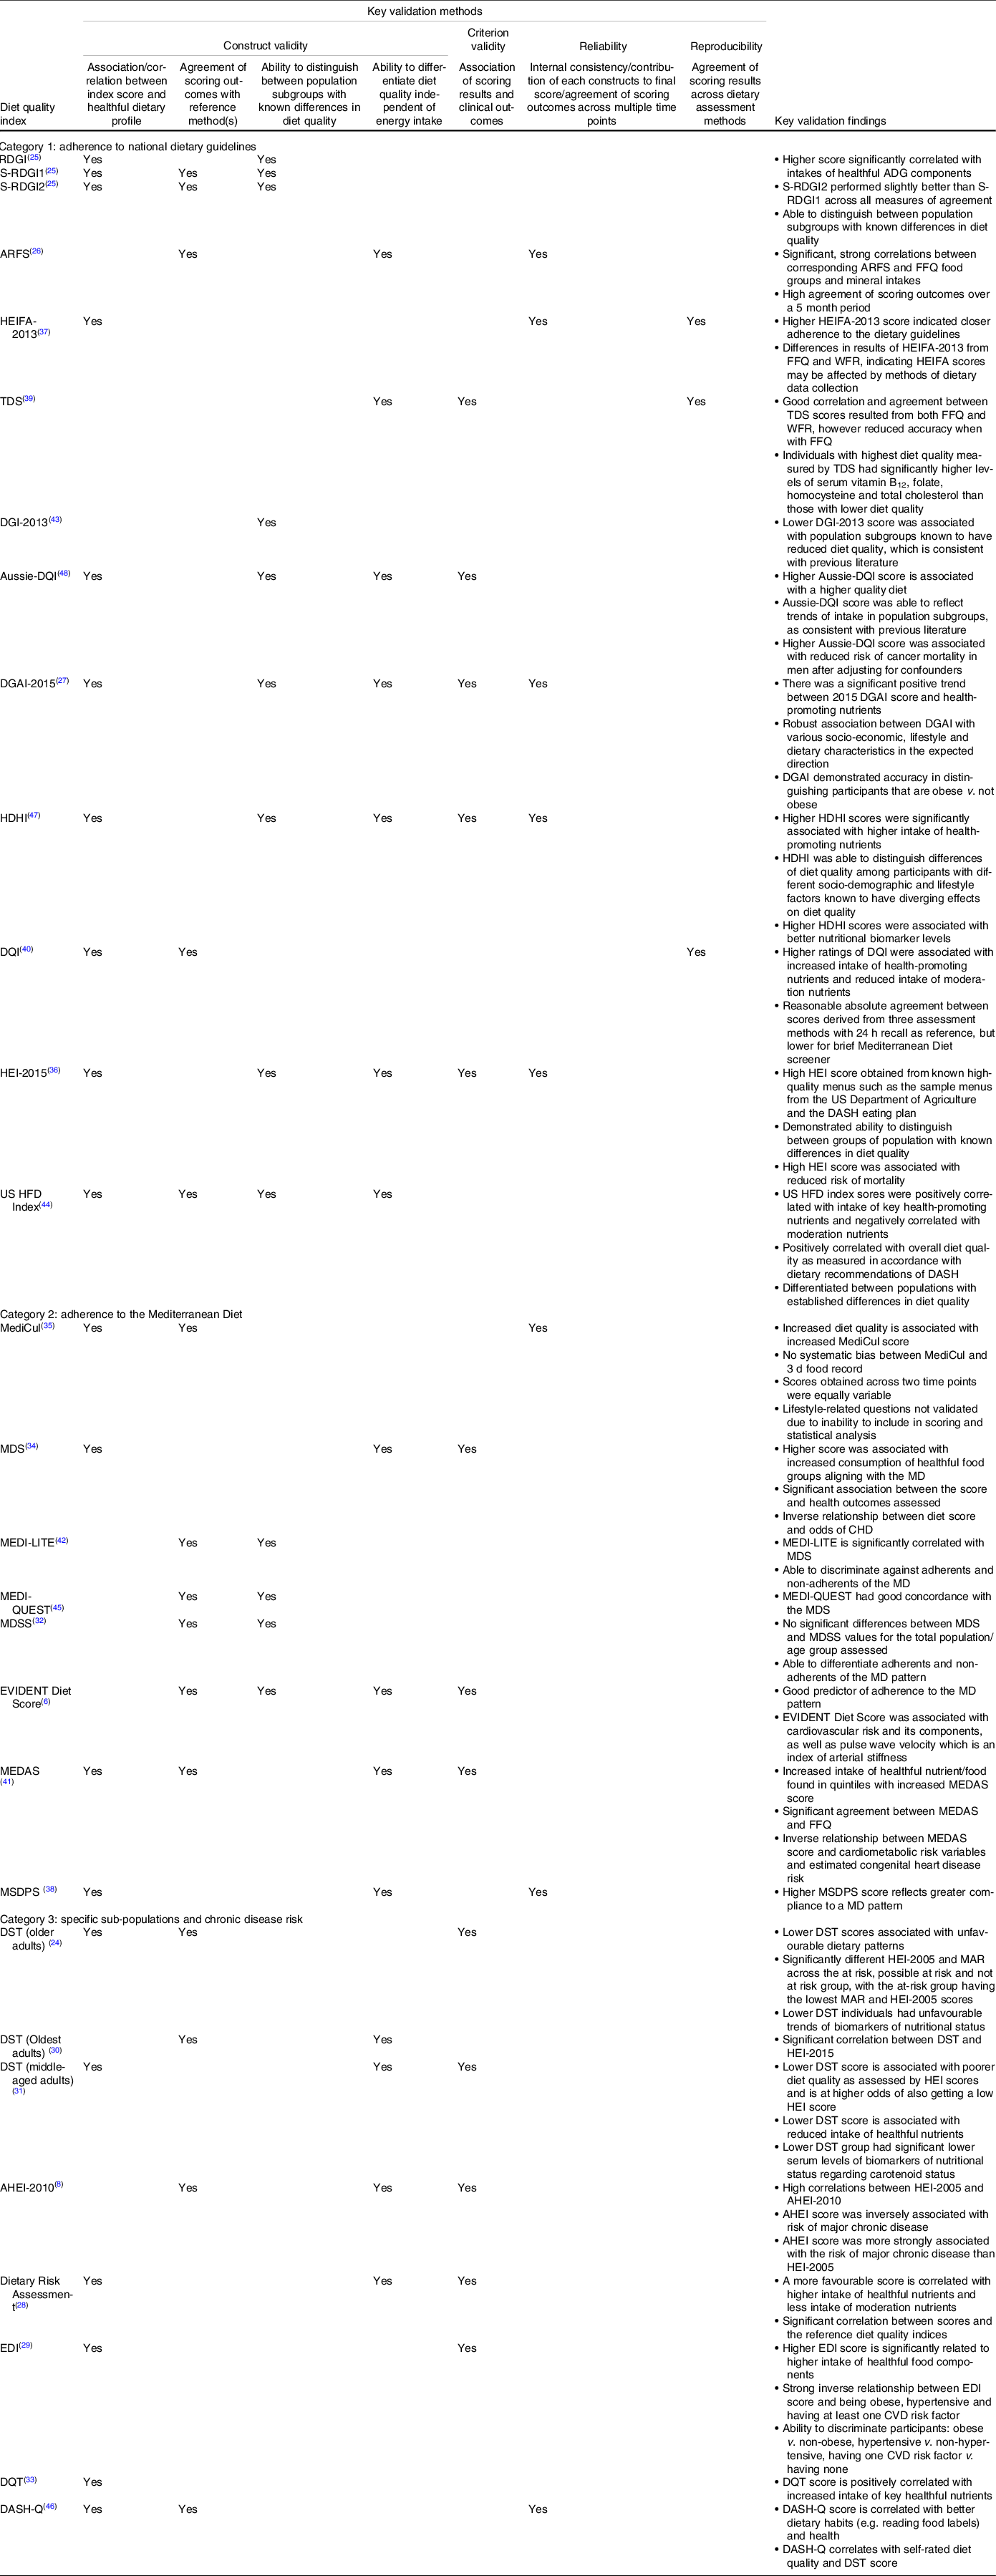
RDGI, RESIDE Dietary Guideline Index; S-RDGI1, Simple RESIDE Dietary Guideline Index 1; S-RDGI2, Simple RESIDE Dietary Guideline Index 2; ARFS, Australian Recommended Food Score; WFR, Weighted Food Record; HEIFA, Healthy Eating Index For Australian; TDS, Total Diet Score; DGI, Dietary Guideline Index; DQI, Diet Quality Index; DGAI, Dietary Guidelines Adherence Index; HDHI, Healthy Dietary Habits Index; HEI, Healthy Eating Index; HFD, Healthy Food Diversity; MediCul, Mediterranean Diet And Culinary; MDS, Mediterranean Diet Score; MD, Mediterranean Diet; MEDAS, Mediterranean Diet Adherence Screener; MDSS, Mediterranean Diet Serving Score; MEDAS, Mediterranean Diet Adherence Screener; MSDPS, Mediterranean-Style Dietary Pattern Score; DST, Dietary Screening Tool; MAR, Mean Adequacy Ratio; AHEI, Alternate Healthy Eating Index; EDI, Elderly Dietary Index; DQT, Diet Quality Tool; DASH, Dietary Approaches To Stop Hypertension; DASH-Q, DASH Quality.
To establish criterion validity, many indices were evaluated for their association with clinical outcomes which resulted in ‘very good’ ratings on the risk of bias assessment(Reference Rodríguez-Martin, Alonso-Domínguez and Patino-Alonso6,Reference Chiuve, Fung and Rimm8,Reference Jessri, Lou and L’Abbé27,Reference Kourlaba, Polychronopoulos and Zampelas29–Reference Marra, Thuppal and Johnson31,Reference Panagiotakos, Pitsavos and Stefanadis34,Reference Reedy, Lerman and Krebs-Smith36,Reference Russell, Flood and Sadeghpour39,Reference Schröder, Fitó and Estruch41,Reference Wong, Haszard and Howe47,Reference Zarrin, Ibiebele and Marks48) . In addition, derivatives of RESIDE Dietary Guideline Index, S-RESIDE Dietary Guideline Index 1 and 2, and Australian Recommended Food Score have been compared with their original longer version RESIDE Dietary Guideline Index and the FFQ, respectively, and thus awarded ‘very good’ ratings based on COSMIN guidelines as well(Reference Bivoltsis, Trapp and Knuiman25,Reference Collins, Burrows and Rollo26) .
Risk of bias in establishing reliability and measurement error was least assessed by indices(Reference Rodríguez-Martin, Alonso-Domínguez and Patino-Alonso6,Reference Chiuve, Fung and Rimm8,Reference Bailey, Miller and Mitchell24–Reference Zarrin, Ibiebele and Marks48) . Only MediCul and MEDAS score achieved ‘very good’ rating for reliability and only TDS, MediCul and MEDAS score were rated ‘very good’ for measurement error(Reference Radd-Vagenas, Fiatarone Singh and Inskip35,Reference Russell, Flood and Sadeghpour39,Reference Schröder, Fitó and Estruch41) . Indices that were rated ‘adequate’ determined reliability using Pearson or Spearman correlation coefficients instead of using the standard of intraclass correlation coefficient recommended by COSMIN(Reference Collins, Burrows and Rollo26,Reference Jessri, Lou and L’Abbé27,Reference Radd-Vagenas, Fiatarone Singh and Inskip35–Reference Rumawas, Dwyer and McKeown38,Reference Warren-Findlow, Reeve and Racine46) . For measurement error, COSMIN requires evaluation by administering the DQI at least twice using the same instrument. Most indices were only administered once and therefore measurement error could not be assessed. In studies where the DQI was administered twice, the dietary measurement tool used to measure intake was different. For example, limits of agreement were calculated for the HEIFA scores, TDS scores, MediCul scores derived from weighed food record and FFQ, and MEDAS scores derived from the FFQ and the screener(Reference Roy, Hebden and Rangan37,Reference Russell, Flood and Sadeghpour39,Reference Schröder, Fitó and Estruch41,Reference Radd-Vagenas, Singh and Daniel51) . In the context of DQIs, measurement error presents as a systematic error stemming from its design. Deviation from the ‘true diet quality value’ occurs during translation of dietary intake into usable data for score calculation. DQIs need to capture the underlying construct of diet quality and some studies have calculated Cronbach’s α to capture systematic variance underlying the components(Reference Jessri, Lou and L’Abbé27,Reference Reedy, Lerman and Krebs-Smith36,Reference Roy, Hebden and Rangan37,Reference Warren-Findlow, Reeve and Racine46,Reference Wong, Haszard and Howe47) . Others have used an existing DQI to quantify the effect of measurement error, as described above(Reference Rodríguez-Martin, Alonso-Domínguez and Patino-Alonso6,Reference Liu, Gao and Mitchell30,Reference Monteagudo, Mariscal-Arcas and Rivas32,Reference Sofi, Dinu and Pagliai42,Reference Vitale, Racca and Izzo45) .
A common limitation for all the indices was their limited generalisability to the entire population as tested in specific sub-populations(Reference Rodríguez-Martin, Alonso-Domínguez and Patino-Alonso6,Reference Chiuve, Fung and Rimm8,Reference Bailey, Miller and Mitchell24–Reference Zarrin, Ibiebele and Marks48) . For example, the study samples for Australian Recommended Food Score and HEIFA-2013 were predominantly young adults and did not represent national population characteristics, and the items included in the DRA were specific to the Southern US region(Reference Collins, Burrows and Rollo26,Reference Jilcott, Keyserling and Samuel-Hodge28,Reference Roy, Hebden and Rangan37) . Studies were prone to inherent errors from portion size estimation, seasonal variations and recall bias due to score calculations being based on self-reported dietary intake(Reference Rodríguez-Martin, Alonso-Domínguez and Patino-Alonso6,Reference Chiuve, Fung and Rimm8,Reference Bailey, Miller and Mitchell24–Reference Zarrin, Ibiebele and Marks48) . Memory-based tools such as FFQ and 24-h recalls have been cited for misreporting dietary intake as they report on participants’ perceived intake rather than the actual intake(Reference Archer, Marlow and Lavie52). This was somewhat accounted for by studies via adjustments in their statistical models, such as excluding participants with an unreasonably high or low energy intake though they have been criticised for alteration of data(Reference Archer, Pavela and Lavie53).
Discussion
The current systematic review provides an update to the previous review conducted by Wirt and Collins and identified twenty-seven new or updated validated DQI(Reference Rodríguez-Martin, Alonso-Domínguez and Patino-Alonso6,Reference Chiuve, Fung and Rimm8,Reference Wirt and Collins14,Reference Bailey, Miller and Mitchell24–Reference Zarrin, Ibiebele and Marks48) . This study is the first to provide a summary and evaluation of the extent of validity of DQIs. The DQIs exhibit similarities and differences in their constructs and the dimensions of diet quality they measure inter- and intra-category. Among the DQIs, Australian Recommended Food Score, HEIFA-2013, TDS, DQI, MediCul, MEDAS met COSMIN’s criteria on the risk of bias assessment for the validation method used and received ‘adequate’ or ‘very good’ rating(s) for the validation evidence they provided(Reference Chiuve, Fung and Rimm8,Reference Radd-Vagenas, Fiatarone Singh and Inskip35,Reference Roy, Hebden and Rangan37,Reference Russell, Flood and Sadeghpour39–Reference Schröder, Fitó and Estruch41) . None provided all four types of validation evidence (construct validity, criterion validity, reliability and reproducibility). Although few produced satisfactory evidence in demonstration of validity, the DQIs remain relevant as nutrition tools so long as their purposes and shortcomings are recognised.
The current review observed diversity in the dimensions that DQI measure and their constructs across categories due to differing research aims. Indices in Categories 1 and 3 may include ‘balance’ and ‘variety’ dimensions to reflect the principles of national dietary guidelines and nutrition recommendations specific to disease. However, few indices in category 2 (measure adherence to MD) include those dimensions. Compared with DQI for national dietary guidelines, the Mediterranean dietary pattern emphasises consumption of cardiac-protective foods included in the MD pyramid (adequacy) and reducing foods non-adherent to the diet (moderation). Therefore, it may not be necessary to measure the other dimensions, especially ‘balance’ as adherence to the MD should result in high unsaturated fatty acid intake.
Within categories of indices, differences in the constructs could also be observed. This is likely due to subjectivity introduced by the researchers in their interpretation of guidelines during the development of indices. Weightage of each dietary component was at the discretion of the researchers as only food and nutrients were mentioned in the guidelines. These differences in weightage affect the scoring system and consequently their association with health outcomes. Strength of association with health outcomes may be flawed if the constructs were not appropriately weighed in representation of their significance to the diet the DQI aims to evaluate. For example, if vegetable intake was assigned a disproportionally low weighting in the scoring system of a DQI designed to evaluate cardiovascular risk, individuals with the same saturated fat intake but lower vegetable intake may be given similar diet quality scores. This would weaken the strength of association between the DQI and CVD because the DQI is unable to differentiate individuals with varying vegetable intake in relation to their cardiovascular risk. The insufficient variation in scores reflects poor construct validity of the DQI and affects its predictability of health outcomes. Thus, when selecting DQI for identifying associations between dietary patterns and health outcomes, it is essential to recognise the inter-relationships between dietary components and health outcomes especially for DQI used in predicting chronic disease risk.
Besides using continuous scores, some indices also used dichotomous scores to classify the participants according to adherence or non-adherence to the defined guidelines. Cut-off points for categorisation were determined by comparison with a reference to calculate the degree of agreement (Bland–Altman plot) or Cohen’s kappa and subsequently, sensitivity and specificity. However, the quantitative definition of a high-quality diet is population specific because the DQI were validated based on the data set of the sample. For instance, cut-off points defined by validating DQI in the Australian population cannot be used for categorising individuals as adherent or non-adherent in the US population, although the index itself may still be used to assess individuals within the US population. This limits the usefulness of comparing dichotomous scores of the same DQI across populations as well as correlations with health outcomes(Reference Ocké54).
General dietary habits within a population also need to be considered to ensure a lower score is attributable to poor diet quality only, and not individuals’ lifestyle or cultural choices(Reference Vitale, Racca and Izzo45). Few indices accommodated vegan or vegetarian diets, placing individuals on these diets at disadvantage when some indices are used(Reference Jessri, Lou and L’Abbé27,Reference Kourlaba, Polychronopoulos and Zampelas29,Reference Monteagudo, Mariscal-Arcas and Rivas32,Reference Reedy, Lerman and Krebs-Smith36–Reference Rumawas, Dwyer and McKeown38,Reference Sofi, Dinu and Pagliai42,Reference Thorpe, Milte and Crawford43,Reference Vitale, Racca and Izzo45,Reference Zarrin, Ibiebele and Marks48) . In view of a global push for more plant-based diets, there is a need for indices to be more inclusive when assessing dietary protein, fat and iron intake, especially those aiming to assess populations with diverse cultural dietary patterns.
This review illustrated wide variations in validation processes between indices. As there is no gold standard for diet quality, assessment of validity is varied and subjective(Reference Newby, Hu and Rimm55). It is notable that most of the indices did not meet the standard by COSMIN to receive ‘very good’ rating due to the use of a different validation method(Reference Rodríguez-Martin, Alonso-Domínguez and Patino-Alonso6,Reference Chiuve, Fung and Rimm8,Reference Bailey, Miller and Mitchell24–Reference Panagiotakos, Pitsavos and Stefanadis34,Reference Reedy, Lerman and Krebs-Smith36–Reference Schröder, Benitez Arciniega and Soler40,Reference Sofi, Dinu and Pagliai42–Reference Zarrin, Ibiebele and Marks48) . Therefore, exercising caution is necessary when interpreting validation evidence as the quality of the validation is only as robust as the standard it was held against.
Researchers need to determine if the validation evidence of each index was adequate to support their use, and whether the validation framework used was low in risk of bias for the results to be reliable(Reference Wirt and Collins14). For example, despite providing evidence of validity in different population groups, DST has only been tested for its reliability by Liu et al. in the oldest-old population group(Reference Liu, Gao and Mitchell30). None of the three studies on DST evaluated the measurement error component(Reference Bivoltsis, Trapp and Knuiman25,Reference Liu, Gao and Mitchell30,Reference Marra, Thuppal and Johnson31) . The validation process is subjected to measurement error due to the nature of dietary collection tools. In particular, establishing associations between diet quality and clinical outcomes needs to be scrutinised in recognition that diet quality was determined based on perceived intake. However, the validity of DQI should not be entirely equated to that of dietary collection tools as they are separate entities.
When using a reference DQI to calibrate measurement error, the reference tool should ideally be free of systematic error(Reference Bennett, Landry and Little56). New DQIs are often compared with existing ones which are considered to be more validated. However, the index has limited generalisability as there is no gold standard DQI reference and the relative validity has been determined using an imperfect reference(Reference Bennett, Landry and Little56). Furthermore, few research administered the DQI twice using the same tool to allow for its evaluation of measurement error and majority were not assessed for validity of use across different dietary collection tools(Reference Rodríguez-Martin, Alonso-Domínguez and Patino-Alonso6,Reference Chiuve, Fung and Rimm8,Reference Bailey, Miller and Mitchell24–Reference Zarrin, Ibiebele and Marks48) . Reliability across different time points was only measured by Australian Recommended Food Score and MediCul(Reference Collins, Burrows and Rollo26,Reference Radd-Vagenas, Fiatarone Singh and Inskip35) . Given that DQIs have been used in longitudinal studies and interventions, it signifies the need for researchers to undertake more extensive validation studies to establish confidence in measuring dietary change(Reference Carbonneau, Bégin and Lemieux57–Reference Perkins, Daley and Yerxa59), and specifically, to evaluate test–retest reliability and use varied dietary data collection methods when developing DQI.
Considerations for selecting a suitable diet quality assessment tool
Three key factors should be taken into consideration when selecting a suitable DQI: research aims, scoring system and validation evidence. When assessing diet quality based on adherence to national dietary guidelines, DQIs need to be revised to be inclusive and reflect the latest evidence. For specific diets, the suitability of a ‘relative’ v. ‘absolute’ approach in scoring needs to be considered. Caution is to be exercised when using predefined cut-off points to categorise individuals’ adherence to dietary patterns as they are population specific and may not be applicable for cross-population use. At the individual level, DQI that are easy and rapid to administer are more appropriate for assessing diet quality in a time-limited clinical setting to identify at-risk individuals due to lower respondent burden. These indices are usually used with a designated questionnaire or a screener that allows assessment to be completed quickly compared with more comprehensive dietary assessment methods like FFQ. Screeners and short tools include RESIDE Dietary Guideline Index and its derivatives, DQI, MEDI-LITE, MEDAS score, DST, DQT and DASH-Q(Reference Bailey, Miller and Mitchell24,Reference Bivoltsis, Trapp and Knuiman25,Reference O’Reilly and Mccann33,Reference Schröder, Benitez Arciniega and Soler40–Reference Sofi, Dinu and Pagliai42,Reference Warren-Findlow, Reeve and Racine46) . Indices such as DQT may also be designed to identify specific areas of the diet that require attention to support nutrition counselling(Reference O’Reilly and Mccann33). At the group level, indices suitable for assessment can distinguish diet quality within population subgroups and can be used for public health monitoring and surveillance, though validity for monitoring changes is uncertain due to the insufficient evidence to account for measurement bias.
The index should have a reliable scoring system where correlations between constructs should be evaluated to ensure that weightage of each construct reflects their significance to the overall diet assessed. The scoring range also affects the suitability of DQI for assessment at group and individual level. For individual assessment, a small scale may be sufficient to assess the diet quality and determine if nutritional intervention is needed. However, in group settings where a greater variation is expected or ranking of individuals required, DQI with small range and dispersion of scales may not be informative for research purposes as they are unlikely to capture the extreme inherent characteristics of the dietary pattern(Reference Arvaniti and Panagiotakos60).
Evidence of indices’ validation should be adequate to support their use in the intended context and their validation framework should ideally be free of potential bias(Reference Wirt and Collins14). TDS, Dietary Guidelines Adherence Index 2015 and Healthy Eating Index-2015 of category 1, Mediterranean-Style Dietary Pattern Score of category 2, AHEI-2010 and DRA of category 3 are suitable for use at the population level(Reference Chiuve, Fung and Rimm8,Reference Jessri, Lou and L’Abbé27,Reference Jilcott, Keyserling and Samuel-Hodge28,Reference Reedy, Lerman and Krebs-Smith36,Reference Rumawas, Dwyer and McKeown38,Reference Russell, Flood and Sadeghpour39) . MEDAS score is suitable for use at the individual level(Reference Schröder, Fitó and Estruch41). Despite these indices being assessed to be more robust than the others based on this review, researchers need to acknowledge their limitations and interpret the results with caution.
Strengths of this review are that it provided a detailed summary of the most recently published and updated DQI and provided an assessment of risk of bias and quality of the tools using the COSMIN framework. While the tools have been curated for use in Australian contexts, the DQI could potentially be used in other contexts, especially those in category 2 and 3 that were not based on country-specific dietary guidelines. In addition, findings from evaluating the validation processes provide generalisable factors to be considered in selection of DQI for different contexts beyond those included in this study. The study was limited by the fact that COSMIN tool for risk of bias assessment of PROMs was not a perfect fit to assess DQI. DQI are unlike classic PROMs where each subscale or component can be evaluated individually as required by COSMIN. Subsequently, the strength of the validation results (e.g. high or low intraclass correlation coefficient, extent of correlations) could not be assessed as the criteria were unsuitable for multidimensional instruments like DQI. However, the COSMIN tool was the most fitting tool that could be identified in the absence of better frameworks. The current study’s search only included indices with demonstrated validation processes published from 2010 to 2020. Therefore, some DQI published after the previous 2009 review may not have been identified. Despite this, we manually identified and included DQI published before 2009 if their validation process was published after 2009.
To conclude, existing DQI need further validation for measurement error, reliability and reproducibility. When selecting a DQI, researchers should consider the validation evidence and suitability of the tool for their research aims to increase the robustness of research findings in nutritional epidemiology and dietary intervention studies.
Acknowledgements
The authors wish to acknowledge the Queensland University of Technology for their support of this research.
This research received no specific grant from any funding agency, commercial or not-for-profit sectors.
Each author participated in the conceptualisation of the project. M. S. T. and H. C. C. completed the search, data extraction, quality assessment, risk of bias assessment and review processes. M. S. T. and H. C. C. led the data synthesis and wrote the drafts of the manuscript that was reviewed by L. J. R. and H. L. M. All authors are in agreement with the final manuscript being submitted and declare that the content of the manuscript has not been published elsewhere.
The authors declare that they have no conflicts of interest.
Supplementary material
For supplementary material referred to in this article, please visit https://doi.org/10.1017/S0007114521004943


