


Introduction
Recent observations demonstrate that Arctic sea ice is decreasing (Reference Parkinson and CavalieriParkinson and Cavalieri, 2008), particularly in summer and early autumn (ACIA, 2004). Overall Antarctic sea ice is increasing on a much smaller scale than Arctic decreases, although this increase includes individual regions in which sea ice is decreasing (Reference Cavalieri and ParkinsonCavalieri and Parkinson, 2008; Reference TurnerTurner and others, 2009a).
Knowledge of changes in past and prediction of future Antarctic sea-ice extent (SIE) is imperative. the annual growth and retreat of Antarctic sea ice imparts changes on both regional and global scales and on short and long timescales. Changes in sea ice affect deep ocean water formation and circulation (Reference Stössel, Yang and KimStössel and others, 2002), albedo (Reference Curry, Schramm and EbertCurry and others, 1995), primary production and phytoplankton blooms (Reference Arrigo and vaArrigo and Van Dijken, 2004) and global climate variability through association with El Niño Southern Oscillation (ENSO), sea surface temperature (SST) and global surface temperature (Reference Yuan and MartinsonYuan and Martinson, 2000).
Conversely, atmospheric circulation patterns influence sea-ice variability directly. Reference Simmonds and JackaSimmonds and Jacka (1995) found a correlation between SIE and the Southern Oscillation Index (SOI). SOI, an index based on sea-level pressures (SLPs) measured at Tahiti and Darwin, is correlated to SIE in the southwestern Indian Ocean (35–65˚ E), southwestern Pacific Ocean (155–175˚ E), southeastern Pacific Ocean (225–255˚ E) and west of the Ross Sea (125–165˚ E). Reference CarletonCarleton (1989) examined SIE changes and the large-scale atmospheric circulation patterns of the SOI and SLP in the Ross and Weddell Seas. Based on the 10 year dataset used in that study, SIE changes lagged the SOI but led SLP changes. Linkages between SOI and SIE anomalies were found using a 17 year dataset covering the period 1982–98 (Reference Kwok and ComisoKwok and Comiso, 2002). the strongest connections found in this study were in the Ross–Amundsen Seas and the Bellingshausen–Weddell Seas, although the correlations between these regions were opposite in sign. ENSO and the Antarctic Oscillation (AAO), a representation of the strength of the polar vortex, were found to be related to SIE changes (Reference Liu, Curry and MartinsonLiu and others, 2004) such that positive phases of the AAO led to more ice in the Ross–Amundsen sector but less ice in the Bellingshausen–Weddell sector. Reference TurnerTurner and others (2009b) found a positive trend in SIE in the Ross Sea related to stronger cyclonic circulation associated with changes in the thermal gradient induced by stratospheric ozone depletion.
Sea ice is commonly quantified by determining extent away from the continent (SIE), length of time present (duration), concentration, or amount of open water. All approaches are more accurate and extensive since the implementation of routine satellite observations in 1978. Prior to 1978, extent and concentration data are based on shipboard observations, whaling records, marine sediment cores, ice-core proxies and sporadic satellite remote sensing (1973–78). Published snow and ice-core sea-ice proxy data are fairly limited, and, with a few exceptions, results are generally based on the use of one chemical species measured on samples collected from a single ice-core site.
The primary chemical species used for sea-ice reconstruction are sodium, non-sea-salt sulfate and methanesulfonic acid, all of which are routinely measured using ion chromatography (Reference Legrand and MayewskiLegrand and Mayewski, 1997). Sodium in Antarctic ice is almost exclusively representative of sea-salt inputs and is preserved and measured in ice cores as Na+. Sulfate is also supplied from sea salts but the larger contribution is from non-marine sources such as atmospheric transport of volcanic and biogenic sulfate, crustal emissions and, in Antarctica, a small amount of anthropogenic inputs from industrial emissions and agricultural processes. Non-sea-salt sulfate (nssSO4 2–) is commonly calculated using Na+ as a conservative tracer in the ocean (Reference PilsonPilson, 1998). Methanesulfonic acid (MSA) has only one source in Antarctica, notably marine phytoplankton processes and subsequent oxidation of resultant dimethylsulfide (DMS) in the atmosphere. Specific processes that produce DMS include degassing from melting sea ice (Reference Gabric, Shephard, Knight, Jones and TrevenaGabric and others, 2005; Reference Trevena and JonesTrevena and Jones, 2006; Reference Jones, Fortescue, Williams and WrightJones and others, 2009) and phytoplankton blooms (Reference DiTullioDiTullio and others, 2000). MSA is preserved and measured in ice cores as methylsulfonate (MS–).
Previous work on SIE–chemistry correlations typically has been based on single snow pits or ice cores and a single chemical species. Antarctic sites investigated include coastal (Reference Welch, Mayewski and WhitlowWelch and others, 1993; Reference Curran, Morgan, Phillips and PalmerCurran and others, 2003; Reference Rhodes, Bertler, Baker, Sneed, Oerter and ArrigoRhodes and others, 2009), near-coastal (Reference Sun, Ren and QinSun and others, 2002; Reference Foster, Curran, Smith and MorganFoster and others, 2006) and inland (Reference PetitPetit and others, 1999; Reference Meyerson, Mayewski, Kreutz, Meeker, Whitlow and TwicklerMeyerson and others, 2002; Reference WolffWolff and others, 2006). Alternatively, a few studies used more varied approaches to develop sea-ice proxies. Reference Pasteur, Mulvaney, Peel, Saltzman and WhungPasteur and others (1995) used the biogenic sulfur compounds nssSO4 2– and MS– on a single coastal core. These two species were also measured on a coastal snow pit (Reference Severi, Becagli, Morganti, Traversi and UdistiSeveri and others, 2009). A record using two different types of core (the Dome C (Antarctica) ice core and an Indian Ocean sector marine core) and two different proxies (chemistry and diatom assemblages, respectively) yielded an SIE record for the Indian Ocean region (Reference Röthlisberger, Crosta, Abram, Armand and WolffRöthlisberger and others, 2010). Another alternative to single-core–single-species proxy development combined chemistry data for one proxy measured on multiple cores to determine regional sea-ice correlations (Reference Abram, Mulvaney, Wolff and MudelseeAbram and others, 2007). Reference Kaspari, Dixon, Sneed and HandleyKaspari and others (2005) compared one species to SIE on a suite of 16 ice cores. Reference DixonDixon and others (2005) were the first to examine SIE correlations using two chemical species on multiple ice cores. Some details of the previous studies follow.
Sodium
Na+ is delivered to Antarctica primarily in winter/spring although the exact source of the sea salt is debated. There are two primary contenders.
-
1. Increased wind speed and strength in winter/spring of features such as the Amundsen Sea low enhance sea-salt aerosol transport to Antarctica (Reference Kreutz, Mayewski, Pittalwala, Meeker, Twickler and WhitlowKreutz and others, 2000; Reference Kaspari, Dixon, Sneed and HandleyKaspari and others, 2005). Sea-salt concentrations in the Siple Dome ice core are associated with changes in surface pressure (r = 0.32, >95% confidence) in the region of the Amundsen Sea low (Reference Kreutz, Mayewski, Pittalwala, Meeker, Twickler and WhitlowKreutz and others, 2000). Additionally, changes in cyclonic activity correlate with accumulation rates in the Pine Island–Thwaites drainage region, West Antarctica (Reference KaspariKaspari and others, 2004). Ice-core accumulation rates correlate (r = 0.345) with changes in surface pressure. Strong surface pressure and Na associations exist throughout a large portion of West Antarctica. Reference Kaspari, Dixon, Sneed and HandleyKaspari and others (2005) determined positive correlations between Na measured in central West Antarctic ice-core sites and specific marine regions. Two ice cores correlated with the SIE (r = 0.35) in the Bellingshausen and east Amundsen Seas and a third site correlated with SIE in the west Amundsen and Ross Seas region (r > 0.35).
-
2. Formation of new sea ice in winter yields increased Na+ concentrations (Reference Rankin, Wolff and MartinRankin and others, 2002). the latter association is based on the presence of frost flowers: fragile, briny crystals that form on new sea-ice surface. These crystals preferentially precipitate sodium sulfate (as mirabilite, Na2SO4 · 10H2O), resulting in aerosols depleted in SO4 2–. Both processes result in a positive correlation between Na+ and SIE, but may be distinguished by the Na+ to SO4 + ratio.
To investigate the frost flower as an Na+ source, Reference Rankin, Wolff and MartinRankin and others (2002) analyzed data from an ice core collected from Dolleman Island on the east coast of the Antarctic Peninsula. the Na+ to SO4 + ratio indicated that most of the Na+ was found in the fractionated, or winter, portion of the year.
Na+ has been invoked as a proxy for sea ice in several deep ice-core studies. Reference Wolff, Rankin and RWolff and others (2003) suggested that increased sea-ice production was the source of Na+ to the Antarctic plateau. Applying this to the most recent 45 000 years of the much longer Dome C ice-core record yielded an association with SIE in the Indian Ocean sector (Reference WolffWolff and others, 2006). As a possible test, Reference Sun, Ren and QinSun and others (2002) measured Na+ from a core collected north of the Lambert Glacier basin, East Antarctica. That site has no correlation with annual SIE in either the Indian Ocean region or with the annual mean sea-ice area around the entire continent over the 60 year record of the core.
Recently, a longer section of the Dome C record was compared with a marine sediment core (Reference Röthlisberger, Crosta, Abram, Armand and WolffRöthlisberger and others, 2010). the marine core was collected in the Indian Ocean sector and the records compared over the past 240 000 years. Diatom assemblages in the marine core were related to seasonal changes in sea ice during full glacial conditions, and the ice-core Na+ was related to sea-ice changes during the interglacial and early glacial periods. In both Dome C investigations the associations are qualitative since Dome C Na+ and SIE were not calibrated using modern Na+ and satellite-based SIE records.
A positive correlation is found in the Vostok (East Antarctica) core (Reference PetitPetit and others, 1999) between Na+ and sea-ice volume. Sea-ice volume in this 420 000 year long record was reconstructed using sea-water δ18O. Polar ice is depleted in δ18O as a consequence of fractionation during transport. During glacial periods, increased ice (both glacial and sea ice) drive sea-water δ18O higher. Thus, determination of the δ18O time series from marine biogenic material leads to a proxy for ice volume. A positive association (increased Na+ with increased ice volume) is suggested from this study for the four glacial periods represented.
NSS-Sulfate
The dominant source of nssSO4 2– is the oxidation of DMS produced by marine phytoplankton in summer (Reference MinikinMinikin and others, 1998). This process supplies ~40% of the nssSO4 2– to the Southern Hemisphere (Reference Gondwe, Krol, Gieskes, Klaassen and d. BaarGondwe and others, 2003). Other sources include non-DMS biological activity, distant anthropogenic processes and infrequent volcanic eruptions. In Antarctica, volcanic events are identifiable by a relatively large increase in background concentrations of sulfate.
A core collected from Dolleman Island showed an anticorrelation at the 95% confidence level (r = –0.29, n = 88) between nssSO4 2– and sea-ice duration in the Weddell Sea (Reference Pasteur, Mulvaney, Peel, Saltzman and WhungPasteur and others, 1995). This work suggests that for the period 1900–92 increased (decreased) sea-ice duration was correlated with decreased (increased) nssSO4 2– concentration. the 200 year record of Reference DixonDixon and others (2005) also suggested increased nssSO4 2– with decreased SIE at several sites in West Antarctica (r≥0.414–0.514, 18≤n ≥24, >95% confidence). In Reference DixonDixon and others’ (2005) study, the Weddell Sea exhibits the greatest number of correlations (18) with the greatest number of ice-core sites (10). However, as with Reference Kaspari, Dixon, Sneed and HandleyKaspari and others (2005), this multi-chemistry multi-core approach revealed more complex associations between chemistry, core site and SIE region. Factors affecting transport and deposition of chemical species include site elevation and distance from the source, atmospheric circulation changes and conditions at the source.
Methylsulfonate
MS– is the species used most extensively as a proxy for sea ice. the only source of MS– to the atmosphere is the oxidation of DMS, and DMS is produced by phytoplankton (Reference Saigne and LegrandSaigne and Legrand, 1987). Although the exact branching ratio of MS from DMS is not well understood, it is still a valuable indicator of marine productivity. Increased marine productivity associated with sea-ice retreat has been measured by remote sensing in areas of the Ross and Weddell Seas (Reference Moore and AbbottMoore and Abbott, 2000).
Reference Welch, Mayewski and WhitlowWelch and others (1993) showed a positive correlation at the 99% confidence level between annual mean MS– and annual mean sea-ice area in both the Ross Sea region (r = 0.802, n = 18) and the entire Southern Ocean (r = 0.768, n = 18) using snow-pit samples from the coastal Newall Glacier covering the period 1971–90. Using a South Pole MS– ice-core record, Reference Meyerson, Mayewski, Kreutz, Meeker, Whitlow and TwicklerMeyerson and others (2002) reported positive correlations (r = 0.55, n = 20) with SIE anomalies in the Amundsen–Ross Seas area. Less (more) MS– was noted to indicate less (more) sea ice in a core from Law Dome, East Antarctica, over the 22 years (1973–94) that overlapped the sea-ice record (r = 0.48, p < 0.002, n = 22) (Reference Curran, Morgan, Phillips and PalmerCurran and others, 2003). A 10m firn core from Wilhelm II Land, north of Law Dome (Reference Foster, Curran, Smith and MorganFoster and others, 2006), also yielded a positive correlation with SIE over the period 1984–98 for the region 60–120˚ (r = 0.51, p < 0.05, n = 15). Normalized and stacked MS– data from three cores collected from around the Weddell Sea region showed a positive correlation with maximum SIE (r = 0.66, n = 18, 95% confidence) in the Amundsen–Bellingshausen region, but a strong negative correlation (r = –0.76, 99% confidence) with Weddell Sea maximum SIE (Reference Abram, Mulvaney, Wolff and MudelseeAbram and others, 2007). Records used were Dolleman Island (Reference Pasteur, Mulvaney, Peel, Saltzman and WhungPasteur and others, 1995), Berkner Island (Reference Mulvaney, Pasteur, Peel, Saltzman and WhungMulvaney and others, 1992) and Dronning Maud Land covering the years 1973–90.
The Dolleman Island study by Reference Pasteur, Mulvaney, Peel, Saltzman and WhungPasteur and others (1995) utilized MS– as well as nssSO4 2– data and revealed an anticorrelation (r = –0.23, n = 88, 95% confidence) with sea-ice duration. an East Antarctic core from Lambert Glacier (Reference Sun, Ren and QinSun and others, 2002) also showed an anticorrelation between MS– and SIE in the Indian Ocean region (r = –0.34, n = 25, 95% confidence) for the period 1973–92. Recently, Reference Rhodes, Bertler, Baker, Sneed, Oerter and ArrigoRhodes and others (2009) measured MS– in a snow pit (1999–2005) from Mount Erebus Saddle in the Ross Sea region and found a positive correlation with open-water extent (r = 0.903, p < 0.5, n = 6) inferred as a negative correlation with sea ice.
Methods
During the 2008 International Trans-Antarctic Scientific Expedition (ITASE)/Scientific Committee on Antarctic Research (SCAR) workshop in Castine, ME, USA, it was decided that the ice-core community needed a more thorough examination of available data for sea-ice reconstructions. Here we present a starting platform to develop a matrix of multi-core multi-parameter SIE correlations to better understand patterns and trends, or lack thereof, in the preceding studies. the resulting matrix will provide spatial and temporal data to aid in the understanding of transport mechanisms, biological processes, influence of core site conditions and effects of sea-ice extents. We examine SIE correlations using the maximum and mean annual concentrations of three chemical species (Na+, nssSO4 2– and MS–) on a suite of Antarctic ice cores. We selected six ice cores of which two have not been reported previously (Fig. 1; Table 1). These cores are sampled continuously, well dated, resolved sub-annually (6–12 samples per year) and represent a wide range of geographic locations. Cores from West Antarctica (01-4, 02-1 and 02-4) and East Antarctica (03-1) were collected in 2001–02, 2002–03 and 2003–04 during the US ITASE field seasons. the South Pole record used here comes from Reference Meyerson, Mayewski, Kreutz, Meeker, Whitlow and TwicklerMeyerson and others (2002) developed from a core collected in 1995. South Pole core data from 1979 to 1992 were stacked with results of another South Pole core collected in 2000 (Reference Budner, Cole-Dai, Robock and OppenheimerBudner and Cole-Dai, 2003) to extend the record, and, in addition, were compared with another South Pole record (personal communication from E. Korotkikh, 2010). the Siple Dome ice core was collected in 1994 (Reference Mayewski, Twickler and WhitlowMayewski and others, 1995).

Fig. 1. Site map of ice cores used in this study. Longitudes of major SIE regions: IO, 20–90˚; WP, 90–160˚; RS, 160–230˚; AB, 230–290˚; AP, 290–300˚; WS, 300–360˚. Map created using Moderate resolution Imaging Spectroradiometer (MODIS) Mosaic of Antarctica (T. Haran and others, http://nsidc.org/data/nsidc-0280.html).
Table 1. Site information of ice cores used in this study

An example of the dating technique used is presented in Figure 2. the majority of the cores used in this study were annually dated using seasonal peaks in major ions and calibrated to known volcanic eruptions (Reference Dixon, Mayewski, Kaspari, Sneed and HandleyDixon and others, 2004, Reference Dixon2005). the SO4
2– from the Pinatubo (Philippines) and Cerro Hudson (Chile) volcanic eruptions can be seen in the 02-4 glaciochemical time-series plot (Fig. 2). Both events occurred in 1991, causing the background concentration of SO4
2– to rise followed by a peak in SO4
2– in 1993. the 01-4, 02-1 and Siple Dome cores contain very clear seasonal ![]() peaks due to their proximity to the coast and their relatively high accumulation rates. the 02-4 and South Pole cores, being located further inland and with correspondingly lower accumulation rates, do not exhibit these clear annual
peaks due to their proximity to the coast and their relatively high accumulation rates. the 02-4 and South Pole cores, being located further inland and with correspondingly lower accumulation rates, do not exhibit these clear annual ![]() peaks. However, clear annual layers can be distinguished at these two sites by examining
peaks. However, clear annual layers can be distinguished at these two sites by examining ![]() (winter) and
(winter) and ![]() (summer) ratios. the 03-1 core was dated using volcanic depth/age horizons in combination with a firn compaction model.
(summer) ratios. the 03-1 core was dated using volcanic depth/age horizons in combination with a firn compaction model.

Fig. 2. Raw major-ion and MS data time series in core 02-4. Increase in background concentrations of sulfate following the 1991 Pinatubo and Hudson eruptions can be seen. Na/SO4 ratios indicate winter, SO4/Na peak in summer. H/D ratios (not shown) also used for dating (Reference SteigSteig and others, 2005).
Annual maximum and mean concentrations of Na+, ![]() and MS– were calculated for each core and compared with SIE over the period 1979 (onset of continuous satellite SIE data) to the top of each core used in this study (Table 1). Annual minimum chemistry concentrations were not utilized since these are often below detection limits for cores from the Antarctic interior.
and MS– were calculated for each core and compared with SIE over the period 1979 (onset of continuous satellite SIE data) to the top of each core used in this study (Table 1). Annual minimum chemistry concentrations were not utilized since these are often below detection limits for cores from the Antarctic interior.
SIE records are from the Australian Antarctic Data Centre (http://data.aad.gov.au) based on satellite-derived observations (http://nsidc.org/data/nsidc-0051.html) from 1979 to the present. Measurements were made on a daily basis (365 samples per year). For our study, values of chemistry concentrations and SIE are calculated over the years from 1979 to the top of the core. We use annual maximum, mean and minimum SIE in degrees latitude for each 10˚ sector to compare to the chemical species.
Linear correlations are used to examine the relationship between maximum and mean Na+, ![]() and MS– concentrations and annual maximum, mean and minimum SIE for each of the 36 10˚ sea-ice sectors. This routine is applied to the six chemical species for maximum, mean and minimum SIE on all six cores. Correlation results, presented in Figure 3, meet three criteria: (1) the confidence interval is >90%; (2) correlations occur in at least two sectors that are no more than one 10˚ sector apart; (3) these correlations have the same sign. Application of these criteria results in assemblages of two or more adjacent sectors (20˚ or more) that contain significant SIE correlations related to an ice-core site. Confidence intervals for each core are given in Table 2. Positive (negative) correlations indicate that increased (decreased) chemistry concentration is associated with increased (decreased) SIE.
and MS– concentrations and annual maximum, mean and minimum SIE for each of the 36 10˚ sea-ice sectors. This routine is applied to the six chemical species for maximum, mean and minimum SIE on all six cores. Correlation results, presented in Figure 3, meet three criteria: (1) the confidence interval is >90%; (2) correlations occur in at least two sectors that are no more than one 10˚ sector apart; (3) these correlations have the same sign. Application of these criteria results in assemblages of two or more adjacent sectors (20˚ or more) that contain significant SIE correlations related to an ice-core site. Confidence intervals for each core are given in Table 2. Positive (negative) correlations indicate that increased (decreased) chemistry concentration is associated with increased (decreased) SIE.

Fig. 3a and b. Linear correlations between maximum, mean and minimum SIE and annual maximum and mean (a) sodium (blue), (b) non-sea-salt sulfate (red) and (c) methylsulfonate (green) for six spatially distributed Antarctic cores. Correlations were calculated for 36 10˚ sectors around the continent. All plotted values are at or above the 90% confidence interval, and 80% of the assemblages contain a correlation at or above the 95% confidence interval. Only correlations of the same sign in two or more sectors separated by only one sector (10˚) are retained. Latitudinal placement of correlation symbol within a sector has no significance. Heavy longitudinal lines group sectors into regions: Indian Ocean (20–90˚), Western Pacific (90–160˚), Ross Sea (160–230˚), Amundsen–Bellingshausen (230–290˚), Antarctic Peninsula (290–300˚) and Weddell Sea (300–20˚).
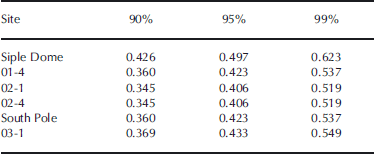
Table 2. Pearson’s confidence intervals at 90%, 95% and 99% for cores in this study
Major SIE regions used in this study (Fig. 1) follow divisions developed by Reference Zwally, Comiso, Parkinson, Cavalieri and GloersenZwally and others (2002) as follows: Indian Ocean (IO, 20–90˚), Western Pacific Ocean (WP, 90– 160˚), Ross Sea (RS, 160–230˚), Amundsen–Bellingshausen Seas (AB, 230–290˚), Weddell Sea (WS, 300–20˚), plus the Antarctic Peninsula (AP, 290–300˚; not defined in Reference Zwally, Comiso, Parkinson, Cavalieri and GloersenZwally and others, 2002).
Discussion
Na+ and SIE
Maximum Na+ and maximum SIE (Fig. 3a, part 1) reveal the greatest number of correlations (21) developed from the Na+ and SIE examination. All SIE sector assemblages contain at least one 10˚ SIE sector at or greater than 95% confidence interval. Sectors with these correlations are evenly distributed around the continent, and all major sea-ice regions correlate with one or more sites. Signs of the correlations cluster such that all correlations are negative from 60˚ to 190˚ and positive from 210˚ to 50˚.
South Pole and 02-4 do not display a maximum-Na+– maximum-SIE correlation (Fig. 3a, part 1) although 02-4 does have mean-Na+–maximum-SIE correlations with the AP–WS region (Fig. 3a, part 2). There is no significant correlation with SIE and mean Na+ at the South Pole (Fig. 3a, parts 3 and 4) as found by Reference DixonDixon and others (2005) using Na+-derived ![]() SIE correlations. the South Pole exception is particularly interesting because Na+ exhibits a strong seasonal maximum during winter (Reference Cunningham and ZollerCunningham and Zoller, 1981; Reference Whitlow, Mayewski and DibbWhitlow and others, 1992). It is likely that the winter polar vortex centered over Antarctica creates a barrier that isolates the interior from coastal atmospheric influences (Reference Wang, Hadjinicolaou, Carver, Shallcross and HallWang and others, 2005), thus removing coastal sea ice as a directly linked source of Na+ to the South Pole in winter. Rather the Na+ may arrive at the South Pole after considerable mixing from multiple transport sites, making it less well correlated to any particular set of sites.
SIE correlations. the South Pole exception is particularly interesting because Na+ exhibits a strong seasonal maximum during winter (Reference Cunningham and ZollerCunningham and Zoller, 1981; Reference Whitlow, Mayewski and DibbWhitlow and others, 1992). It is likely that the winter polar vortex centered over Antarctica creates a barrier that isolates the interior from coastal atmospheric influences (Reference Wang, Hadjinicolaou, Carver, Shallcross and HallWang and others, 2005), thus removing coastal sea ice as a directly linked source of Na+ to the South Pole in winter. Rather the Na+ may arrive at the South Pole after considerable mixing from multiple transport sites, making it less well correlated to any particular set of sites.
The IO region contains two separate assemblages of sectors that correlate with Siple Dome Na+, but each with the opposite sign. Maximum Na+ correlates positively with maximum SIE from 20˚ to 50˚, but negatively from 60˚ to 90˚ (Fig. 3a, part 1). the inverse correlation referred to above is due to the anticorrelation of the SIE data in these regions. When SIE increases (decreases) in the 20–50˚ sector, it decreases (increases) in the 60–90˚ area (http://nsidc.org/data/nsidc-0051.html).
Siple Dome correlations in the IO subsectors 30–40˚ and 70–80˚ noted above are at the 99% confidence interval (r = 0.81 and –0.61, respectively) and the former is the most significant correlation found in this study (Fig. 3, part 1). A negative correlation at >99% confidence is found for site 02-1 with the 160–170˚ SIE sector (r = –0.52) (Fig. 3a, part 1).
Maximum and mean nssSO4 2– and minimum SIE correlations (Fig. 3b, parts 5 and 6) are the most numerous in this study (27 and 26, respectively). All core sites reveal these correlations, and all major regions correlate with at least one ice-core site. In general, maximum nssSO4 2– correlations in the RS, AB and AP regions are negative and those in the WS, IO and WP are positive. All but four of the correlations are on the western side of the continent. Mean nssSO4 2– and minimum SIE positive correlations extend into the western RS and are distributed around the continent similar to maximum nssSO4 2–.
Unlike Na+ and MS– that are correlated primarily with only one SIE state (maximum, mean or minimum), nssSO4 2– has significant correlations with both minimum and mean SIE. Mean nssSO4 2– and mean SIE (Fig. 3b, part 4) are correlated at all core sites except Siple Dome. of the 25 correlations, 13 are clustered in the western RS region. This western RS group contains all core sites except 01-4 (and Siple Dome), and all correlations in this region are negative except 02-1. Correlations in WS, WP and WP/RS are all positive.
The Siple Dome and South Pole core site results obtained by Reference DixonDixon and others (2005) for annual mean nssSO4 2– and annual mean SIE correlations are somewhat different from those in this study. There are three differences between the studies. First, and possibly most important, we extended the South Pole record from 1992 to 2000 by stacking data. Second, our sea-ice data start in 1978 rather than 1973, to include only the combined scanning multichannel microwave radiometer and Special Sensor Microwave/Imager (SMMR/SSM/I) satellite data (Reference ParkinsonParkinson, 2004). Third, there are different approaches to determining annual mean concentrations.
The greatest number of sectors with correlations at or greater than 99% confidence of all the chemistry–SIE states measured in this study is that of the maximum-nssSO4 2–– minimum-SIE association (seven; Fig. 3b, part 5). Also, the greatest number of core sites with correlations >99% is that of the maximum-nssSO4 2––minimum-SIE association (six; Fig. 3b, part 5). the mean-nssSO4 2––minimum-SIE association contains the second highest number of sectors at or greater than 99% confidence (five; Fig. 3b, part 6).
MS– and SIE
Mean MS– and mean SIE (Fig. 3c, part 4) have the greatest number of correlations (23) using this proxy. All core sites have significant correlations and all major SIE regions correlate with one or more sites with the exception of AB. Distribution of the correlations is heavily weighted to the western half of the continent, with only 4 of the 23 correlations between 180˚ and 360˚. Only four correlations are in the RS region. the precursor of biogenic MS–, DMS, is released during spring sea-ice break-up (Reference Trevena and JonesTrevena and Jones, 2006), during polynya formation (Reference DiTullio and GarrisonDiTullio and Garrison, 1995). the RS polynya is the largest and most productive in Antarctica (Reference Arrigo and vaArrigo and van Dijken, 2004) and the region is the most productive in the Southern Ocean (Arrigo and others, 1998). It is surprising, therefore, that there is not a stronger correlation for MS– in the RS for the six core sites in this study. MS––SIE correlations studied previously in the RS region were the two most significant reported. Reference Welch, Mayewski and WhitlowWelch and others (1993) reported an MS––SIE correlation coefficient equal to 0.802 for Newall Glacier and the RS. Reference Rhodes, Bertler, Baker, Sneed, Oerter and ArrigoRhodes and others (2009) reported a Mount Erebus Saddle to RS coefficient of 0.902.
The mean-MS––mean-SIE correlations in the WP region are very similar to the mean nssSO4 2– and mean SIE results in the same region. Core sites 01-4, 02-4, South Pole and 03-1 contain mean-MS––SIE correlations (Fig. 3c, part 4), and all but 03-1 contain mean-nssSO4 2––mean-SIE correlations (Fig. 3b, part 4).
The distribution of the direction of the correlations is extremely varied for mean MS– and mean SIE (Fig. 3c, part 4). Correlations of Na+ and nssSO4 2– to SIE within specific regions are in the same direction at all ice-core sites, suggesting a strong source influence. MS––SIE correlation signs are distributed more randomly, suggesting a weaker source influence and perhaps stronger site condition influences. Certainly, MS– is known to migrate after deposition (Reference Mulvaney, Pasteur, Peel, Saltzman and WhungMulvaney and others, 1992; Reference Wagnon, Delmas and LegrandWagnon and others, 1999; Reference Delmas, Wagnon, Kamiyama and WatanabeDelmas and others, 2003) and accumulation rates affect this migration directly (Reference CurranCurran and others, 2002; Reference Weller, Traufetter, Oerter, Peel and MillerWeller and others, 2004).
The WP and RS regions contain the most mean-MS–– mean-SIE correlations above 95% (Fig. 3c, part 4). Core 01-4 contains the only correlations at or greater than 99% confidence in the RS region (r = 0.62 and r = 0.54, n = 22).
Discussion
Processes that lead to the aforementioned correlation patterns occur on temporal scales, spatial scales, are reflective of the source strength and are influenced by site conditions. In this paper, we provide the framework for further investigation and offer some preliminary interpretations.
On a temporal scale, seasonality can be inferred from correlations between chemical species and ice extents. Specifically, maximum SIE occurs in winter/early spring and is most strongly correlated with maximum ice-core Na+. This is consistent with other studies but does not address the question of whether the source of the Na+ is sea salt aerosols or frost flowers.
Minimum SIE is representative of summer conditions and is most highly correlated with nssSO4 2–. However, nssSO4 2– is also highly correlated with mean SIE, which does not necessarily have a seasonal association because, by definition, mean is the average of all ice extents. A possible explanation for the two SIE–nssSO4 2– correlations may be significant input of nssSO4 2– during both spring (ice breakup and retreat produces DMS) and summer (increased productivity) seasons.
Spatial distribution of the correlations may be a function of atmospheric circulation patterns. For example, regardless of the source of Na+, greater wind speeds in winter/spring may result in the even distribution of Na+ and maximal SIE correlations around the continent. However, maximum- and mean-nssSO4 2––minimum-SIE correlations are heavily weighted to the western half of the Antarctic seas, and mean-MS–mean-SIE correlations are weighted to the east. These uneven distributions may be due to reduced wind speeds in spring and summer, when these species peak in concentration, and their resultant shorter transport pathways.
The scarcity of significant correlations between MS– and SIE recorded at these six sites in the highly productive Ross Sea region is unexpected. This lack of association points to the need to use an array of ice-core sites and multiple proxies to better capture all geographic regions. the ice-core MS– array chosen for this study does not reflect conditions in the RS, probably because atmospheric transport of MS– to these sites from the RS is confounded in some way.
Distribution of the sign of the correlations may provide information about the relative importance of source strength and site characteristics. Na+ and nssSO4 2– SIE correlations of the same sign are often hghly clustered Generally, correlations between Na+ and maximum SIE are positive in the AB/ AP regions. With the exception of one sector adjacent to the AP, nssSO4 2– correlations with mean and minimum SIE are always positive in the WS region and always negative in the sectors bridging the RS/AB regions. Intense clustering may suggest strong source influences and/or strong atmospheric transport pathways with less influence by site conditions. MS– (mean) SIE correlations are less organized by sign, suggesting that local site conditions might dominate over source strength and/or atmospheric transport efficiency.
Future work will include incorporation of SIE correlations from additional cores around Antarctica. Using this framework of SIE correlations in combination with established atmospheric transport pathways, we will work toward a 360˚ proxy-reconstruction of Antarctic sea ice prior to the instrumental period.
Acknowledgements
This research was supported by the US National Science Foundation (NSF) Office of Polar Programs grants to P.M. (0096305, 0096299, 0439589, 063740, 063650 and 0837883). We thank the US Antarctic Program of the NSF, the 109th New York Air National Guard, Raytheon Polar Services Company and our US ITASE field colleagues for their support. Comments and suggestions by the scientific editor, J.-L. Tison, and two anonymous reviewers significantly improved the manuscript.


