


In the last decades, the prevalence of excess body weight (EBW: overweight and obesity) in children and adolescents has rapidly increased worldwide(1). Specifically in Latin America, children and adolescents are disproportionally affected by the obesity epidemic(1,Reference Ng, Fleming and Robinson2) . In 2013, the highest prevalence of EBW was observed in Chile (37 %), Uruguay (31·2 %) and Mexico (28·4 %) among boys, and in Costa Rica (37·7 %), Uruguay (37·7 %) and Chile (31·6 %) among girls(Reference Ng, Fleming and Robinson2). In Brazil, the prevalence of EBW was 22·1 % in boys and 24·3 % in girls in 2013(Reference Ng, Fleming and Robinson2). In comparison, in the USA, the prevalence of EBW among children and adolescents was 28·8 % in boys and 29·7 % in girls(Reference Ng, Fleming and Robinson2).
Notably, there are differences in the prevalence of obesity according to several factors, such as socio-economic status and race/ethnicity(1). In 2014, the prevalence of EBW in USA among white youth aged 2–19 years was 27·5 % for girls and 31·4 % for boys, while the prevalence among Hispanics was 42·4 % for girls and 41·3 % for boys(Reference Skinner, Perrin and Skelton3). Additionally, the prevalence of obesity among high socio-economic status adolescents has recently decreased, whereas it has continued to increase among their low-socio-economic status peers(Reference Frederick, Snellman and Putnam4).
The high prevalence of paediatric obesity, especially in low-income and racial/ethnic groups, is a public health issue because adolescents with EBW are more susceptible to several health problems, including dyslipidaemia, hypertension, insulin resistance and metabolic syndrome as well as CVD(1,Reference Reilly and Kelly5) . As a consequence, besides the individual health effects, EBW also causes a significant increase in direct and indirect health expenditures, becoming a problem for the economy and the health systems(Reference Withrow and Alter6).
Adolescence is an especially important critical period regarding nutritional status because of the high-energy and nutrient demand needed for physical growth and development, the changes in lifestyle and habits that affect food consumption, the likelihood of establishing lifelong dietary habits and the direct influence of dietary intake in adolescence on adulthood cardiometabolic health and obesity(Reference Mikkila, Rasanen and Raitakari7,Reference Dahm, Chomistek and Jakobsen8) . Despite the importance of diet quality in this life stage, studies indicate the marked presence of inadequate dietary intake in this population, such as high consumption of foods with high energy density and low nutritional value, and low consumption of fruits and vegetables, characterising a low diet quality, rich in fat, sugar, cholesterol and low in fibre and some vitamins and minerals such as Ca, phosphorus, and vitamins A, D and C(Reference de Moura Souza, Bezerra and dos Santos Barbosa9–Reference Levy, Castro and Cardoso11).
As diet may be differently associated with health outcomes in diverse populations(Reference Marshall, Burrows and Collins12,Reference Guenther, Kirkpatrick and Reedy13) , identifying differences and similarities in diet quality and its association with EBW and cardiometabolic risk factors in adolescents living in Brazil and in the USA – two countries with documented high prevalence of EBW – may contribute to advancing the current knowledge about these relations, especially because this has not been well established in adolescents(Reference Marshall, Burrows and Collins12,Reference Funtikova, Navarro and Bawaked14) . Some studies suggest that healthy food consumption patterns during adolescence may prevent accumulation of cardiometabolic risk, but further validation in diverse populations should be done(Reference Moore, Singer and Bradlee15).
In this context, we aimed to compare diet quality and its association with EBW, central adiposity (CA) and CVD risk factors (CVDR) among Brazilian adolescents living in São Paulo, Brazil and Hispanic/Latino adolescents living in the USA.
Methods
Study design and population
This research compared data from two studies: the Health Survey of São Paulo (Inquérito de Saúde de São Paulo) with Focus in Nutrition Study (ISA-Nutrition) and the Hispanic Community Children’s Health Study/Study of Latino Youth (SOL-Youth).
The ISA-Nutrition is a sub-sample of the Health Survey of São Paulo (ISA-Capital), a cross-sectional, population-based study with a probabilistic sample of individuals aged 12 years and older living in households in the urban area of the city of São Paulo(Reference Alves, Escuder and Goldbaum16). The study aimed to evaluate the health status and the use of health services of São Paulo population. In ISA-Capital, the collection of information on socio-economic and demographic data, self-reported morbidity, use of medications and nutritional supplements, health services, as well as lifestyle (eating habits, physical activity, sleep, smoking and alcohol consumption) was carried out in the households, using a structured questionnaire applied by trained interviewers throughout the year of 2015 in 4024 individuals, of which 859 were adolescents (aged 12–19 years). In ISA-Nutrition, anthropometric data, blood pressure measurements and blood samples were collected in a subsample of the ISA-Capital population (adolescents n 290) during a second visit to the participant’s home. Dietary intake was assessed by two 24-h dietary recalls (24HR). The first 24HR was collected in the households and the second one by telephone. Details of the study and its sampling design are published elsewhere(Reference Fisberg, Sales and Fontanelli17).
The population source for SOL-Youth is a population-based sample of children living in Hispanic/Latino households whose adult members were enrolled in the Hispanic Community Health Study/Study of Latinos (HCHS/SOL)(Reference Sorlie, Aviles-Santa and Wassertheil-Smoller18), a population-based cohort study of 16 415 Latino adults from four US cities (Chicago, IL; Miami, FL; Bronx, NY; San Diego, CA). Children aged 8–16 years living with at least one parent or legal guardian who participated in HCHS/SOL were invited to participate in SOL-Youth. Data collection occurred between 2012 and 2014 in a total of 1466 youths. SOL-Youth aimed to investigate the influence of family, cultural and psychosocial factors on youth’s behaviours and cardiometabolic risk profiles. The collection of socio-economic and demographic data and clinic examination were obtained during an in-person visit to one of the field centres, and the second 24HR was completed on the telephone. Details of the study and its sampling design are published elsewhere(Reference Isasi, Carnethon and Ayala19).
For comparison between studies, data from both cohorts were restricted to individuals aged 12–16 years old, with complete dietary, anthropometric and sociodemographic information. Also, those with extreme values of energy intake (<1st and >99th sex-specific percentile for each 24HR) were excluded(Reference Mattei, Sotres-Alvarez and Daviglus20). The final sample for this analysis was 189 adolescents for ISA-Nutrition and 787 adolescents for SOL-Youth. A flow chart describing the selection of the sample for the present study is described in see online supplementary material, Supplemental Fig. 1.
Excess body weight and cardiometabolic risk factors
EBW was defined as having overweight or obesity, according to the sex- and age-specific World Obesity Federation cut-offs for BMI (kg/m2), which are internationally-based, since the reference population was obtained by averaging across a heterogeneous mix of surveys from different countries, including USA and Brazil(Reference Cole, Bellizzi and Flegal21). CA was defined as waist circumference >90th percentile, specific for sex and age. CVDR was categorised as having three or more of the following conditions: obesity(Reference Cole, Bellizzi and Flegal21), elevated systolic or diastolic blood pressure (≥90th percentile for sex, age and height)(22), dyslipidaemia (total cholesterol ≥ 200 mg/dl, or LDL-cholesterol ≥ 130 mg/dl, or HDL-cholesterol ≤ 40 mg/dl, or TAG ≥ 150 mg/dl)(23), high fasting plasma glucose (≥100 mg/dl) or HbA1c (≥5·7 mg/dl), or insulin resistance (HOMA_IR ≥ 2·5)(24).
Protocols for laboratory and anthropometric measurements performed in both studies are published elsewhere(Reference Fisberg, Sales and Fontanelli17,Reference Isasi, Carnethon and Ayala19) . The Homoeostatic Assessment of Insulin Resistance was defined as: fasting glucose (mg/dl) × fasting insulin (μU/l)/405(Reference Matthews, Hosker and Rudenski25).
Dietary information
In both studies, dietary intake was assessed by two 24HR, collected by trained interviewers, representing all days of the week, and season of the year, using the procedures of the Multiple Pass Method(Reference Moshfegh, Rhodes and Baer26). Food consumption data were entered in the Nutrition Data System for Research software (version 2014), developed by the Nutrition Coordinating Center, University of Minnesota, Minneapolis, MN, USA, which uses the food composition table developed by the United States Department of Agriculture as main data source.
The NCI method, which accounts for within- and between-person variance components and corrects for the high intra-individual variation intrinsic to 24HR, was used to estimate the usual intake of each analysed nutrient and food group(Reference Tooze, Kipnis and Buckman27).
Diet quality was defined using the Alternate Healthy Eating Index-2010 (AHEI)(Reference Chiuve, Fung and Rimm28) and the Revised Brazilian Healthy Eating Index (BHEI-R)(Reference Previdelli, Andrade and Pires29). The BHEI-R includes twelve components: nine food groups (total fruit, whole fruit, total vegetables, dark green and orange vegetables and legumes, total grains, whole grains, milk and dairy products, meats, eggs and legumes, oils), two nutrients (saturated fat, Na) and a component related to the consumption of total energies from solid fat, alcohol and added sugar. The ten AHEI components were: six food groups (vegetables, fruit, whole grains, sugar-sweetened beverages, nuts and legumes, and red and processed meats) and four nutrients (trans fat, n-3 fats, PUFA, and Na). The original AHEI-2010 also included the component alcohol, which was excluded from the present analysis, since the consumption of alcohol is not appropriate for this age group. For both indices, the maximum score is 100, which indicates the highest diet quality. The components of each healthy eating index are listed in see online supplementary material, Supplemental Table 1.
Statistical analysis
Categorical variables were described as percentages and 95 % CI, and differences in categorical variables between individuals with and without EBW were evaluated using Rao–Scott Chi-Square tests. Usual intake of total energy intake and several nutrients as well as the components and total score for BHEI-R and AHEI were described as means and 95 % CI; the variables were compared by EBW status using regression analysis adjusted for total energy intake (except for energy and energy density), sex and age.
Adjusted OR and 95 % CI for EBW, CA and CVDR according to each diet quality index were tested using logistic regression models, adjusting for confounders. The models for 2015 ISA-Nutrition were adjusted for age, sex and income. For HCHS/SOL-Youth, they were adjusted for age, sex, income and Hispanic/Latino ethnic background. For both populations, AHEI models were also adjusted for total energy intake, but not BHEI as it is estimated for 4184 kJ (1000 kcal). All analyses used appropriate sampling weight and complex survey procedures, performed in SAS, version 9.3. A P < 0·05 was considered for statistical significance.
Results
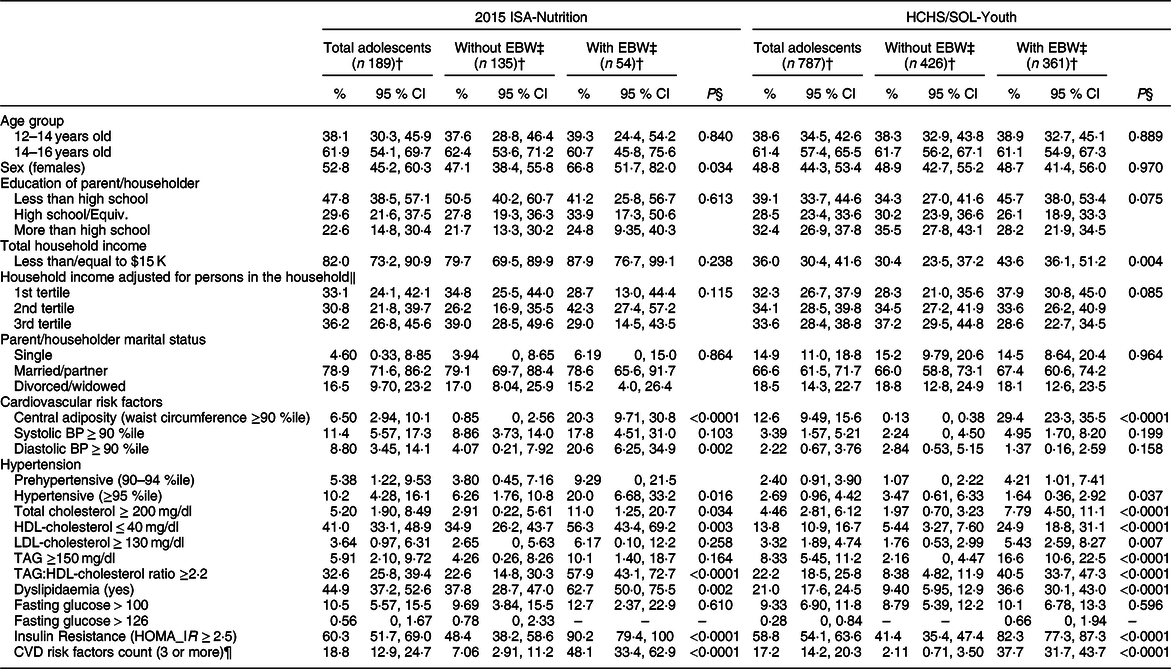
Prevalence of EBW was 28·7 % (95 % CI 21·7, 35·7 %) in ISA-Nutrition and 42·5 % (95 % CI 37·5, 47·5 %) in SOL-Youth, CA was 6·5 % (95 % CI 2·9, 10·1 %) in ISA-Nutrition and 12·6 % (95 % CI 9·5, 15·6 %) in SOL-Youth, and CVDR was 18·8 % (95 % CI 12·9, 24·7 %) in ISA-Nutrition and 17·2 % (95 % CI 14·2, 20·3 %) in SOL-Youth. Females had more EBW compared with males in ISA-Nutrition, while those with lower total household income had higher EBW in SOL-Youth (Table 1). The ethnic background of the individuals evaluated in SOL-Youth included Mexican/Mexican American (48·2 %), Dominican (13·2 %), Mixed Hispanic (11·2 %), Puerto Rican (9·7 %), Cuban (6·6 %), Central American (5·7 %), South American (4·0 %) and other (1·5 %).
Table 1 Characteristics of adolescents in Health Survey of São Paulo (ISA-Nutrition) and in the Hispanic Community Health Study/Study of Latinos Youth (HCHS/SOL-Youth) studies according to excess body weight (EBW) status*
BP, blood pressure; HOMA_IR, Homoeostatic Assessment of Insulin Resistance.
* All the analyses take into account the sampling design of each survey.
† The numbers presented are absolute frequency. The percentages and 95 % CI are weighted according to the sampling design of each survey. Overall P-values shown across categories from Rao–Scott Chi-Square tests.
‡ Body weight status was defined according to the sex- and age-specific World Obesity Federation cut-offs for BMI (kg/m2)(Reference Cole, Bellizzi and Flegal21), with excess body weight: overweight and obesity.
§ Variables compared using Rao–Scott Chi-Square tests.
‖ Values are per year. For 2015 ISA-Nutrition, the medians for each tertile were US$791, US$1798 and US$3525 and for HCHS/SOL-Youth, they were US$2500, US$4583 and US$9000, respectively. In Brazil, R$1 = US$3·3366 in 2015.
¶ CVD risk factors were categorised as having three or more of the following conditions: obesity(Reference Cole, Bellizzi and Flegal21), high systolic or diastolic blood pressure (≥90th percentile for sex, age and height)(22), dyslipidaemia (total cholesterol ≥ 200 mg/dl, or LDL-cholesterol ≥ 130 mg/dl, or HDL-cholesterol ≤ 40 mg/dl, or TAG ≥ 150 mg/dl)(23), high fasting plasma glucose (≥100 mg/dl) or HbA1c (≥5·7 mg/dl), or insulin resistance (HOMA_IR ≥ 2·5)(24).
Comparing the differences between both surveys through the lack of overlap of the 95 % CI, ISA-Nutrition presented higher prevalence of adolescents with lower household income, and with parents or householders married or with partner, compared with SOL-Youth. They also presented higher prevalence of high systolic blood pressure, low HDL-cholesterol, high TAG:HDL-cholesterol ratio and dyslipidaemia, than adolescents from SOL-Youth.
In both studies, those with EBW (v. without EBW) had more cardiovascular risk factors, CA, hypertension, high total cholesterol, low HDL-cholesterol, high TAG:HDL-cholesterol ratio, dyslipidaemia, insulin resistance and CVDR. Differences by EBW status were observed for high TAG in SOL-Youth and for high diastolic blood pressure in ISA-Nutrition.
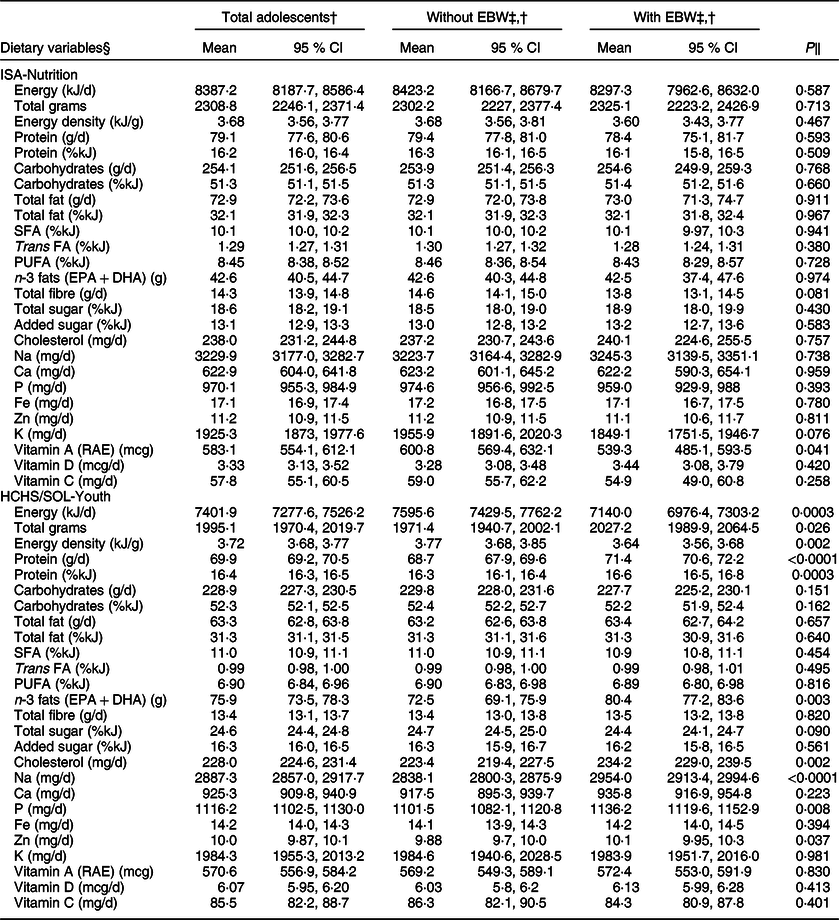
There were no differences in mean intake by EBW status in ISA-Nutrition except for lower vitamin A intake in adolescents with EBW compared with without EBW (Table 2). In SOL-Youth, those with EBW had lower energy and energy density intake and higher total grams of food and beverages, n-3 fats, cholesterol, Na, phosphorus and Zn than those without EBW. Several differences in dietary intake were observed between surveys: adolescents from ISA-Nutrition consumed more energy, total grams, protein (g/d), carbohydrates (g/d), total fat (g/d and % kJ), trans and PUFA, total fibre, Na, Fe and Zn than those from SOL-Youth study, who consumed more carbohydrates (% kJ), SFA and n-3 fatty acids, total and added sugars, Ca, phosphorus, and vitamins D and C.
Table 2 Dietary variables of adolescents in Health Survey of São Paulo (ISA-Nutrition) and in the Hispanic Community Health Study/Study of Latinos Youth (HCHS/SOL-Youth) studies according to excess body weight (EBW) status*
* All the analyses take into account the sampling design of each survey. Sample size = 189 in 2015 ISA-Nutrition (n 135 without EBW, n 54 with EBW). Sample size = 787 in HCHS/SOL-Youth (n 426 without EBW, n 361 with EBW).
† The numbers presented are absolute frequency. The percentages and 95 % CI are weighted according to the sampling design of each survey.
‡ Body weight status was defined according to the sex- and age-specific World Obesity Federation cut-offs for BMI (kg/m2)(Reference Cole, Bellizzi and Flegal21); with excess body weight: overweight and obesity.
§ Usual intake of each dietary variable was estimated using the NCI method (adjusted by sex, age, centre, weekend, self-report intake amount – more, same or less than usual amount – and sequence – first or second 24HR).
‖ P-values comparing least squares means (LS-means) of fixed effects for the usual intake of each nutrient, adjusted for total energy intake (except for energy and energy density), sex and age.
Comparing the diet quality indices components of both populations, using the BHEI-R, adolescents from SOL-Youth presented higher (healthier) scores for total and whole fruits, milk and dairy, and whole grains than ISA-Nutrition, and adolescents from ISA-Nutrition presented higher scores for total vegetables, dark-green and orange vegetables and legumes, saturated fat, Na, and total energies from solid fat and added sugar than SOL-Youth (Fig. 1). The scores for total grains, meats and oils were close to the maximum and very similar for both populations. Using the AHEI, adolescents from SOL-Youth presented higher scores than ISA-Nutrition for vegetables, whole fruits, whole grains, trans and n-3 fats, while adolescents from ISA-Nutrition presented higher scores for nuts and legumes, red and processed meats, and PUFA than SOL-Youth. Both populations presented very low (unhealthier) scores for the component sugar-sweetened beverages and fruit juice and similar scores for Na.
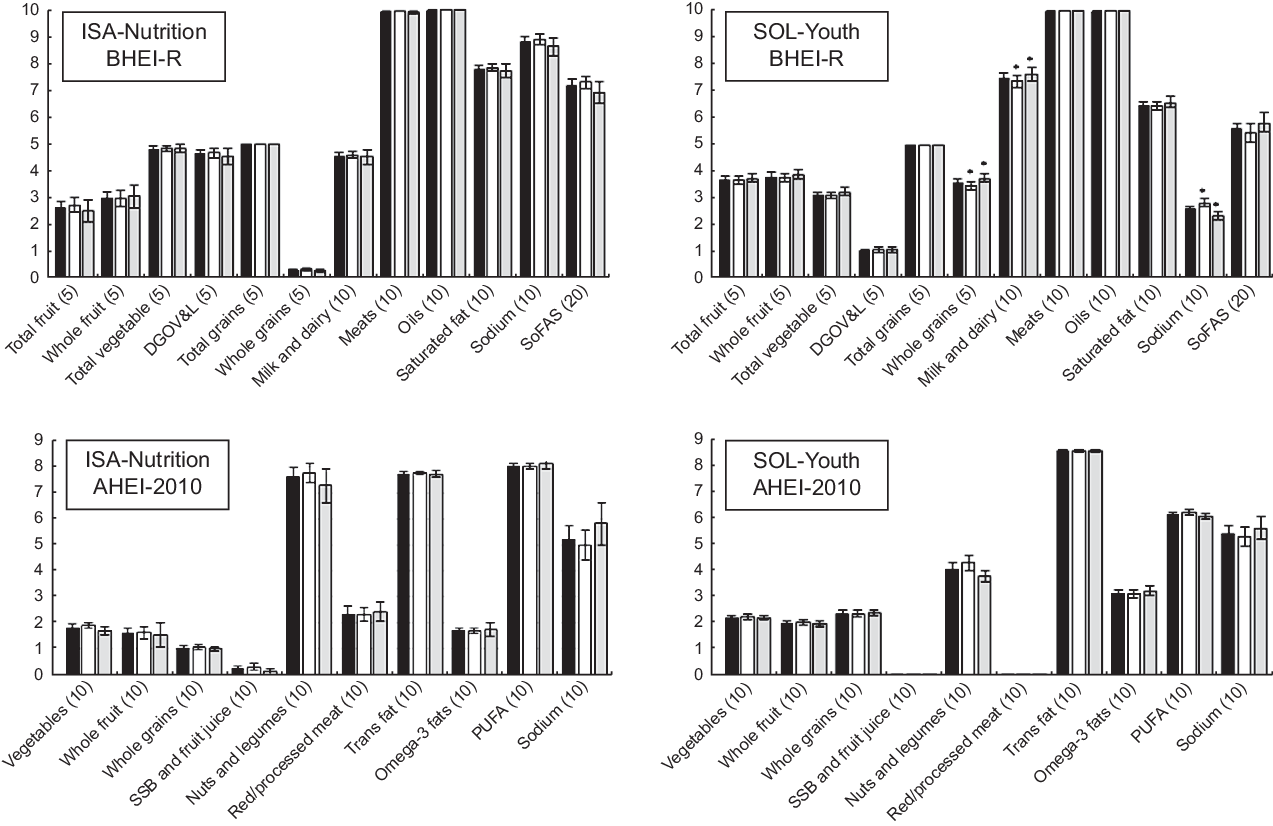
Fig. 1 Comparison of means of components and Revised Brazilian Healthy Eating Index (BHEI-R) and Alternate Healthy Eating Index-2010 (AHEI) scores of adolescents from ISA-Nutrition and Hispanic Community Health Study/Study of Latinos Youth (HCHS/SOL-Youth), according to excess body weight status. EBW, excess body weight; SSB, sugar-sweetened beverages; DGOV&L, dark-green and orange vegetables and legumes; meats, meats, eggs and legumes; oils, vegetable oils, seed oils and oily fish; SoFAS, total energies from solid fat and added sugar. The maximum score for each component is provided in parenthesis. ![]() Total Adolescents;
Total Adolescents; ![]() Without EBW;
Without EBW; ![]() With EBW
With EBW
The total scores of both diet quality indices were higher for ISA-Nutrition than for SOL-Youth: 68·8 (68·1, 69·4) in ISA-Nutrition v. 62·5 (61·8, 62·3) in SOL-Youth for BHEI-R, and 37·5 (36·8, 38·2) in ISA-Nutrition v. 34·0 (33·6, 34·5) in SOL-Youth for AHEI-2010. Similar differences were noted when stratifying by EBW status. Compared with ISA-Nutrition, SOL-Youth with EBW had lower scores of nuts and legumes (AHEI), and Na using BHEI-R, but higher scores of whole grains and dairy using BHEI-R (Fig. 1; see online supplementary material, Supplemental Table 1).
In ISA-Nutrition, BHEI-R score was inversely associated with EBW (OR: 0·87; 95 % CI 0·80, 0·95; P = 0·003) and CVDR (OR: 0·89; 95 % CI 0·80, 0·98; P = 0·022) (Fig. 2; Supplemental Table 2). In SOL-Youth, AHEI was inversely associated with EBW (0·93; 95 % CI 0·87, 0·99; P = 0·041). No other significant associations for the cardiometabolic outcomes were noted for either diet quality index in the studied populations.
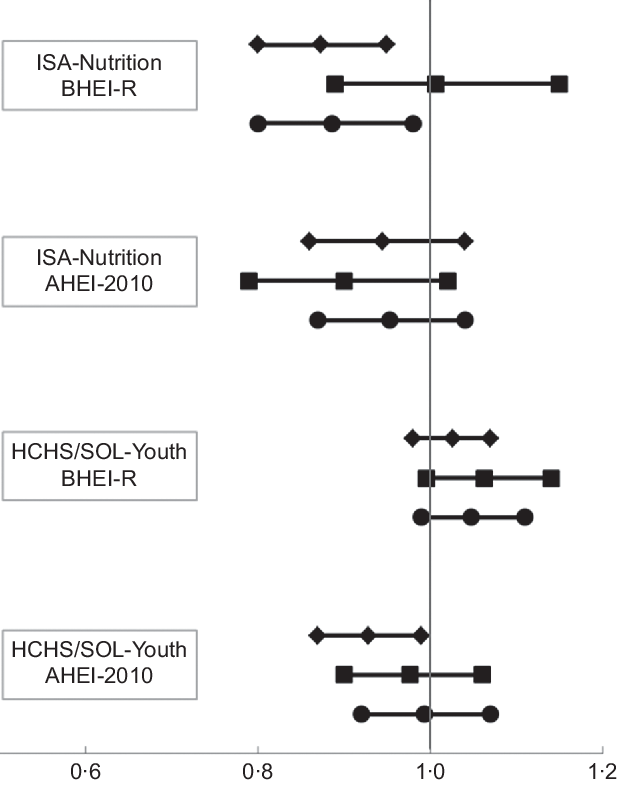
Fig. 2 OR (95 % CI) of the presence of excess body weight (EBW), central adiposity (CA) and cardiovascular risk factors (CVDR) for a 1-unit increment of Brazilian (BHEI-R) and Alternate (AHEI) Healthy Eating Indices in adolescents from the ISA-Nutrition and the Hispanic Community Health Study/Study of Latinos Youth (HCHS/SOL-Youth). The logistic regression models for ISA-Nutrition were adjusted for age, gender and income. For HCHS/SOL-Youth, they were adjusted for gender, age, income and Hispanic background. For both populations, they were also adjusted for total energy intake in the AHEI models, but not for BHEI-R, since it is estimated for 4184 kJ (1000 kcal).![]() EBW;
EBW; ![]() CA;
CA; ![]() CVDR
CVDR
Discussion
Diet quality assessed using the BHEI-R was inversely associated with EBW and CVDR in Brazilian adolescents living in São Paulo, and diet quality assessed using the AHEI was inversely associated with EBW among Hispanic/Latino adolescents living in the USA. With small improvements in diet quality according to diet quality indices applicable to each population, Brazilian adolescents could lower the odds of EBW by 13 % and the odds of CVDR by 11 % with each additional unit increase in BHEI-R, while Hispanic/Latino adolescents in the USA could lower the odds of EBW by 7 % with each additional unit increase in AHEI.
Despite differences in nutrient intake observed across both surveys, few variations were observed between those with and without EBW in each population. This observation suggests that single nutrients may not be enough to detect differences according to EBW status, and, in this context, an overall diet quality index better distinguishes these associations(Reference Marshall, Burrows and Collins12,Reference Mattei, Sotres-Alvarez and Daviglus20,Reference Schap, Kuczynski and Hiza30) . Still, the components of the diet quality indices themselves presented few differences between adolescents with and without EBW, and only for ISA-Nutrition population, the total BHEI-R was marginally higher for those without v. with EBW. However, after adjusting for confounding variables, BHEI-R was inversely associated with EBW in ISA-Nutrition and AHEI was inversely associated with EBW in SOL-Youth. This evidence reinforces the importance of using indices relevant to each specific population. Frequently, indices developed for a population (e.g. HEI or AHEI in the USA) have been applied to other populations without adapting it to the scoring algorithm, but despite being considered culturally neutral due to the use of food groups and nutrients(Reference Schap, Kuczynski and Hiza30), slight differences in dietary habits may be important and may reduce the strength of the association between diet quality measured with other non-population-specific indices and disease outcomes. Preferably, previous indices could be used as templates for a local diet quality index, adapted to each country scenario, and validated for each population(Reference Guenther, Kirkpatrick and Reedy31).
Other studies have shown health benefits by consuming an overall high diet quality (measured using various definitions)(Reference Schwingshackl, Bogensberger and Hoffmann32,Reference Sotos-Prieto, Bhupathiraju and Mattei33) . In youth, despite the importance of a high diet quality, the evidence linking a priori dietary patterns with metabolic markers is sparse. A systematic review investigating these associations in paediatric populations showed that weight status was the most commonly assessed health-related measure, with most of the studies being conducted in developed countries(Reference Marshall, Burrows and Collins12). However, the evidence was inconsistent, with studies finding both negative and positive associations, which may be the result of differences in study design, adjustment for confounding factors, or wide variation in scoring methodology. Nevertheless, results from prior investigations support that a high-quality diet in adolescence and young and middle adulthood is important for the maintenance of cardiovascular health and prevention of CVD later in life(Reference Dahm, Chomistek and Jakobsen8,Reference Steffen, Van and Daviglus34) .
Findings from 16 220 children aged 2–9 years from study centres in eight European countries suggest that a Mediterranean diet score was inversely associated with EBW, but not clearly associated with fat distribution itself(Reference Tognon, Hebestreit and Lanfer35). In the study, the cross-sectional association between waist circumference and the score was non-significant when the analyses were adjusted for parental income and education. Likewise, in the present study, CA was not associated with either AHEI or BHEI-R for either population. This observation could suggest the influence of factors other than diet quality in how body fat deposits in this age group, such as sex hormones(Reference Bjorntorp, Ottosson and Rebuffe-Scrive36), ethnic background(Reference Huang, Johnson and Figueroa-Colon37), gut microbiota(Reference Boulangé, Neves and Chilloux38) and in utero and early childhood environment(Reference França, Rolfe and Horta39).
In the present study, CVDR was inversely associated with diet quality in ISA-Nutrition, but not in SOL-Youth population. In parallel, while a study on a nationally representative sample of US adolescents observed lower prevalence of metabolic syndrome with higher overall diet quality, measured using the Healthy Eating Index 2005(Reference Pan and Pratt40), another study showed an inverse association between Dietary Approaches to Stop Hypertension score with systolic blood pressure among 11–13 and 14–18-year-olds, but did not detect significant associations between Dietary Approaches to Stop Hypertension-style diet and weight status, waist circumference or diastolic blood pressure(Reference Cohen, Lehnerd and Houser41). On the other hand, another study in youth aged 6–18 years from Tehran found an inverse relationship between adherence to Dietary Approaches to Stop Hypertension score and metabolic syndrome and incidence of hypertension, high fasting plasma glucose and abdominal obesity(Reference Asghari, Yuzbashian and Mirmiran42). This evidence illustrates diversity in the association between diet quality and metabolic outcomes in youth across populations. Despite the observed variations, in both ISA-Nutrition and SOL-Youth, those with EBW presented more CVDR than those without EBW, in accordance with the broad evidence showing this association(Reference Koliaki, Liatis and Kokkinos43).
Studies suggest that diet quality seems to be important even in adolescents who are already classified with obesity. In a nationally representative US sample, metabolically healthy obese adolescents had better dietary compliance to the US guidelines when compared with metabolically abnormal obese, with higher total HEI-2005 score, higher milk scores and higher scores from energies from solid fats, alcohol beverages and added sugars(Reference Camhi, Evans and Hayman44). Also, in a Turkish study with 164 children (aged 9–13 years) with overweight or obesity, there was a negative correlation between diet quality and body mass, waist circumference and body fat mass(Reference Öztürk, Bozbulut and Döğer45).
Evaluating the components of the diet quality indices allowed us to compare the diet of ISA-Nutrition and SOL-Youth populations and the AHEI and BHEI-R scores. For example, the score of SOL-Youth on whole grains using both scores was higher than that in ISA-Nutrition. This difference may have occurred from higher acculturation of this population to USA diet(Reference Arandia, Sotres-Alvarez and Siega-Riz46) that have a higher intake of whole grains among adolescents, from ready-to-eat cereals, yeast breads/rolls, and crackers and salty grain snacks(Reference McGill and Devareddy47). These foods are not very popular in the Brazilian adolescent diet(Reference Pereira, de Castro and Hopkins48). On the other hand, beans are frequently consumed, play an important role in their diet and represent the food group with the highest total fibre contribution in Brazil(Reference Levy, Castro and Cardoso11,Reference dos Santos, Sales and Vieira49) , which is reflected in the higher score in ISA-Nutrition population compared with SOL-Youth for nuts and legumes using AHEI, and for the components total vegetables and dark-green and orange vegetables and legumes using BHEI-R. The difference in the total vegetables score (higher in SOL-Youth using AHEI and higher in ISA-Nutrition using BHEI-R) may be due to the high intake of beans among the Brazilians. While the AHEI included only vegetables, the scoring for BHEI-R followed the method from HEI-2005(Reference Guenther, Reedy and Krebs-Smith50), in which the score for the component ‘Meat and Beans’ was estimated initially as the sum of the energetic value of the ‘Meat and Eggs’ group, to which the energetic value of ‘Legumes’ was added until the maximum score for the ‘Meat and Beans’ component was met (794·96 kJ = 1 portion = 10 points). Any excess energy from legumes was, therefore, added simultaneously to the ‘Dark Green and Orange Vegetables’ and ‘Total Vegetables’ groups(Reference Previdelli, Andrade and Pires29). This was the main difference observed in the overlapping components between the scores. The other components were consistent, such as the higher score for whole fruits and for whole grains in SOL-Youth using both scores.
Another example of difference across both populations is the higher score of milk and dairy using BHEI-R for SOL-Youth adolescents. It has been reported that the average intake of milk in Brazil is 54·5 g (53 ml)(Reference Possa, Castro and Sichieri51), whereas it is 266 ml/d (274 g) in the Central Latin America region(Reference Singh, Micha and Khatibzadeh52). The high intake of milk and dairy could have been a traditional dietary habit maintained by the Hispanic/Latino population residing in the USA. Besides cultural differences, other possible explanation for the observed contrasts may be factors related to food choices (such as access, taste, nutrition knowledge, cost, convenience), health perceptions, marketing and social modelling(Reference Leng, Adan and Belot53). Since differences in culture and food environment between populations may influence food choices and, consequently, affect dietary aspects involved in the aetiology of EBW and cardiometabolic risk factors(1), future research should deeply investigate these aspects.
Despite the contrasts, there are also similarities that should be highlighted, such as the very low score of both populations for sugar-sweetened beverages and fruit juices, indicating a high intake of these beverages, as observed in previous studies with adolescents(Reference Singh, Micha and Khatibzadeh52). Sugar-sweetened beverages and fruit juice have a high sugar and energy content and have been consistently related to obesity and weight gain(Reference Luger, Lafontan and Bes-Rastrollo54). These beverages represent a key component for interventions intending to improve diet quality in adolescents of diverse populations.
Even with the observed differences and similarities of components, significant discrepancies exist between the overall diet quality and the recommendations for both studied populations. In spite of adolescence been a critical period regarding nutritional status, this life stage is market by poor diet quality in several populations. In the USA, for example, >80 % of adolescents were classified as having a poor diet(Reference Shay, Ning and Daniels55). In diverse studies, adolescents presented the poorest diet quality in comparison with both older(Reference Hiza, Hazel and Casavale56,Reference Mello, Sarti and Pereira57) and younger(Reference Banfield, Liu and Davis58,Reference Golley, Hendrie and McNaughton59) age groups. Nonetheless, Brazilian adolescents presented better diet quality than Hispanics/Latinos living in the USA using both scores. Even though Brazilian adolescents had less EBW than Hispanic/Latino adolescents from the USA, they had higher prevalence of high systolic blood pressure and dyslipidaemia. These differences may be result of several factors such as differences in lifestyle aspects that were not evaluated in this study, such as physical activity, sedentary behaviour, access to health services, psychosocial factors, in utero environment, media and marketing exposure, and the physical environment(1,Reference Greydanus, Agana and Kamboj60) , besides individual genetic variations or variations between ethnic backgrounds that may produce different interplays between genes and dietary patterns, resulting different phenotypes(Reference Frazier-Wood61).
A limitation of this study is that, we did not account for individual ethnic differences that may occur in diet intake and diet–disease associations in the SOL-Youth cohort due to sample size limitation(Reference Mattei, Sotres-Alvarez and Daviglus20). The results may reflect those from the predominant Mexican heritage group (48 %), despite adjusting the models for ethnic background. The study with the adult Hispanic/Latino population from HCHS/SOL (n 12 406) observed that the AHEI and its components differed by ethnic background, with mean values ranging from 43·0 for Puerto Ricans to 52·6 for Mexicans(Reference Mattei, Sotres-Alvarez and Daviglus20). Also, AHEI was inversely associated with waist circumference, blood pressure and glucose among Mexicans and Puerto Ricans and with TAG among Mexicans only, and positively associated with HDL-cholesterol among Puerto Ricans and Central Americans(Reference Mattei, Sotres-Alvarez and Daviglus20).
Another limitation is that the diet quality scores applied in the analysis were not developed specifically for adolescents. However, the basic food groups used in both scores are considered culturally neutral, which accounts for individual preferences within food groups, and are considered appropriate for this age group(Reference Schap, Kuczynski and Hiza30). Moreover, moderate alcohol intake, consistently associated with lower risk of CVD in adults(Reference Dahm, Chomistek and Jakobsen8), was not included in the AHEI score for this population. Future studies investigating diet quality in adolescents could utilise tools developed specifically for this age group, especially if they are supported by validation studies.
There are several strengths of this study. It compares data of adolescents from two large surveys in different settings with high prevalence of EBW. ISA-Nutrition has a sampling design that represents all the adolescent population living in households in the urban area of São Paulo, the biggest city in Brazil and one of the most populous cities in the world, with more than 12 million habitants. SOL-Youth is one of the largest and most comprehensive studies on cardiometabolic health in a diverse sample of Hispanic/Latino youth living in four areas of the USA. Furthermore, both surveys followed an important methodological rigour, with similar quality of data. Both used two 24HR as dietary assessment, providing rich details about foods consumed, as well as culturally neutral data, which allowed the comparison of two culturally different diets. In addition, our analyses assessed both specific nutrients and overall diet quality, using indices applicable to each population(Reference Marshall, Burrows and Collins12,Reference Schap, Kuczynski and Hiza30) .
In conclusion, healthier diet quality was associated with lower odds of EBW in Brazilian and USA-Hispanic/Latino adolescents and with lower CVDR in Brazilian adolescents. Findings from this study suggest that measuring diet quality with indices relevant to each population may better represent the association of their diet quality with obesity and cardiometabolic outcomes in adolescents. Furthermore, we highlight common food groups that should be improved in both groups, such as sugar-sweetened beverages, but also culturally-specific differences that could be targeted to each particular population, such as whole grains in ISA-Nutrition and legumes in SOL-Youth, in order to improve overall diet quality.
Acknowledgements
Acknowledgements: The authors thank the staff and participants of ISA-Nutrition and HCHS/SOL-Youth for their important contributions. Financial support: SOL-Youth was supported by grant R01HL102130 from the National Heart, Lung, and Blood Institute (NHLBI). The children in SOL-Youth are drawn from the study of adults, The Hispanic Community Health Study/Study of Latinos, which is a collaborative study supported by contracts from the National Heart, Lung, and Blood Institute (NHLBI) to the University of North Carolina (HHSN268201300001I/N01-HC-65233), University of Miami (HHSN268201300004I/N01-HC-65234), Albert Einstein College of Medicine (HHSN268201300002I/N01-HC-65235), University of Illinois at Chicago – HHSN268201300003I/N01-HC-65236 Northwestern Univ), and San Diego State University (HHSN268201300005I/N01-HC-65237). The following Institutes/Centers/Offices have contributed to the HCHS/SOL through a transfer of funds to the NHLBI: National Institute on Minority Health and Health Disparities, National Institute on Deafness and Other Communication Disorders, National Institute of Dental and Craniofacial Research, National Institute of Diabetes and Digestive and Kidney Diseases, National Institute of Neurological Disorders and Stroke, NIH Institution-Office of Dietary Supplements. Additional support was provided by the Life Course Methodology Core (LCMC) at Albert Einstein College of Medicine and the New York Regional Center for Diabetes Translation Research (P30 DK111022-8786 and P30 DK111022) through funds from the National Institute of Diabetes and Digestive and Kidney Diseases. The ISA-Nutrition Study was funded by the São Paulo Municipal Health Department (2013–0.235.936–0)/São Paulo Research Foundation – FAPESP (2012/22113–9)/National Council for Scientific and Technological Development – CNPq (472873/2012–1). Additional support was provided by São Paulo Research Foundation – FAPESP (2017/02480–0 to J.L.P.) and a NHLBI Faculty Diversity Mentored Career Development Award (K01-HL120951 to J.M.). The study sponsors did not have any role in study design; collection, analysis, and interpretation of data; writing the report; and the decision to submit the report for publication. The content is solely the responsibility of the authors and does not necessarily represent the official views of the funding agencies. Conflict of interest: None. Authorship: J.L.P., R.M.F. and J.M. designed the research; J.L.P., R.M.F., C.R.I., L.V.H., M.C., M.D., M.J.P., D.S.A. and J.M. contributed to data acquisition; J.L.P. and J.M. analysed data; J.L.P. wrote the first draft of the article. All authors read, revised critically and approved the final manuscript. Ethics of human subject participation: This study was conducted according to the guidelines laid down in the Declaration of Helsinki, and all procedures involving study participants were approved by the Ethics Committee on Research of the Public Health School, University of São Paulo for 2015 ISA-Nutrition, and the institutional review boards at each field centre for SOL-Youth. Written informed consent was obtained from all subjects.
Supplementary material
For supplementary material accompanying this paper visit https://doi.org/10.1017/S1368980020002736


