

12.1 Introduction
Australia is a world leader in mineral resources, with the world’s largest reserves of iron ore and gold, second largest reserves of bauxite and copper and fifth largest reserves of black coal. Australia is a top-five global producer of twenty important commodities, including gold, bauxite, iron ore, rare earths, mineral sands, zinc, lead and coal. In particular, it is the second largest producer of gold and alumina, third largest producer of uranium and zinc and fifth largest producer of nickel in the world. Australia is also the largest exporter of iron ore, metallurgical coal and bauxite (Reference BrittBritt et al., 2017).
These and other resources are a mainstay of the Australian economy. The Australian mining industry was valued at $138.2 billion in 2017–18 (Australian Bureau of Statistics, 2018a), with growth of 2.9 percent ($3.9 billion), in line with the overall growth of the economy (Australian Bureau of Statistics, 2018b). Mining accounted for around 8 per cent of Australia’s gross domestic product (GDP) in the 2017–18 financial year. With around a quarter of a million people employed in the sector, and 72 per cent of Australia’s exports of goods in 2017–18, Australia’s resource and energy exports are likely to hit a new record high of $252 billion in 2018–19 (Australian Government Department of Industry, Innovation and Science, 2018b).
Because Australia is a small open economy, its comparative advantage in minerals and energy exports makes the mining and mining equipment technology services (METS) sector an important driver of broader economic growth.
We estimate that in 2015–16, the mining sector’s total economic [i.e. direct and indirect] contribution to Australia was $236.8 billion, representing around 15% of the Australian economy. This economic activity supported a total of 1,139,768 FTE jobs across Australia, which represents around 10% of total FTE employment.
This chapter builds on our previous patent analytics study of the Australia mining sector, Reference FrancisFrancis (2015), which focused on determining who filed patents and in what technology areas. Francis analyzed mining inventions filed in Australia from 1994–2011, during the development of the Australian ‘mining boom’, finding that the METS sector accounted for the bulk of the mining patents.Footnote 1 Most patent filings in Australia originated from Japan or Germany, and the primary market for Australian patent applicants was the United States of America (USA). With the passing of the Australian mining boom, however, the overall picture of patent activity in the Australian mining industry has altered. Most patent filings in the mining sector in Australia are now originating from the USA, and the primary market for Australian patent applicants is now domestic.
This chapter uses patent data to analyze innovation in the Australian mining sector over the past two decades, with an emphasis on both Australian-led innovation and filings for patent protection in Australia.Footnote 2 The patent data analyzed in this chapter is leveraged from the technology search on mining completed by Reference Daly, Valacchi and RaffoDaly et al. (2019). Finally, the chapter also discusses how government-supported expenditure in research and development (R&D) is linked to inventions in the mining industry and their commercialization.
12.2 Australian Miners
This section of the chapter focuses on Australian innovation in the mining sector by identifying patents that originate from Australia.Footnote 3 This analysis highlights the role of Australian innovation in the global mining industry.
12.2.1 Patenting by Australian Innovators over Time
Analyzing patent filings over time (Figure 12.1) can help to identify innovation trends. Such trend analysis is useful for informing R&D investment decisions and related activities such as collaboration and commercialization. The following section of this chapter, using data from the Australian Government’s R&D Tax Incentive program, investigates R&D investment in the mining industry and compares this to patent filings to give a broader picture of Australian innovation in this sector.

Figure 12.1 Patent families of Australian origin, by priority year, 1997–2015
As a basis for this study, we used the dataset of Reference Daly, Valacchi and RaffoDaly et al. (2019), derived using a modular hierarchical search strategy of International Patent Classification (IPC) and Cooperative Patent Classification (CPC) classification symbols and keywords. The data used in this chapter includes 2,997 unique INPADOC patent families derived from PATSTAT 2017 Autumn Edition and IPGOD 2017 data, with earliest priority dates from 1 January 1997 onwards.Footnote 4
The number of patents filed annually rose from 117 in 1997 to 169 in 2008, an increase of 44 per cent. A further 24 per cent increase from the level of 2008 was observed during 2010–12, averaging around 210 annual filings. This is in line with increased investment in the mining sector during the latest Australian ‘mining boom’ period. Since the mining boom’s peak, patenting activity has sharply declined from 2013, to 134 filings in 2015, comparable to the 1997–2004 period average.
12.2.2 Australia’s Mining Boom
In a Reserve Bank of Australia research paper, Reference Downes, Hanslow and TulipDownes et al. (2014) used historical time series data to review and model Australia’s ‘mining boom’, in which the world price of Australia’s mining exports more than tripled over the 10 years to 2012, and investment spending in the mining sector increased from 2 per cent of GDP to 8 per cent during this period. Iron ore prices rose from about $20 a tonne in 2002 to peak at about $170 a tonne in 2011.
This mining boom had three phases: price rise, investment boom and production boom. The investment boom began as world commodity prices rose, driven largely by a Chinese demand to fuel its infrastructure investment. The boom in mining production lagged a few years until the capacity created by the surge in mining investment became available. While export prices have fallen from their peak in 2012, the volume of Australian mining production has remained high, thus maintaining strong export revenues, although the picture varies by commodity (Australian Government Department of Industry, Innovation and Science, 2018a).
Reference Downes, Hanslow and TulipDownes et al. (2014) portrayed the mining boom as a confluence of events that boosted world minerals prices and mining investment, and in turn the volume of Australian mining output. For example, the development of horizontal drilling and seam fracturing or fracking technology allowed the exploitation of coal seam and shale gas reserves that previously were difficult or impossible to tap. Together with the development of new technological capabilities and resources, a combination of factors in Asian energy markets, particularly concerns over energy security, pollution and greenhouse gas emissions, led to a demand for long-term contracts that allowed commitments to build large-scale projects. The boom can also be explained by less complex factors, such as growth in Chinese steel demands.
12.2.3 Top Australian Innovators
In Australia, a patent provides the owner of an invention an exclusive right for 20 years to commercialize the invention. Inventors file patents to protect their products and processes from imitation without compensation, and so the number of patent families filed by an applicant in a particular technology can be indicative of their interest, strength and market presence, or their desire to build and maintain a market share.
Figure 12.2 identifies the top innovators originating from Australia.Footnote 5 The top three patent filers contributed 15 per cent of total patent filings in the mining sector; about 59 per cent of these were related to metal refining technology.

Figure 12.2 Top Australian patent filers
While the multinationals Rio Tinto and BHP Billiton dominate Australian patent filing through their Australian subsidiaries, Australia’s publicly funded Commonwealth Scientific and Industrial Research Organisation (CSIRO) is the third largest Australian filer.Footnote 6
The relatively large number of patent filings by CSIRO demonstrates the importance of the mining sector in Australian publicly funded research. However, overall, patent filings in the mining sector are driven by corporate entities and individuals. Figure 12.3 shows that 67 per cent of patent filings are directly attributable to companies, in a total of 2,997 patent families filed by Australian innovators.Footnote 7

12.2.4 Technology Specialization by Australian Innovators
So far, we have observed the volume of patents and patent filers over the past two decades. This section explores the different patenting technology areas with a view to understanding areas of strength and competitive advantage for Australian innovators. Patents are assigned a technology category based on the inventions they describe. This allows us to compare activity levels for different categories or subcategories in the technology.
Based on the IPC and/or CPC symbols, Figure 12.4 illustrates the total number of patent families by each broad technology category, while Figure 12.5 shows their movements over time. These broad groups are further subdivided in Table 12.1 and Table 12.2.Footnote 8

Figure 12.4 Patent filings by Australians, by mining technology

Figure 12.5 Patent filings by Australians, by mining technology, by priority year, 1997–2015
| Company | Other | Public Entity | |||
|---|---|---|---|---|---|
| Exploration technology | Exploration | Assays | 15 | 20 | 9 |
| Core extraction | 39 | 32 | 1 | ||
| Drilling | 114 | 101 | 3 | ||
| Drilling tools | 49 | 54 | |||
| Exploration | 83 | 74 | 25 | ||
| Methods or apparatus for drilling | 96 | 91 | 8 | ||
| Surveying and testing | 91 | 80 | 9 | ||
| Surveying and testing: automatic control | 16 | 15 | 7 | ||
| Metal production | Metallurgy | Casting/powder metallurgy | 2 | 2 | |
| Coating | 1 | 1 | |||
| Electrometallurgy | 3 | 3 | |||
| Metallurgy | 2 | 3 | 1 | ||
| Refining | Ferrous | 162 | 156 | 10 | |
| Inorganic chemistry | 19 | 14 | 3 | ||
| Non-ferrous | 425 | 278 | |||
| Mining operation | Blasting | Blasting | 66 | 59 | 5 |
| Fuses | 4 | 3 | |||
| Mining | Excavation | 232 | 242 | 32 | |
| Ground control support | 267 | 220 | 8 | ||
| Other mining categories | 266 | 234 | 47 | ||
| Safety/rescue | 47 | 56 | 8 | ||
| Shafts | 14 | 11 | |||
| Subsea | 30 | 27 | |||
| Tunnels | 47 | 48 | 4 | ||
| Ventilation | 30 | 32 | |||
| Processing | Bio-processing | 1 | 1 | ||
| Crushing/grinding | 14 | 10 | |||
| Crushing/grinding mineral | 18 | 13 | 2 | ||
| Flotation | 48 | 48 | 10 | ||
| Processing | 7 | 4 | 1 | ||
| Separation | 94 | 82 | 6 | ||
Table 12.2 Mining support service patent filings by Australians, by technology and entity type
| Company | Other | Public Entity | |||
|---|---|---|---|---|---|
| Support | Automation | Automation | 2 | 1 | |
| services | Environmental | Biological treatment of soil | 5 | 7 | 2 |
| Environmental | 188 | 148 | 25 | ||
| Reclamation of mining areas | 3 | 4 | |||
| Technologies related to metal processing | 31 | 32 | 5 | ||
| Technologies related to mineral processing | 36 | 43 | 7 | ||
| Treatment of waste water | 7 | 9 | 2 | ||
| Treatment of waste water- metallurgical processes | 45 | 38 | 1 | ||
| Waste disposal | 10 | 12 | 1 | ||
| Transport | Containers | 13 | 18 | 1 | |
| Control | 10 | 11 | 4 | ||
| Conveying | 20 | 30 | 2 | ||
| Hauling | 16 | 14 | |||
| Hoisting | 28 | 29 | |||
| Infrastructure | 11 | 12 | 4 | ||
| Rail | 15 | 16 | 2 | ||
| Shipping | 5 | 5 | |||
| Vehicles | 15 | 17 | |||
Patents within the mining operations category make up 36 percent of total patent filings, with twice as many filings as the metal production category, which is the second largest category overall. Filings over time in the metal production category do not reflect the overall pattern of the whole sector observed in Figure 12.1, of growth to 2010–12 followed by a sharp drop in 2015.
Table 12.1 (mining operation, production and exploration) and Table 12.2 (mining support services) show the number of patent families filed within technology sub-categories by entity type. Corporate entities filed the highest number of patent families in most areas. This was closely matched by numbers of patent families filed by entity type ‘other’, which may be individuals or entities not identified as companies or public entities.
12.2.5 Where Do Australians Seek Patent Protection?
Applicants must file patent applications in each country or patent jurisdiction where they wish to have patent protection. This means that possible target markets for inventions in any technology can be indicated by the jurisdictions in which patent applications are filed.
Figure 12.6 shows the countries where Australian innovators file patent applications in the mining sector. Australian patents are primarily filed in Australia, with 2,571 patents filed since 1997. This represents 77 per cent more patent filings than those filed by Australians in the second largest target market, the USA, which highlights the importance of the domestic market for Australian-origin mining innovation. The relative number of filings into Australia by Australians has increased from the analysis of Reference FrancisFrancis (2015). The USA and Canada represent the second and third largest target markets for Australian innovators, respectively.

Figure 12.6 Jurisdictions in which Australian innovators seek patent protection
Note: The number of patent filings in the top nineteen target jurisdictions are listed in Figure 12.6, all target jurisdictions are shown on the map.European Patent Office (EPO), Eurasian Patent Organisation (EAPO) and African Regional Industrial Property Organization (ARIPO) patents are enforceable in designated contracting states at the date of filing of the application. They are, therefore, included in the target market analysis, and are represented here by non-proportional dots over central Europe, central Asia and central Africa, for indicative purposes only. Patent applications can also be filed directly in individual European, Eurasian or African countries.
12.2.6 Research Collaboration in the Mining Sector
One advantage of analyzing patent data is the ability to identify research partners collaborating on patent applications. The presence of multiple applicants on a patent application may be used as a proxy indicator for collaboration.
Figure 12.7 shows the proportion of patents filed collaboratively by Australians by entity type. Overall, Australians have low levels of collaboration in the mining sector. Publicly funded entities are more likely to collaborate than companies. The proportion of applications filed collaboratively by publicly funded entities (12 per cent) is more than double those filed by companies (5 per cent).

Figure 12.7 Australian patent filing collaboration by entity type
Collaboration between Australians and non-Australians was also analyzed (data not shown); domestic and overseas collaboration was roughly equal. Public entities were somewhat more likely to collaborate internationally than companies. The proportion of collaboration of the publicly funded entities with overseas entities (53 per cent) was slightly more than that of companies (42 per cent).
Figure 12.8 shows the top collaborating Australian applicants for patent filings in the mining sector. Most of the top collaborators are companies, which reflects the dominance of companies in overall patent filings by Australians. In the public sector, Rio Tinto has filed four patents in collaboration with the University of Sydney and one with the University of Manchester, and two patent filings are three-way collaborations between CSIRO, BHP Billiton and the University of Queensland.

12.2.7 Case Study: Cooperative Research Centres
The Australian Government’s Cooperative Research Centre (CRC) Program supports industry-led research collaborations between industry, researchers and the community. This is a proven model for connecting researchers with industry for the purpose of commercial R&D. The CRC Program is a competitive, merit-based grants program that supports industry-driven, multi-year research collaborations. Since its inception in 1991, the Australian Government has supported over 210 CRCs and committed over $4 billion in program funding (Australian Government Department of Industry, Innovation and Science, 2016).
Figure 12.9 shows patents filed by CRCs in the mining sector. Identifying CRCs is a complex task as they normally have a short life cycle (up to ten years) and can have multiple iterations where the collaborating entities may differ in some cases (Encyclopedia of Australian Science, 2010; Reference LeverLever, P., 2014; Mining3, 2018a). As a result, the data may not capture all involvement of CRCs in the mining sector.

Figure 12.9 Australian patent filings by CRCs
The CRC for Mining Technology and Equipment (CMTE), the Deep Exploration Technologies CRC (DET CRC) and the CRC for Greenhouse Gas Technologies (CO2CRC) have each filed more than one patent family.
Established in 1991, CMTE was one of the first CRCs formed. This CRC had successful funding renewals in 1997 (CMTE 2), in 2003 (CRC Mining 1) and 2009 (CRC Mining 2). Its most current iteration, Mining3, is a partnership between CMTE and the CSIRO Mineral Resources group formed in July 2016. Their research includes areas such as fracture and damage mechanics, rock and coal characterization, and fragmentation and instrumentation. CMTE has filed 29 patent families, which is three times more than the combined number of filings by all other mining CRCs. Most of its patent filings are in technologies related to excavation, drilling, exploration and safety (Mining3, 2018b).
DET CRC was established in 2010 to address the challenge of decreasing mineral resource availability due to high production rates and low mineral exploration success. This CRC has filed five patent families broadly covering aspects of drilling, data logging, and sensing and targeting of mineral deposits. DET CRC was wound up in September 2018 at the end of its Commonwealth funding period. DET CRC licensed a number of its products and services to its company sponsors; these licences are now being managed by MinEx CRC.
The CO2CRC was established with the aim of researching and demonstrating carbon capture and storage as a major industrial emissions reduction technology. All three patent families filed by the CO2CRC are associated with carbon capture technologies.
RoXplorer®
RoXplorer® is an innovative success story developed by DET CRC. One of the major challenges in mineral exploration is to find evidence of mineralization. This is generally a painstaking drilling process. In practice, this means drilling more holes in the right places to give a higher chance of making a discovery. A conventional drill string is made up of individual steel rods that must be connected and disconnected as the drill hole deepens. The requirement for manual rod handling restricts drill rate and poses a risk to operator safety (Reference SoeSoe, 2017).
RoXplorer® is a technology developed by DET CRC to overcome this challenge. It is a coiled tubing drilling rig with a continuous malleable steel coil in the drill string. A motor within the drill string near the base of the hole drives the drill bit. This eliminates the need to add individual drill rods, making drilling quicker, cheaper and safer. RoXplorer® has a much lower estimated operational cost than diamond drilling or reverse circulation drilling (Deep Exploration Technologies CRC, 2018). DET CRC aims to lower the cost of drilling to about $50 per metre by advancing their RoXplorer® technology. Patents WO2018132861 (Mobile coiled tubing drilling apparatus) and WO2018132862 (Rotary drill head for coiled tubing drilling apparatus) are recent mining innovations filed by DET CRC.Footnote 9
12.3 Australia’s R&D Tax Incentive
Australia’s R&D Tax Incentive is the Australian Government’s primary means of supporting business investment in R&D, targeting areas likely to benefit the wider Australian economy. The R&D Tax Incentive, which replaced the former R&D Tax Concession in 2011, provides a company tax benefit to help offset costs of eligible R&D activities in companies registered with the scheme. For the 2016–17 income period, the program reported a $13.7 billion of R&D expenditure by 15,177 R&D performing entities across all industry sectors (Australian Government Department of Industry, Innovation and Science, 2018c).
Ongoing reform helps to ensure the effectiveness, integrity and financial viability of the program. There were 13,346 registrations across all technology areas in 2016–17, including 3,021 new registrants representing an annual increase of 21 percent. The R&D Tax Incentive was reviewed by Reference Ferris, Finkel and FraserFerris et al. (2016), with recommendations to improve the effectiveness, integrity and additionality of the program. These recommendations have been reflected in reforms to the R&D Tax Incentive in the Australian Government Budget 2018–19 (Australian Government, 2018).
12.3.1 The R&D Tax Incentive and the Australian Mining Sector
To assess the impact of the R&D Tax Incentive on the mining sector, we analyzed data on mining companies registered with the program.Footnote 10
Figure 12.10 shows R&D expenditure of registered mining entities using data from the R&D Tax Concession (2000–1 to 2010–11) and the R&D Tax Incentive (2011–12 to 2015–16) programs.

Under these programs, R&D expenditure in the mining sector has grown six-fold from 2000–1. At its peak in 2008–9, the expenditure of $3.74 billion was nearly 21 per cent of the total R&D expenditure of the entire program that year. After a decline from 2008–9 to 2010–11, there was a small recovery in expenditure to 2012–13, following a pattern across the whole program (Australian Government Department of Industry, Innovation and Science, 2018c). This was followed by further decline, with a total decline of 67 per cent by 2015–16 relative to its peak in 2008–9. This decline reflects the overall picture of investment over time in the mining sector following the mining boom, as discussed in the following sections of this chapter.
Company Size
An analysis of company size can provide insight into the differential impact of the program on different business classes. The annual turnover threshold of $20 million is used to separate small to medium-sized enterprises (SMEs) from larger ones. The data on mining companies registered with the R&D Tax Incentive was analyzed by company size (Figure 12.11).Footnote 11

Figure 12.11 Mining sector companies by entity size, 2000–01 to 2015–16
R&D expenditure of both SMEs and large firms followed the overall expediture trend from 2000–1 to 2015–16 shown in Figure 12.10. The R&D expenditure of large firms grew from 2003–4 to 2008–9, with a peak expenditure six times greater than that of SMEs. Since 2008–9, R&D expenditure by large firms has dropped to a ten-year low in 2015–16.
Mining by Industry Subdivision
We analyzed the data on mining companies registered with the R&D Tax Incentive by Australian and New Zealand Standard Industrial Classification (ANZSIC) code (Reference Trewin and PinkTrewin and Pink, 2006) for two subdivisions: mining and exploration and other support services (Figure 12.12). While R&D expenditure of the registered companies in the mining subdivision drove the overall trend shown in Figure 12.10, companies in the exploration and support services industry subdivision did not conform to this trend, with a lower uptake of the program. Figure 12.4 also shows more patenting activity in the mining area compared with exploration and support services, although not such a marked difference as seen here.

12.3.2 Patenting Activity and the R&D Tax Incentive
To explore potential correlations between R&D expenditure and patenting activity in the mining industry, we analyzed patent family filings and R&D expenditure of R&D Tax Incentive-registered entities (Figure 12.13).

R&D expenditure and patenting show similar patterns over time, with an overall increase from 2000–1 to 2009–10. Both the number of patents filed and R&D expenditure increased from 2009–10, with a peak in 2012–13.
R&D expenditure grew three-fold from 2009–10 to 2012–13, representing a stronger increase than the corresponding growth in the number of patent filings. This indicates the expenditure was not associated with innovation in products and processes requiring commercial protection to hold or build market share.
Both R&D expenditure and patenting activity declined steeply since 2012–13, which follows the overall decline after the peak of the Australian mining boom in 2012.
R&D Expenditure and Patent Filing by Australian State and Territory
Mining investment and activity varies considerably across Australia. To provide insight into the impact of the R&D Tax Incentive on the mining industry in different Australian States or Territories, we have compared R&D expenditure, patenting activity and the number of R&D Tax Incentive-registered entities in the mining sector by State or Territory (Figure 12.14).Footnote 12

Figure 12.14 Mining sector performance under the R&D Tax Incentive by State and Territory, 2000–1 to 2015–16
This geographical analysis demonstrates considerable differences between the number of companies registered for the R&D Tax Incentive, R&D expenditure, and the number of patents originating from each state and territory.
Western Australia (WA) has the highest R&D expenditure under the R&D Tax Incentive ($2.55 billion) and the highest number (84) of R&D Tax Incentive-registered entities in the mining sector. WA also has the second highest number of patents (328) filed by matched companies. This may be attributable to the richness of the iron ore and gold resources of this region: the majority of Australia’s gold exploration activity and iron ore deposits with operating mines are located in WA. This makes WA’s mineral resources particularly valuable to the global market since Australia is the largest iron ore exporter in the world, holding 29 per cent of global iron ore reserves, and is the second largest producer of gold in the world, after China (Australian Government Department of Industry, Innovation and Science, 2018a).
Victoria (VIC) has the second highest mining R&D expenditure ($1.42 billion) and the third highest number of patents (285) filed by matched companies. However, only 16 R&D Tax Incentive-registered entities are located in Victoria. Queensland (QLD) has the second highest number (55) of R&D Tax Incentive-registered entities, third highest R&D expenditure ($1.12 billion) and is fourth in terms of the number of patents filed.
The overall disparity in the number of patent filings by state and the R&D Tax Incentive data could be a consequence of corporate headquarters filing both patents and R&D Tax Incentive claims. These corporate offices are usually located in metropolitan cities, with Sydney being a very popular choice. This might account for New South Wales (NSW) having the highest number of patent filings recorded in Australia, but much lower R&D expenditure than Victoria, Queensland and Western Australia.
This indicates that, while there is useful information to be derived from comparing matched R&D Tax Incentive data with patent data in the mining sector, geographical data does not appear to be directly comparable, likely due to differences in defining entity locations.
12.4 Patenting in Australia
While the focus of this chapter is to explore Australian innovation in the mining sector, we have also included an analysis of patent filings into Australia as part of a broader overview of the Australian mining industry. Patents are filed to seek patent protection in specific jurisdictions. As such, patent filings in a country can give an indication of how valuable a technology is considered to be in a particular market. The analysis of patent filings in Australia can therefore be used to infer the relative importance of Australia in the global mining landscape.Footnote 13
12.4.1 Patent Filing in Australia over Time
Over the past two decades, a total of 16,374 patent families were filed in Australia in the mining sector. Figure 12.15 shows the annual number of patent families filed from 1997 through 2015. Patenting activity tripled between 2005 and 2012, with a decline since then. While this may be partly due to incomplete data for 2015,Footnote 14 the severity of the decline indicates that there may be further underlying factors.

Figure 12.15 Patent filings into Australia, by priority year, 1997–2015
To understand the fall in mining sector patenting activity in Australia since 2013, we have investigated other proximate factors such as commodity prices as well as mining profits and investment. First, Figure 12.16 shows movements in commodity prices (Reserve Bank of Australia, 2018). Second, Figure 12.17 shows Australian mining sector profits as a share of GDP (Australian Bureau of Statistics, 2018c). Third, Figure 12.18 shows mining sector investment proportional to GDP (Australian Bureau of Statistics, 2018d). In all three Figures 12.16 to 12.18, we observe a sharp drop from a peak around 2012–13, which coincides with the fall in patenting activity in Australia.

Figure 12.16 RBA Index of Commodity Prices, 1997–2015
Note: Commodity price is SDR; 2016/17 average = 100.

Figure 12.17 Mining sector profits as a share of nominal GDP, 1997–2015
Note: Gross operating profits, inventory valuation adjusted.
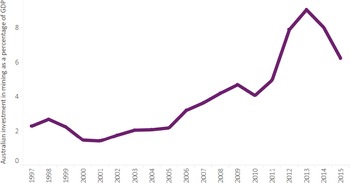
Figure 12.18 Australian investment in mining as a percentage of GDP, 1997–2015
While the decline in patent filings and R&D expenditure by Australian companies (Figure 12.13) coincides with the fall in commodity prices as well as mining profits and investment after 2012–13, this does not reflect the severity of the drop in patent filings into Australia from 2013–15. This suggests a number of other factors, including global issues, may have contributed to the decline in patent filings into Australia since 2012–13 (Reference KentKent, 2016).
While acknowledging that the patent filing data is incomplete for 2015 onwards, as discussed previously, it seems likely that a complex combination of factors has contributed to the dramatic drop in patent filings into Australia from 2013–15. This drop – to a 20-year low and with half the number of patent filings of 1997 – is particularly noticeable given the mining industry was much bigger in 2015 than in 1997. The drop in R&D expenditure by Australian companies may be attributable to the overall drop in mining investment, which is in turn attributable to the drop in commodity prices and in corporation profits, none of these downturns are as severe as that in patent filings into Australia. Revealing its underlying causes therefore warrants further research.
12.4.2 Technology Specialization in Australia
An analysis of patenting in different technology areas provides an overall picture of innovation in the sector. In this vein, Figure 12.19 shows the number of patent families filed into Australia in different mining technology areas.Footnote 15

Figure 12.19 Patent filings into Australia by mining technology
The top three technology categories for patent filings into Australia are exploration, mining and refining. This differs from global patent filings originating from Australian applicants, in which the top three technology areas are mining, refining and exploration, respectively (Figure 12.4). This reflects the differences between foreign and domestic patent applicants in terms of what they invent and want to protect in Australia.
12.4.3 Who is Filing Patents in Australia?
Patent filing data can be used as a proxy indicator of innovation performance of a nation; therefore, the analysis of patent applicant origin may reflect how innovative a country is. Figure 12.20 shows the total number of patent families filed in Australia in the mining sector by various source countries from 1997 onwards. Australia ranks second, with 1,968 domestic patent filings filed by Australian applicants. A total of 6,477 patent filings originate from applicants in the USA, by far the most from any country, and about three times more filings than the second-placed Australian applicants. The most prominent Australian companies filing into Australia are the Australian subsidiaries of Rio Tinto (139 patent filings) and BHP Billiton (103 patent filings).

Figure 12.20 Patent filings into Australia by applicant origin
12.4.4 Top Innovators Filing patents in Australia
The number of patent families filed by an applicant in a specific technology can be indicative of its strength, interest and market presence or desire to build and maintain a market share. Figure 12.21 shows the top applicants for inventions that were filed into Australia in the mining sector.

The core business for a number of these applicants, such as the top applicant, Halliburton, appears to centre on providing products and services predominantly to the oil and gas sectors, which are specifically excluded from the definition of mining technologies in this analysis. The fact that these companies are key players for patents in the mining technologies covered by this chapter indicates an overlap of technologies used by both the mining and the oil and gas sectors.
Halliburton
Halliburton, founded in 1919 and with its headquarters in the USA, is one of the world’s largest providers of products and services to the global energy industry and in particular to oil and gas companies. Its services include locating resources, managing geological data, drilling, construction and supporting production throughout the life of a project (Halliburton, 2019; cf. Bloomberg, 2019b). Halliburton also owns Landmark, a technology solutions provider of data and analytics, science, software and services for the exploration and production industry (Halliburton Landmark, 2019). Patent filings by Landmark (194 families or 11 per cent) are a significant contribution to overall filings in Australia by Halliburton in the mining sector.
Halliburton has been a consistent patent filer in Australia to 2008, after which its filings increased strongly, particularly in 2012 and 2013. Halliburton’s filings have predominantly been in the exploration area (89 per cent).
General Electric
Based in the USA, General Electric is a global company operating in diverse fields including power, renewable energy, oil and gas, aviation, healthcare, transportation and lighting (GE Australia, 2019; cf. Bloomberg, 2019a). The General Electric group includes Baker Hughes, a global company with operations in over 120 countries. Baker Hughes is a provider of integrated oil-field products, services and digital solutions (Baker Hughes, 2019). Like Halliburton, the core Baker Hughes business appears to centre on providing products and services predominantly to the oil and gas sectors.
Patent filings in Australia by General Electric in the mining area have been mostly through the Baker Hughes company (650 families or 81 per cent). Like Halliburton, General Electric (Baker Hughes) was a consistent patent filer in Australia up to 2008, after which their filings increased dramatically, particularly during 2009–11. Its filings have also been predominantly in the exploration area (74 per cent).
Sandvik AB
Sandvik AB, with headquarters in Stockholm, Sweden, is a global high technology engineering group. It provides equipment and tools, service and technical solutions for the mining industry (Sandvik, 2019; cf. Bloomberg, 2019c). Sandvik AB has consistently filed for patents in Australia with increased activity here between 2003 and 2011, and in 2013. Its filings have predominantly been a mixture of the exploration and mining operations areas.
Schlumberger
Schlumberger, operating in over 85 countries, is a global provider of products and services for exploration and production of the oil and gas industry (Schlumberger, 2019). It has principal offices in Paris, Houston, London and The Hague. Schlumberger has consistently filed for patents in Australia with a sharp increase from 2008. Its filings have mainly been in the exploration area.
12.4.5 Collaboration in Patent Filings in Australia
The presence of multiple applicants on an application is indicative of collaboration. Figure 12.22 shows the top countries of origin for collaborative mining sector patents filed in Australia. The USA is the most collaborative country filing patents in Australia, with Australia ranking second. All the top collaborative countries have a mixture of domestic and international collaborations.

Figure 12.22 International collaboration on patent filings into Australia in the mining sector
Note: This figure compares collaborations between applicants in the same country (internal collaborations) and between applicants of different countries (external collaborations).
Figure 12.23 shows the top mining technology areas for collaborative patents; the top three areas are mining operations, exploration and refining technologies. Differences in collaboration in different technologies by country of origin are shown in Figure 12.24, which highlights patterns of specialization and indicates the resultant competitive advantage of countries.

Figure 12.23 Collaboration on patent filings into Australia in the mining sector by technology

Figure 12.24 Collaboration on patent filings into Australia by technology by country.
Note: Collaboration by the top four collaborating countries.
In summary, interest in the Australian mining market has been through a period of turbulence from 1997–2015, including strong collaboration and strong investment by domestic innovators. The market has a focus driven by USA firms on exploration, mining and refining technology development.
There has been a steep drop in patent filings into Australia during 2013–15, which does not appear to be purely cyclical. It is possible that factors not identified in the data used for this chapter have affected the perceived value and strength of this sector in Australia.
12.5 Conclusion
Australia is a global leader in the mining sector, both due to its rich resources and to its technological innovation and investment in this sector.
We have analyzed innovation in the Australian mining sector using patent data from 1997–2015, finding a total of 2,997 Australian mining sector patents filed during this period. Patenting activity by Australian entities increased from the early 2000s to peak during 2010–12. This was followed by a decline, returning to the 1998 level in 2015. The rise and fall in patenting activity coincides with similar movements in commodity prices, as well as mining profits and investment.
We analyzed patenting activity in the light of company participation in the Australian Government’s R&D Tax Incentive program. Patenting activity and business R&D expenditure broadly followed similar patterns over time, peaking in the years around 2010 and then declining. R&D expenditure by entities registered for the R&D Tax Incentive grew six-fold from 2000–1, peaking in 2008–9 with an expenditure of $3.74 billion. By 2015–16, this declined by two thirds.
A similar picture is observed in patent filings into Australia. These peaked in 2012, and declined strongly thereafter. This indicates a decline in patent protection in the Australian market from both domestic and international applicants, which could reflect the perceived value and strength of this sector.
Overall, patenting activity and R&D expenditure followed the rise and fall of the Australian mining boom, peaking in 2012 and declining thereafter to 2015. However, the Australian mining industry is well positioned to fuel a growing demand for electric vehicles. Australia has the world’s largest reserves of nickel, and is the world’s largest producer of lithium. Australia is the fourth largest global producer of manganese ore and cobalt, and the fifth largest producer of nickel and copper (Reference BrittBritt et al., 2017). These are essential inputs for the production of electric vehicle batteries. The demand for these metals is forecast to rise steeply by 2030 in the lithium-ion battery supply chain for electric vehicles (Bloomberg New Energy Finance, 2018).
To realize the opportunities, Australia will need enough targeted investment in R&D in different mining technologies. This will not only support efficient use of resources but also build investor confidence in the Australian market.


 Open access