3 results
Temporal trends in urine-culture rates in the US acute-care hospitals, 2017–2020
- Sophia Kazakova, Natalie McCarthy, James Baggs, Kelly Hatfield, Babatunde Wolford, Babatunde Olubajo, John Jernigan, Sujan Reddy
-
- Journal:
- Antimicrobial Stewardship & Healthcare Epidemiology / Volume 2 / Issue S1 / July 2022
- Published online by Cambridge University Press:
- 16 May 2022, p. s12
-
- Article
-
- You have access Access
- Open access
- Export citation
-
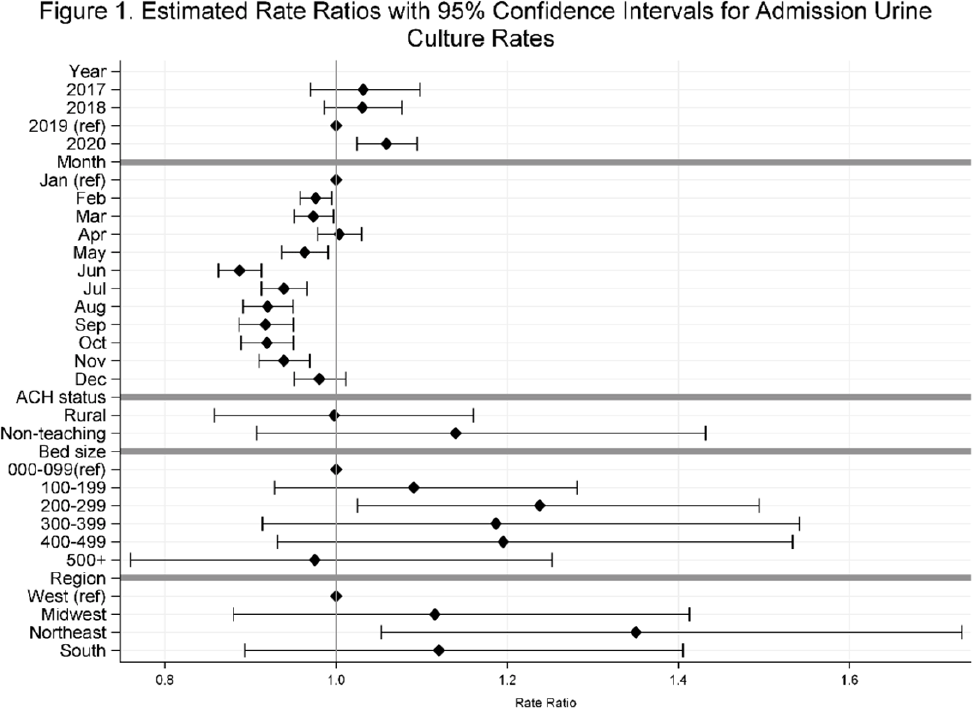
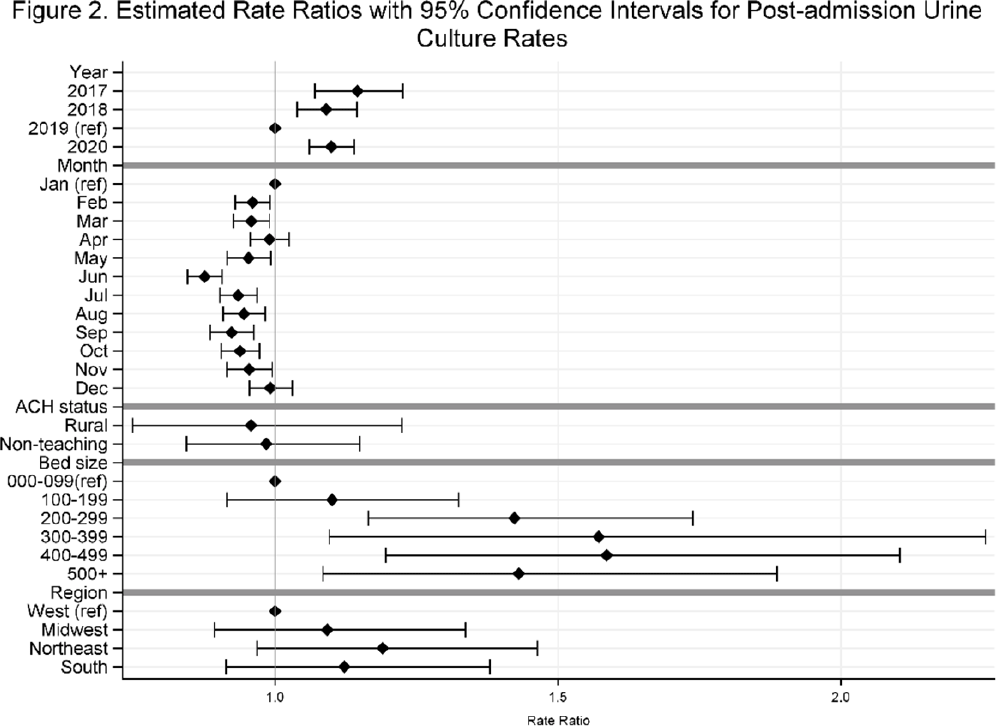
Background: Previously, we reported decreasing postadmission urine-culture rates in hospitalized patients between 2012 and 2017, indicating a possible decrease in hospital-onset urinary tract infections or changes in diagnostic practices in acute-care hospitals (ACHs). In this study, we re-evaluated the trends using more recent data from 2017–2020 to assess whether new trends in hospital urine-culturing practices had emerged. Method: We conducted a longitudinal analysis of monthly urine-culture rates using microbiology data from 355 ACHs participating in the Premier Healthcare Database in 2017–2020. All cultures from the urinary tract collected on or before day 3 were defined as admission urine cultures and those collected on day 4 or later were defined as postadmission urine cultures. We included discharges from months where a hospital reported at least 1 urine culture with microbiology and antimicrobial susceptibility test results. Annual estimates of rates of admission culture and postadmission urine-culture rates were assessed using general estimating equation models with a negative binomial distribution accounting for hospital-level clustering and adjusting for hospital bed size, teaching status, urban–rural designation, discharge month, and census division. Estimated rate for each year (2018, 2019, and 2020) was compared to previous year’s estimated rate using rate ratios (RRs) and 95% confidence intervals (CIs) generated through the multivariable GEE models. Results: From 2017 to 2020, we included 8.7 million discharges and 1,943,540 urine cultures, of which 299,013 (15.4%) were postadmission urine cultures. In 2017–2020, unadjusted admission culture rates were 20.0, 19.6, 17.9, and 18.2 per 100 discharges respectively; similarly, unadjusted postadmission urine-culture rates were 8.6, 7.8, 7.0, and 7.5 per 1,000 patient days. In the multivariable analysis, adjusting for hospital characteristics, no significant changes in admission urine-culture rates were detected during 2017–2019; however, in 2020, admission urine-culture rates increased 6% compared to 2019 (RR, 1.06; 95% CI, 1.02–1.09) (Fig. 1). Postadmission urine-culture rates decreased 4% in 2018 compared to 2017 (RR, 0.96; 95% CI, 0.91–0.99) and 8% in 2019 compared to 2018 (RR, 0.92; 95% CI, 0.87–0.96). In 2020, postadmission urine-culture rates increased 10% compared to 2019 (RR, 1.10; 95% CI, 1.06–1.14) (Fig. 2). Factors significantly associated with postadmission urine-culture rates included discharge month and hospital bed size. For admission urine cultures, discharge month was the only significant factor. Conclusions: Between 2017–2019, postadmission urine-culture rates continued a decreasing trend, while admission culture rates remained unchanged. However, in 2020 both admission and postadmission urine culture rates increased significantly in comparison to 2019.
Funding: None
Disclosures: None
Burden and Trends of Hospital-Associated Community-Onset (HACO) Infections From Antibiotic Resistant and Nonresistant Bacteria
- Babatunde Olubajo, Sujan Reddy, Hannah Wolford, Kelly Hatfield, John Jernigan, James Baggs
-
- Journal:
- Infection Control & Hospital Epidemiology / Volume 41 / Issue S1 / October 2020
- Published online by Cambridge University Press:
- 02 November 2020, p. s145
- Print publication:
- October 2020
-
- Article
-
- You have access Access
- Export citation
-
Background: Studies on the effectiveness of hospital-based interventions often measure hospital-onset infections as the outcome of interest. However, hospital-associated infections may manifest after patient discharge (classified as hospital-associated community-onset, HACO), and the epidemiology may vary by antibiotic resistance (AR) profile. We examined the epidemiology and trends of HACO infections of AR and non–antibiotic-resistant (non-AR) bacteria. Methods: We included clinical community-onset (CO) cultures (obtained sooner than or on day 3 of hospitalization) yielding the bacterial species of interest among hospitalized patients in 260 hospitals in the Premier Healthcare Database from 2012 to 2017. HACO infections were defined as CO cultures in a patient who had a previous hospitalization in the same hospital within 30 days. We examined methicillin resistance among Staphylococcus aureus (MRSA), vancomycin resistance among Enterococcus spp (VRE), carbapenem resistance among Enterobacteriaceae (E. coli, Klebsiella spp, and Enterobacter spp) (CRE), extended-spectrum cephalosporin resistance suggestive of extended-spectrum β-lactamase (ESBL) production in Enterobacteriaceae, carbapenem resistance among Acinetobacter spp (CRAsp), and carbapenem resistance among Pseudomonas aeruginosa (CRPA). We described the proportion of CO infections that were HACO, the proportion of HACO infections from sterile sites, overall HACO rates, and annual trends for sensitive and resistant phenotypes. Generalized estimating equation regression models that accounted for hospital-level clustering were used to estimate annual trends controlling for hospital characteristics and month of discharge. Results: The rate of HACO infections by pathogen ranged from 0.78 to 38.76 per 10,000 hospitalizations; 7%–34% were sterile site infections (Table 1). For each bacterial pathogen, a significantly higher proportion of AR CO infections had a previous hospitalization compared to non-AR CO infections (all χ2, P < .05). The annual trends for AR and non-AR HACO infections between 2012 and 2017 were significantly decreasing for most pathogens, except ESBL HACO infections. Conclusions: Even when using a definition limited to readmission to the same hospital, HACO infections occur commonly with differing rates by pathogen and antibiotic resistance profile. Although these rates are decreasing for most of the pathogens studied, improving surveillance and identifying prevention strategies for these infections are necessary to further reduce the burden of hospital-associated infections.
Funding: None
Disclosures: None
Variability and Trends in Blood Culture Utilization, US Hospitals, 2012–2017
- Kelly Hatfield, Natalie McCarthy, Sujan Reddy, James Baggs, Lauren Epstein, Sophia Kazakova, Babatunde Olubajo, Hannah Wolford, John Jernigan
-
- Journal:
- Infection Control & Hospital Epidemiology / Volume 41 / Issue S1 / October 2020
- Published online by Cambridge University Press:
- 02 November 2020, pp. s430-s431
- Print publication:
- October 2020
-
- Article
-
- You have access Access
- Export citation
-
Background: Microbiology data are utilized to quantify epidemiology and trends in pathogens, antimicrobial resistance, and bloodstream infections. Understanding variability and trends in rates of hospital-level blood culture utilization may be important for interpreting these findings. Methods: We used clinical microbiology results and discharge data to identify monthly blood culture rates from US hospitals participating in the Premier Healthcare Database during 2012–2017. We included all discharges from months where a hospital reported at least 1 blood culture with microbiology and antimicrobial susceptibility results. Blood cultures drawn on or before day 3 were defined as admission cultures (ACs); blood cultures collected after day 3 were defined as a postadmission cultures (PACs). The AC rate was defined as the proportion of all hospitalizations with an AC. The PAC rate was defined as the number of days with a PAC among all patient days. Generalized estimating equation regression models that accounted for hospital-level clustering with an exchangeable correlation matrix were used to measure associations of monthly rates with hospital bed size, teaching status, urban–rural designation, region, month, and year. The AC rates were modeled using logistic regression, and the PAC rates were modeled using a Poisson distribution. Results: We included 11.7 million hospitalizations from 259 hospitals, accounting for nearly 52 million patient days. The median annual hospital-level AC rate was 27.1%, with interhospital variation ranging from 21.1% (quartile 1) to 35.2% (quartile 3) (Fig. 1). Multivariable models revealed no significant trends over time (P = .74), but statistically significant associations between AC rates with month (P < .001) and region (P = .003), associations with teaching status (P = .063), and urban-rural designation (P = .083) approached statistical significance. There was no association with bed size (P = .38). The median annual hospital-level PAC rate was 11.1 per 1,000 patient days, and interhospital variability ranged from 7.6 (quartile 1) to 15.2 (quartile 3) (Fig. 2). Multivariable models of PAC rates showed no significant trends over time (P = .12). We found associations between PAC rates with month (P = .016), bed size (P = .030), and teaching status (P = .040). PAC rates were not associated with urban–rural designation (P = .52) or region (P = .29). Conclusions: Blood culture utilization rates in this large cohort of hospitals were unchanged between 2012 and 2017, though substantial interhospital variability was detected. Although both AC and PAC rates vary by time of year and potentially by teaching status, AC rates vary by geographic characteristics whereas PAC rates vary by bed size. These factors are important to consider when comparing rates of bloodstream infections by hospital.
Funding: None
Disclosures: None