

2.1 Introduction
Products of the mining industry are an essential part of our lives. We need them to satisfy our everyday needs. The growing worldwide population, together with the rising living standards, increases the demand for minerals. The mining industry faces continuous challenges to meet such demand and to fulfill the sustainability requirements imposed by policy-makers. Innovation is a key instrument to address these challenges.
Traditionally, innovation economists have not considered the mining sector to be very innovative (Reference BartosBartos, 2007; Reference Scherer and GrilichesScherer, 1984). According to this view, mining firms are more likely to be large and capital intensive to benefit from economies of scale when facing a demand that relies mostly, if not entirely, on the price of mining commodities. Mining firms have few incentives to differentiate through product innovation or branding. Most innovations are related to cost-cutting processes, aiming to improve their narrow margins. As a result, mining firms source new technologies from their own production engineering departments or embedded in products and services obtained from specialized suppliers (Reference PavittPavitt, 1984).
Nevertheless, there is compounding evidence to suggest not only that the mining sector is innovative but also that, recently, it is increasingly so. In most mining countries, this sector often contains a disproportionate number of innovative firms compared to other sectors (Reference Arundel and KablaArundel & Kabla, 1998). In addition, the sector has observed a dramatic increase in all innovation indicators since the early 2000s.
In Europe alone, around USD 657 million was spent on research and development (R&D) in mining in 2015. Although it is still much lower than so-called high-tech sectors, such as pharmaceuticals (USD 10,868 million) or chemical manufacturing (USD 7,416 million) in the same year, it is still higher than agriculture (USD 654 million) and consumer electronics manufacturing (USD 347 million) (Eurostat, 2018).Footnote 1
We also observe that intellectual property (IP), particularly patents, is increasingly important for the mining industry. There were more mining-related inventions looking for patent protection in the last five years than all those accumulated from 1970 to 2000. Large mining enterprises and firms specialized in mining equipment, technology and services (METS) increasingly use IP to pursue their internationalization strategy. Both mining and METS companies operate in different countries and patents may help them secure their IP across jurisdictions and appropriate the knowledge embedded in new products and processes.
This chapter analyzes this recent uptake in mining innovation. We document in detail the innovation ecosystem behind this surge and discuss what it may represent for the future of the industry. We make use of a newly assembled patent database focusing on mining innovation, which enables us to study the change in mining innovation ecosystems before and after the surge.
The rest of this chapter is structured as follows. Section 2.2 defines technological innovation in the mining industry, presenting trends that show evidence of a change in innovation around the first half of the 2000s. Section 2.3 presents the results of our analysis identifying which factors are behind the mining patents boom and Section 2.4 offers concluding remarks.
2.2 Increased Global Mining Innovation
As in any other sector, mining firms innovate in their products, production processes or organizational practices. As input for these innovation outputs, mining firms perform research and development (R&D) activities, acquire off-the-shelf technologies – typically embodied in equipment and machinery – or acquire disembodied technologies such as outsourced R&D or other technological services. However, measuring these innovation traits is not always straightforward and this is particularly the case in the mining industry. We discuss the general global trends of mining innovation in the following, including some limits of these standard indicators.
Discerning an unequivocal global R&D expenditure trend is an almost-impossible task. The global mining-related R&D expenditure of the last decade is likely to be around USD 140 billion.Footnote 2 China (47%), the United States (22%), Australia (17%), Canada (8%) and Europe (5%) are the largest contributors to this global figure.
However, a national R&D series may be able to shed some light on how the trend might look. Figure 2.1 shows the spectacular increase of Australian mining R&D expenditure in the 2000s. In the first half of the last decade, the Australian mining sector more than doubled R&D investment. In the second half, the investment in R&D by the sector increased at a much higher rate than before. In contrast, we also observe that mining R&D expenditures have declined recently, coinciding to some extent with the recent global financial crisis and slowdown.

Figure 2.1 R&D expenditure in mining in Australia, 1993–2016.
Note: Business expenditure on R&D for ANZSIC Division B.
It is worth noting that aggregate mining R&D statistics often also include expenditure for the oil and gas industry. In the case of Australian mining R&D expenditures in 2015–16, about 33 percent relates to oil and gas R&D expenditures. Similarly, many of these aggregate R&D figures may or may not include R&D performed by firms outside typical mining industry definitions. For instance, the Australian statistics include R&D expenses incurred by METS firms but do not include R&D expenses relating to mining technologies incurred by firms that are not classified as mining or METS nor public R&D related to mining.
Regarding product innovation, the mining industry is a little different from other economic sectors. The discovery of entirely new products is extremely rare, suggesting that the scope for product innovation in mining itself is very limited.Footnote 3 While the discovery and development of newly mined products may be rare, the discovery of new commercial deposits of existing products is a key element of mining activity. In fact, when talking about product innovation in mining, it could be argued that it is the deposits or the mines that are really the “product” rather than the mineral recovered from them. Viewed in this way, a company’s expenditure on exploration becomes a part of its R&D expenditure, even though such expenditure may not be recognized formally as R&D (Reference Kreuzer and EtheridgeKreuzer & Etheridge, 2010).
While typical aggregate R&D figures do not include the exploration investments, there are some estimations of the global magnitude of exploration expenditure. The rise in exploration expenditure in the first half of the 2000s is also remarkable and similar to the R&D trend in Australia. This noteworthy increase happened across all types of minerals (Figure 2.2). The early 1990s also show an increase in the level of exploration expenditure, but of a much smaller magnitude compared to what was observed in the next decade. We also observe a substantial decline after 2012.
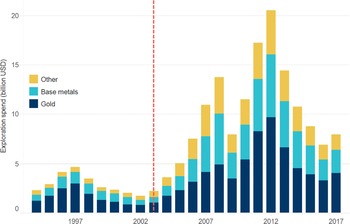
Figure 2.2 Worldwide mineral exploration expenditure (US $ bn) by commodity, 1994–2017.
These exploration figures have some limitations as well. First, they include all the activities related to exploration, many of which might not be innovative. Second, exploration is only one of the many mining supply chain segments where innovation can occur. Third, it is not uncommon that mining companies outsource exploration efforts to smaller companies specializing in prospecting. Mining companies take over or invest in these smaller companies only in the case of successful deposit identification, much like large pharmaceutical companies do with small biotechnology companies.
An alternative innovation indicator is patenting activity, which is an output indicator as it measures potential innovation outputs.Footnote 4 Figure 2.3 shows the number of patent families relating to mining technologies filed since 1991. It shows a relatively steady number of inventions filed between 1990 and 2003, with an exponential growth observed from the second half of the 2000s. Differently from R&D and exploration figures, we observe a slowdown but not a reverse of trend after 2012.
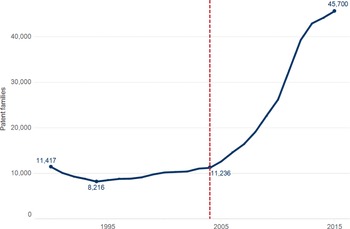
Figure 2.3 Worldwide mining technologies, 1990–2015.
Patent data has many advantages when measuring mining innovation, but also limitations. First, patent publication data is rich in bibliographic information allowing for a detailed breakdown of the analysis, ranging from complete mining innovation country-year series to in-depth analysis of mining innovation stakeholders. Second, the body of patent literature reflects the entire technological developments related to the mining industry, including those produced by entities not defined as mining companies in industry classifications. This second advantage allows for a thorough examination of the mining innovation ecosystem and the different segments of its supply chain. On the other hand, not all mining innovation output necessarily ends in a patent document. Indeed, trade secrets and tacit knowledge are part of the innovation process of the mining sector. These limitations are not specific to mining innovation as the economics of innovation literature has discussed at length the use of patents as a proxy for innovation (Reference Lerner and SeruLerner & Seru, 2017).
One existing concern about using patent indicators relates to the overall surge in patent applications in the same period that we observe an increase in mining-specific patents (Reference Fink, Khan and ZhouFink et al., 2013). However, as shown in Figure 2.4, mining patents have outpaced the overall patenting activity since 2004. After more than a decade of decline in the 1990s and early 2000s, we observe the share of mining patents almost doubles from 2004 to 2013. We can also see a slight fall since 2013, when the share fell back to 2009–10 levels in 2015 compared to 2004.
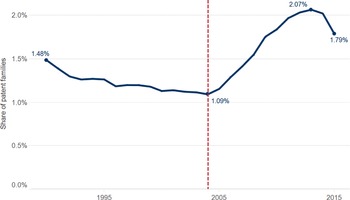
Figure 2.4 Worldwide mining technologies as share of technologies, 1991–2015.
All in all, the different indicators do refer to a similar global picture. Mining innovation increased in a rather spectacular fashion in the early 2000s for about a decade. We also observe at least some signs of a slowdown in the last years. But these aggregate series tell us very little about the geography of innovation or the technological changes that may be happening in the mining supply chain structure. To provide answers to these open questions, we will analyze in detail the patents associated with mining activity as follows, describing the different parts of the mining value chain and the different technological contributions to the mining industry.
2.3 What Is Behind the Mining Innovation Boom?
The understanding of mining innovation and the recent surge using patent data entails going beyond the patenting activity of mining firms, but also going beyond patents in the mining sector. There are well-known challenges in defining mining industry innovation using only a technological approach to patent data (European Commission, 2016; Reference FrancisFrancis, 2015; INAPI, 2010). These challenges include defining the non-core mining industries and deciding how much they contribute to the definition of mining. However, it is necessary to define mining technologies because mining firms also appear to innovate in industries other than mining, and therefore have patents in other technology areas. Moreover, mining innovation is also done by METS firms, making it challenging to rely on mining firms alone to define mining innovation.
Our data confirms such concerns (Figure 2.5). Between 1990 and 2015, there were 663,322 inventions filed for patent protection related to a mining technology.Footnote 5 Mining and METS companies filed for fewer than half – 239,065 patent families – of those. However, mining firms patented many of their inventions out of the mining-related patent classes. These companies applied for 5,981,258 patent families not relating directly to mining technologies. From these results, we can see clearly that mining technologies can start from stakeholders other than mining-related firms, while mining firms can be very active beyond mining innovation. While neither approach can be considered fully comprehensive, we will use these depending on the type of analysis performed.
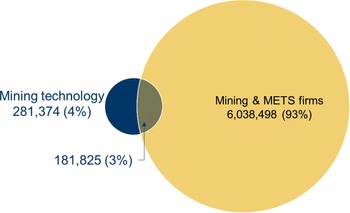
Figure 2.5 Patent families potentially related to mining by source.
Mining Innovation Spurs on the Mining Production Life Cycle and Value Chain
We base our definition of mining technology on the different stages of the mineral extraction process – the mining life cycle – and how its supply chain is organized accordingly (Figure 2.6).
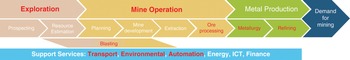
Figure 2.6 Simplified view of the lifecycle of a mine.
Note: The mining sub-sectors presented in red text indicate the subsectors defined in the patent mining taxonomy.
The mining life cycle consists of several distinct stages, starting with the exploration and discovery of an ore-body, moving to the extraction, refining and shipping of minerals and finalizing with the mine closure to its natural state. Each stage of the mining life cycle can include innovation inputs in multiple areas of technology. The exploration stage includes activities such as ore-body discovery, mineral determination, resource estimation and feasibility studies. The mining operation stage includes activities such as mine planning, design and development, mine construction, and mineral extraction and processing. Once the ore has been processed, then refining can occur. Services such as transport, waste treatment and energy generation support and add value to each stage of the process.
Based on the knowledge domain required for each stage of the mining life cycle and patent classifications, we define all mining technology-related patents in nine mining subsectors: automation, blasting, environmental, exploration, metallurgy, mining/mine operation, (ore) processing, refining and transport. The overlap of our technology subsectors, as defined by patents with the mining life cycle, is indicated in red text in Figure 2.6.Footnote 6
We observe mining innovation all across these subsectors. The mining subsectors with more innovation are exploration (24.8% of total mining innovation) and refining of extracted materials (19.1%). Other fields involve less innovation: blasting (0.6%), environmental improvements (12.6%), metallurgy (1,1%), mining (31.1%), processing (4.6%) and transport (6%) (Figure 2.7).
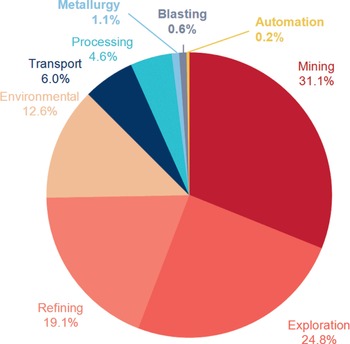
Figure 2.7 Mining technologies by subsectors, 1990–2015.
Some subsectors have contributed to the recent mining innovation uptick more than others. Comparing the distribution trends, there has been a switch from refining mostly to exploration and transport (see Figure 2.8). There is also a smaller share increase from environmental innovation and processing subsectors. The industry’s technological response to the extractive products demand surge seems to have put less emphasis on improving refining methods. This may be a consequence of the declining quality of mined ores, making it inefficient to invest in new refining techniques. Firms could prefer to dig new mines instead. The increase in exploration and transport probably relates to the industry’s increasing need to discover new deposits in more distant locations to face rising demand (see Chapter 5). Similarly, the increase in the share of environmental technologies is probably linked with wider social and industry awareness of the environmental impact of mining activities (see Chapter 6).
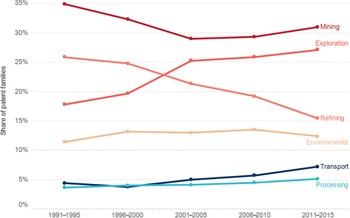
Figure 2.8 Distribution of mining technologies in subsectors by period, 1990–2015.
Note: Only the six top subsectors included.
In addition, the so-called fourth industrial revolution – namely advances in information technology and artificial intelligence – may offer even more potential for raising productivity in knowledge-based activities like deposit modeling (exploration), logistics (transport) or waste management (environmental), among many other examples. Interestingly, automation innovation in mining increased both in volume and share during the 1990s and early 2000s, when overall mining innovation activity was relatively flat (see Figure 2.9 and Figure 2.3). Automation innovation had a slow start when mining innovation started to pick up its pace in the second half of the 2000s. However, we now observe a spectacular second boom of automation in both volume and proportion of mining patents, which is likely related to the spread of digitalization.
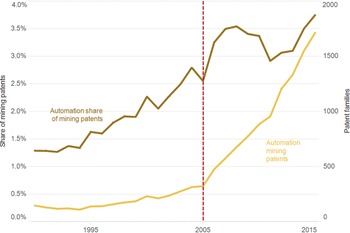
Figure 2.9 Patents families in automation class over time.
Where Is All This Mining Innovation Originating?
The distribution of economies contributing to mining technologies does not match one-to-one with the typical mining-producing ones (Figure 2.10). Only China and the United States gather more than 10% in both mining output and innovation. The Russian Federation is the only other economy to have more than 10% of mining output, but it generated less than 1% of the mining innovation. Japan, generating more than 10% of the innovation but producing less than 0.1% of the output, is the opposite case. On a different scale, some other economies have a relatively balanced output–innovation ratios, such as China and the United States. Australia, Canada and Norway produce more than 1% of the mining output and generate about 1% of the innovation. Conversely, the United Kingdom generates more than 1% of the mining innovation and produces slightly less than 1% of the output. One order of magnitude lower, Spain having about 0.1% of both output and innovation is another example.
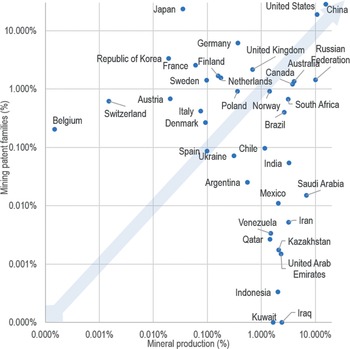
Figure 2.10 Mining production and innovation by country, selected countries.
Note: Sample contains only top mineral-producing and top mining-patenting countries. Axes are expressed in logarithmic scale.
Countries such as Brazil, Chile, India, Indonesia, Iran, Iraq, Kazakhstan, Kuwait, Mexico, Qatar, Saudi Arabia, South Africa and Venezuela – in addition to the already mentioned Australia, Canada, Norway and the Russian Federation – produce substantially more mining output than Japan or even the United Kingdom, but they produce much less mining innovation. On the contrary, countries such as Austria, Belgium, Denmark, Finland, France, Germany, Italy, Netherlands, Poland, Republic of Korea, Sweden and Switzerland join Japan and the United Kingdom in their disproportionate contribution to mining innovation given their production. It is also important to note that these economies – including the United States, China, Australia, Canada and Norway – not only generate most of the mining technologies but they are also where most of the patent protection is sought. Very few mining technologies seek patent protection in countries with high mining output but relatively low innovation.
What explains these different patterns between mining production and innovation? One of the most plausible explanations is that mining innovation – particularly breakthrough patentable innovation – is more likely to happen in functioning innovation systems not necessarily based on mining-operating countries. The United States, Japan, Republic of Korea, Germany, the United Kingdom and, lately, China are well-known technological hubs where innovation across sectors spurs more rapidly than the rest of the world (WIPO, 2018). These innovation systems – and those from other OECD economies – host innovative stakeholders from different industries that are likely to develop mining innovation. Many METS companies originate and conduct their R&D in countries that are not necessarily where they apply the technology, such as Japan, Switzerland or the Republic of Korea.
Undeniably, China, Japan, the United States, the Russian Federation and Germany were the largest contributors in volume to the recent mining innovation upsurge (Figure 2.11). The top ten economies account for roughly 90 percent of all mining technologies. Within these, China observes the highest increase during the last decade.

Figure 2.11 Mining innovation by top country of origin.
Contribution to the Mining Innovation Boom Did Not Come from the Usual Suspects
Despite China’s impressive growth in volume, this is not what explains the rapid increase in the world’s mining innovation relative to all innovation depicted in Figure 2.4. Indeed, China’s rapid innovation increase for all technologies outpaces its mining innovation trend.
This is because the concentration of absolute mining innovation tells very little about the countries’ technological specialization in mining. Many nations where mining operations are conducted may have a disproportionate amount of mining innovation compared to their overall innovation. Moreover, given different country sizes and propensities to patent, comparing overall levels of patenting activity between countries can be, to some extent, misleading about where the most specialized mining innovation may reside.
Looking at each countries’ mining patents as a share of the overall patents in that country, the picture begins to change (Figure 2.12). This graph shows that while China dominates mining patents in overall numbers, in terms of the share of China’s patents, mining patents is between 2 and 3 percent, and is only slightly larger than the share of mining patents in the United States, Brazil and France. In contrast, countries that have economies that are heavily reliant on the mining industry, such as Chile and South Africa, and to a lesser extent, Australia, Canada and the Russian Federation, have a much higher share of mining patents.

Figure 2.12 Mining patents share by country, selected countries.
In order to further normalize these effects, we use the relative specialization index (RSI), which indicates countries where mining innovation is more important than the average (Figure 2.13).Footnote 7 A positive RSI means that mining innovation is dominant compared to innovation in other industries, whereas a negative RSI indicates a country is not specialized in mining innovation.

Figure 2.13 Mining relative specialization index (RSI), selected countries.
It is not surprising that countries where mining represents a significant part of the economic activity are relatively specialized in mining innovation. Chile, South Africa, Australia, Canada, the Russian Federation and China are mining-producing economies where the share of mining innovation exceeds the world’s average. Brazil and India, however, are notable exceptions to this pattern. The United States, another top producing mining economy, has slightly negative specialization. While the relative ranking of countries did not change radically before and after the mining innovation surge, we do observe that the degree of specialization of many countries did change. This is also indicative of their contribution to the recent surge relative to all technologies.
In this respect, we observe that traditionally mining producing and specialized economies such as Chile, South Africa, the Russian Federation and China have diminished specialization in mining innovation; and, thus, these economies have not contributed to the recent relative upsurge. Australia and Canada, on the other hand, have increased their relative mining specialization, which implies that these contributed to the overall surge. Even if still not specialized in mining innovation, the United States and Brazil have also contributed to the recent relative boom. During the last decade, these economies decreased their negative relative specialization, becoming almost positive. Japan and India have continued to specialize outside of the mining domain, also contributing negatively to the recent relative surge.
As discussed previously, the increase of mining innovations related to exploration, transport and automation explains, in part, the recent surge (Figure 2.8). We now dig deeper to understand which countries contribute the most to these thriving subsectors (Figure 2.14). The first stylized fact is that mining subsector specialization within countries is fairly stable in rank, but the countries can vary substantially in their relative intensity.

Figure 2.14 RSI by mining sub-sector, selected countries.
Most of the increase in the exploration subsector is not coming from the traditionally specialized economies. Some specialized economies in exploration – namely China, the Russian Federation and the United States – diminished their relative specialization. China almost recorded a negative index after the surge. Australia and Chile increased their relative specialization in this subsector and are probably among the largest contributors to exploration booming relative to other sectors.
Among these economies, Australia was the only country that deepened its specialization in mining transport. While still not very specialized in transport, Australia was the only other selected country to improve its relative specialization in this subsector. Canada, Chile and China remain specialized in mining transport but have diminished their relative specialization. The Russian Federation, the Republic of Korea and the United States have been specializing even more outside of the transport domain.Footnote 8
Australia, Canada, Chile and the United States are more specialized in automation compared to lower-middle-income and upper-middle-income nations such as China, Brazil, Mexico and India. This is also the case in countries which are not particularly mining oriented, such as France, Finland and the Netherlands. This is also because mining automation innovation is concentrated in METS firms (96.8 percent) rather than mining firms. It seems that mining firms prefer to outsource this type of innovation. METS firms innovating in automation do not need to be located in mining countries. They can conduct their R&D abroad and then sell their technologies to operating miners. High-income countries have an advantage in high-tech industries favoring the development of automated technologies. In addition, higher-income economies producing mining output have stronger economic incentives to make use of automation technologies in order to mitigate higher labor costs.
These patterns only apply partially to the dynamics of automation specialization within these economies. Australia, the Republic of Korea and Brazil increased their relative specialization in automation in a remarkable fashion during the mining innovation booming period. In contrast, the Russian Federation and Chile’s specialization in automation reversed in a similar spectacular way. Canada still is fairly specialized in automation but lost some of its intensity during the last decade. The Russian Federation only deepened its lack of specialization in automation. Even if still not extremely specialized in automation, China improved its automation RSI substantially.
The selected economies are particularly weak in environment specialization. Only Chile shows a high positive RSI for environmental technologies, but declining during the last decade. However, most of these economies improved their specialization in the last decade. In particular, Australia deepened its environmental specialization. Conversely, Chile, the United States and the Russian Federation are the only ones in this sample that worsened their environmental specialization.Footnote 9
A Complex Mining Innovation Ecosystem
Companies and other stakeholders are accountable for the mining innovation boom. Established companies – both mining and METS – created about two-thirds of the mining-related technologies in our data. Individuals – likely on behalf of startup and micro-companies – originated almost a quarter of these technologies. Academic institutions produced the remaining technologies, where public research organizations (PROs) and universities generated 9 and 6 percent, respectively.
Companies and individuals mostly carried out mining innovation. However, in recent years, there has been a rise in the participation of universities in the innovation ecosystem (Figure 2.15). They were almost totally absent from the scene before the twenty-first century. This may be the result of the increasing number of collaborations between universities and companies. More and more mining firms finance university programs focused on mining studies to shape high-skilled human capital, for example, the collaboration between Vale and many universities in Brazil (Chapter 8); the historical collaboration between Noranda and McGill University in Canada (Chapter 11); or the success of Cooperative Research Centres in Australia (Chapter 12).

Figure 2.15 Number of mining patents families over the years by type of stakeholder.
In most cases, mining companies establishing collaboration with academia hired highly qualified human capital directly, creating channels for the development of innovations. This also explains why we observe very little co-patenting activity. In the period 1970–2015, only 4 percent of total mining patents had two or more applicants. This share has been constantly decreasing over time, from 9.3 percent in 1970 to almost 1 percent in 2015. Most of the collaboration activity relates to individuals (71.7 percent) and private companies (25.7 percent). PROs (1.7 percent) and universities (0.8 percent) rarely appear as co-applicants, despite the many above-mentioned collaborations with the private sector. This may be due to specific and reserved contractual agreements among the parties involved, which may assign the patent only to the private partner.
Within the academic sector, PROs have seen a comeback in the mining ecosystem in recent years. Historically, these institutions have been a large promoter of mining innovation from the mid-70s to the beginning of the 90s. They were particularly present in the Soviet Union, where 80 percent of PRO mining patents originated in the period 1970–1989. Since 1990, PRO innovation activity slowed down greatly until 2010. The fall of the Soviet Union largely explains this sudden drop of PRO patents. But many other state-funded research organizations in the West also closed or diminished their operations during the 1990s, such as the US Bureau of Mines in 1995 and the UK’s Warren Spring Laboratory in 1994. Accounting for 56 percent of PRO mining patents in the period 2000–15, China-based PROs explain at large their recent trend.
Although private companies are the largest contributor to mining technologies, only a small portion of mining and METS firms file for patents and METS firms are around 10 times more likely to file for patent protection than mining companies (Table 2.1). About 3.4 percent of METS firms file patents compared to only 0.4 percent of mining firms. Mining firms patent significantly less than firms in other sectors, such as pharmaceuticals (5.8 percent), chemical manufacturing (2.5 percent) and manufacturing of consumer electronics (5.5 percent). However, their patenting rate is still much higher than that observed for firms in agriculture (0.05 percent).
| Firm sector | Number of firms | ||||
|---|---|---|---|---|---|
| With patents | Without patents | ||||
| METS | 4,712 | 3.8% | 125,011 | 96.4% | |
| Coal | 174 | 0.3% | 49,897 | 99.7% | |
| Metal ore | 321 | 0.4% | 77,584 | 99.6% | |
| Mining | Nonmetallic mineral | 53 | 0.9% | 6,218 | 99.2% |
| Oil & Gas | 838 | 1.5% | 57,421 | 98.5% | |
| Quarrying | 649 | 0.3% | 192,086 | 99.7% | |
The fact that mining companies get exclusive operation rights as a result of exploration may partly explain this low. Firms finding new mineral deposits can obtain exclusive and time-limited rights over those resources in a manner similar to the patent system. Investments in exploration innovation may be fully appropriated with such exclusive rights without the need to get patent protection. This parallel may help explain the low number of mining firms with patents. However, mining firms file most of their mining technologies in the exploration subsector (Figure 2.16).
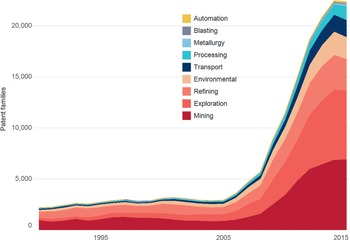
Figure 2.16 Mining Firms by technology, by earliest priority year.
Still, most of the patenting activity by mining firms is not related to mining technologies. An analysis of the WIPO technology fields shows that electrical machinery, apparatus and energy is the largest field for mining firm patents in non-mining technologies (Figure 2.17).Footnote 10

Figure 2.17 Patent families of mining firms by WIPO technology field.
2.4 Concluding Remarks
This chapter explored the recent boom in mining innovation. Even if an elusive target for typical innovation measurements, mining innovation has been booming for more than a decade. Australia, Canada, China, Europe and the United States concentrate the largest share of global innovation measured as mining R&D expenditures, exploration expenditures or mining technologies in patent data.
We then turned to the technological changes happening in the mining innovation supply chain structure and in the geography of innovation. For this purpose, we created a novel dataset which is employed in many chapters of this book. This data includes the patenting activity of mining firms and the mining-related patents not necessarily filed by these firms. We documented how mining technologies can spur on stakeholders other than mining-related firms and how mining firms can be very active beyond mining innovation.
Our analysis showed how mining innovation spurs on the mining production life cycle and value chain. In particular, recent mining innovation focused on exploration and refining technologies. However, some subsectors have contributed to the recent mining innovation uptick more than others. In particular, there has been a decrease in refining technologies shares in favor of exploration and transport technologies. We interpret these results as a direct consequence of the demand surge of mineral products in the same period. We also observe an increase in automation innovation in the mining sector. These trends are not new for the industry, which observed an increase in the 1990s and early 2000s. Nonetheless, we now observe a remarkable automation uptick.
The distribution of economies contributing to mining technologies does not correspond with the typical mining-producing ones. Only China and the United States lead both in mining output and innovation. Australia, Canada and Norway also offer a relatively balanced mining output and innovation. Other typical mining economies struggle to be present in the innovation spotlight. The Russian Federation, Brazil and Chile are probably the best among these, while other countries generate very limited innovation outcomes. Indeed, mining innovation is more likely to spur on functioning innovation systems not necessarily based on mining operation countries. Many developed economies not particularly relevant in mining production contribute greatly to global mining innovation. Japan, the Republic of Korea and many European economies are top among these.
Despite China’s impressive growth in volume, it added little to the rapid increase in the world’s mining innovation intensity, which has grown rapidly in all technologies. This was not only the case in China. Traditionally mining producing and specialized economies such as Chile, South Africa and the Russian Federation have all diminished their mining innovation specialization. Conversely, Australia, Canada, the United States and Brazil have increased their relative mining specialization, which also means they contributed more to the global mining innovation intensity surge.
Most of the increase in the exploration subsector is coming from the increase in specialization. Australia and Chile increased their relative specialization in this subsector and are probably among the largest contributors to the exploration boom relative to the other sectors. On mining transport, Brazil and Australia were the only countries improving their mining transport specialization. The United States, Canada and Australia are more specialized in automation compared to lower-middle-income and upper-middle-income nations. The selected economies are fairly weak in environment specialization.
Companies and other stakeholders are accountable for the mining innovation boom. Established mining and METS firms created about two-thirds of the mining-related technologies in our data. Academic institutions produced the remaining technologies, where public research organizations (PROs) and universities generated 9 and 6 percent, respectively. Although private companies beingare the largest contributor of mining technologies, only a small portion of mining and METS firms file for patents.


 Open access