Running a Debugger in a Jupyter Notebook
This page discusses using a debugger in a Jupyter notebook, as mentioned in Section 11.2 of the textbook. The breakpoint and calling stack discussions also work when running Python in a terminal window. In that environment, leave out the IPython/Jupyter magic line (which is unrecognized in a terminal window).
Running the Code Using a Debugger
Let us say we want to find out what is going on inside our function because there is a bug, or because it is crashing. In a Jupyter notebook, we can use the %debug magic to step through the function and look at what code is running. %debug triggers the default Python debugger pdb.
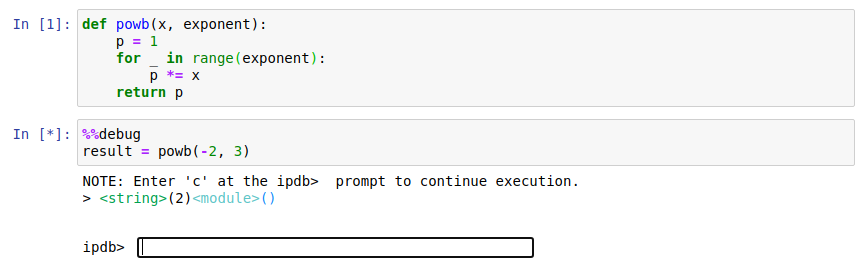
Thus, if we want to debug code that involves calling the function powb (and saves the return value to the variable result), our Jupyter cell would look like this:
%%debug
result = powb(-2, 3)
When we run the above code, the cell enters debug mode, and prompts the user to interactively enter in a command:
A full list of debugging commands are available here. A few are [1]:
l: List the code around the current linepexpr: Print out to the screen the expression exprq: Quit the debugging sessions: Execute a single line of code
Demonstrating below:
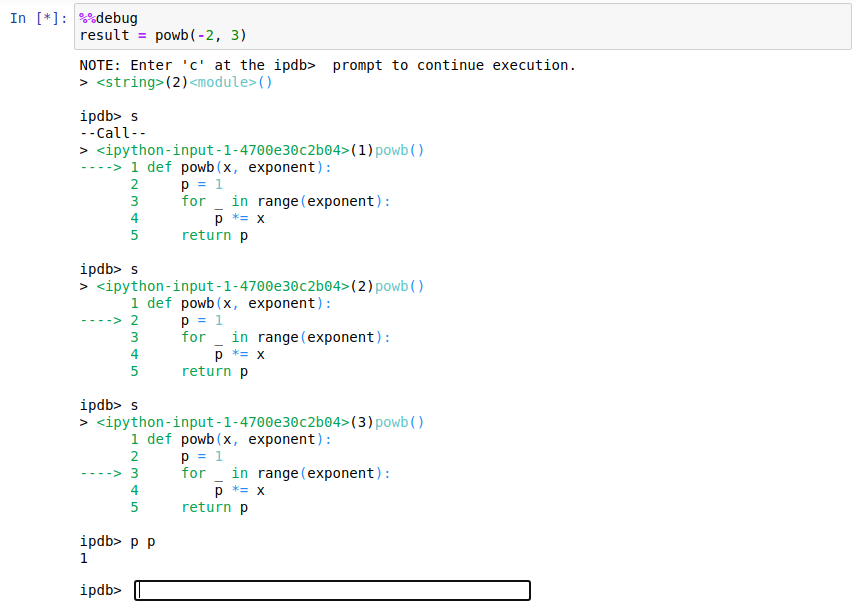
In the above example, we step through three lines of code then print the value of the variable p, which at that point equals 1. See here for a really great tutorial.
Putting Breakpoints Into the Code
As mentioned in Section 11.2 of the textbook, breakpoints are flags we can put into a program that tell the debugger where to stop execution, to allow us to inspect what the variables are at that time.
To set a breakpoint, we first have to import the pdb module. The set_trace function places the breakpoint. Thus, if we had the following code defining the function powc:
import pdb
def powc(x, exponent):
p = 1
for _ in range(exponent):
p *= x
pdb.set_trace()
return p
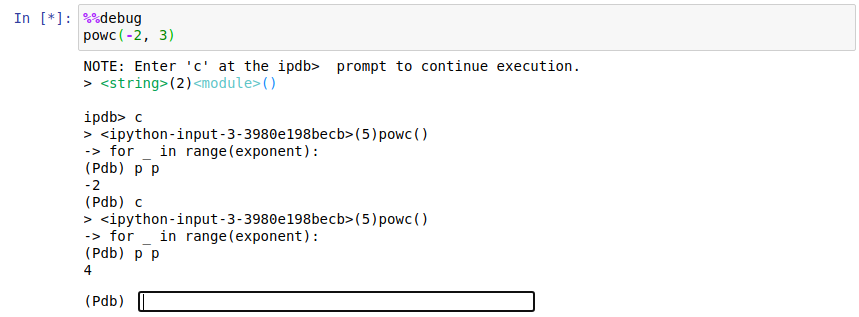
a breakpoint would be set after the p *= x line. In Python 3.7+, there is the built-in breakpoint function that we can use in place of importing pdb and using set_trace.
The the pdb c command executes until a breakpoint occurs (either for the first time or repeated times). Once we hit a breakpoint, we can use the pdb p command to find out what the states of the variables are. Here is an example of looping through the above loop twice and printing out the value of p each time:
Moving Up and Down the Calling Stack
The debugger in Jupyter can also move up and down the calling stack using the d (down) and u (up) commands [1]. The calling stack is the “tree” describing how functions call other functions. We can think of the calling tree as being a set of Russian nesting dolls, where a smaller doll inside a bigger doll is a function being called by the bigger doll. The smallest doll inside the set of dolls is the lowest level of the calling stack.
Going up the calling stack (or stack trace) means moving to the level of the parent of the current function. Going down the calling stack means moving in the opposite direction from going up. If we are at the lowest level of the stack trace, we will receive the message:
*** Newest frame
which tells us we are at the lowest level in the calling stack.
The pdb debugger has other features to enable us to run and debug code in Jupyter and the terminal window (and other environments). See the web page as well as the in-interpreter pdb help (also a reference for this page) for details.
Reference
[1] The Python Debugger: Debugger Commands (accessed December 16, 2020).