

A shared expectation among both pundits and scholars is that more inequality will be met with more demand for redistribution. Pundits couch this expectation in moral terms: while Left-leaning pundits expect voters to be outraged by “unfair” income differences,Footnote 1 Right-leaning commentators dispute the unfairness charge and expect envy and resentment to drive rising demand for redistribution.Footnote 2 For scholars in political economy, expectations of rising support for redistribution often have little to do with the type of fairness concerns voiced by pundits. These expectations are rooted instead in a set of assumptions regarding human behavior (people prefer more disposable income than less), the redistributive design of the welfare state, and people’s extensive knowledge of the latter’s implications for their own pocketbook (Meltzer and Richard Reference Meltzer and Richard1981). Under these assumptions, as inequality increases, so does the share of voters who stand to benefit from redistribution and who update their policy preferences in line with their material self-interest (e.g., see Lupu and Pontusson, this volume).Footnote 3 This chapter demonstrates how incorporating the type of fairness concerns voiced by pundits into existing political economy models can help explain the absence of a redistributive policy response to rising inequality, despite expectations of growing support for such policy.
An important step in this demonstration is conceptualizing and operationalizing “fairness.” I define fairness reasoning as the thought process through which individuals act as if a third-party judge ruling on the fairness of a given situation and acting to maximize fairness accordingly. In this case, maximizing fairness means expressing support for a policy that moves the status quo closer to what is prescribed by shared norms of fairness. Based on this definition, to study fairness reasoning, researchers first need to identify the finite set of fairness norms widely agreed upon by all members of a given polity. Having done so, they can then measure people’s beliefs about the extent to which the status quo deviates from what these norms prescribe, fairness beliefs for short. Fairness beliefs I show introduce a wedge between changes in the distribution of market income and support for redistribution, explaining why rising income inequality has a less-than-straightforward impact on attitudes toward redistributive policies.
This chapter unfolds in four sections. First, I argue that fairness reasoning, as defined earlier, is the individual-level manifestation of a moral system. I describe the moral system underpinning redistributive institutions and policies in Western democracies and identify the two key norms of fairness that characterize it. I show that these two norms receive broad support. In sections 2 and 3, I turn to fairness beliefs. Fairness beliefs function as an anchoring proto-ideology, a mental map helping people interpret a complicated and uncertain world and pick redistributive policies that increase the fairness of the status quo. As I show in section 2, the conceptualization of fairness reasoning proposed in this chapter suggests a mental map that is very different from the one hypothesized in existing work on the topic. In section 3, I propose a friendly horse race between existing work and the conceptualization presented in this chapter: the evidence overwhelmingly supports the latter. The last section discusses implications for our understanding of the demand side of redistributive politics in times of rising inequality.
Fairness Reasoning, Moral Systems, and Social Order
Studies across the social sciences show that the impulse to do what is collectively recognized as the “right thing” is central to human cognition. This impulse is the individual-level observable manifestation of a moral system, that is, a social technology that helps regulate the constant toggle between cooperation and opportunistic behavior characteristic of social life. This moral system contributes to social orderFootnote 4 and the provision of stable institutional solutions to social dilemmas (Baumard Reference Baumard2016; Binmore Reference Binmore1994; Gintis et al. Reference Gintis, Bowles, Boyd and Fehr2005; Graham, Haidt, and Nosek Reference Graham, Haidt and Nosek2009; Tomasello Reference Tomasello2016). In this section, I unpack the moral system underpinning redistributive institutions in Western democracies. In doing so, I will provide a more precise definition of a moral system and sketch its role in the provision of social order and large-scale cooperation.
Famous examples of moral systems are discussed in the work of Margaret Levi on taxation and mass mobilization as well as that of Eleonor Ostrom on the monitoring of common pool resources (Levi Reference Levi1991; Ostrom Reference Ostrom1998). Given their centrality, not including fairness reasoning in workhorse models of redistributive politics represents a significant oversight. This is especially true when it comes to forming an opinion on redistributive policies: for most people, stakes are too low or too uncertain for selfish material concerns to distract them from doing the fair thing. First, because social programs are “locked-in” (Pierson Reference Pierson1996), policy changes tend to be incremental, affecting existing institutions only on the margin, often with delayed effects, which are themselves hidden by deficit spending and complicated budget arbitrations. Fearing a backlash from affected constituents, politicians have only limited incentives to provide clarifying information on a policy’s diffuse pocketbook implications. Second, in representative democracies, expressing an opinion on a given policy, most often in the context of a survey, is itself a low-stakes task. In such context, the assumption that voters are fully informed selfish income maximizers is heroic at best.Footnote 5 Instead, most people satisfice, that is, settle on a “good enough” policy position using cognitively less demanding decision heuristics that provide satisfactory outcomes. Fairness reasoning is one form of satisficing. It manifests itself as a simple decision rule: “if fair then support,” “if unfair then oppose.” Understanding how people evaluate a policy change as fair or not requires first unpacking the moral system underpinning redistributive institutions in postindustrial democracies.
In Western democracies, the allocation of economic resources is affected by a complex bundle of institutions and policies. A central distinction is the one made between the “market economy” on the one hand and the “welfare state” on the other. The market economy generates income that is taxed to fund the social transfers distributed by the welfare state. The welfare state organizes social solidarity, that is, the collective endeavor through which individuals are insured against life’s main risks (unemployment, old age, illnesses…).Footnote 6 Governments can affect the distribution of income in a given society through three channels: (1) predistribution policies, which affect how market income is generated and distributed, (2) taxation policies, which affect how much market income people get to keep, and (3) changes to the design of the welfare state, which affect the extent to which social insurance is redistributive. With regards to the latter, governments can increase the generosity of means-tested benefits, tweak the relative mix of earnings-dependent and nonearnings-dependent benefits (more or less “giving”) and change the legal definition of who is included in the welfare state (more or less “sharing”). Institutional stability is more likely when a majority finds the existing institutional bundle “fair,” or at least “fair enough” according to shared norms of fairness. Institutional change is more likely when a majority perceives the status quo as unfair. What exactly does “fair” mean in this context? Or to put it differently, what are the norms of fairness people rely on to justify their support or opposition to status quo-changing policy proposals, whether related to predistribution (1), income taxation (2), or social policy design (3)?
A dominant line of research emphasizes the following allocation principle: a fair allocation is one in which economic rewards are related to effort (i.e., “effort pays”). In the words of Benabou and Tirole (2006), support for income redistribution is affected by the views people hold about “the causes of wealth and poverty, the extent to which individuals are responsible for their own fate, and the long-run rewards to personal effort.” This common approach to fairness reasoning in Western democracies does not explicitly engage with the market economy/welfare state dualism mentioned earlier. Yet, as I argue next, the manufacturing of consent is achieved very differently depending on the institutional realm under consideration.
In the market economy, mass consent implies the shared agreement that the status quo abides by what the proportionality norm prescribes, namely that rewards be proportional to merit, itself a combination of personal decisions as a free agent, individual work ethic, acquired skills, and innate talent. Milton Friedman himself emphasized its centrality to the market economy’s system of justification: “payment in accordance to product,” he writes, is part of the “basic core of value judgments that are unthinkingly accepted by the great bulk of [a society’s] members” and enables “resources to be allocated efficiently without compulsion” (p. 167). This is the norm captured by the “does effort pays?” literature. But it is only half of the story: what people experience as actors in the market economy is separate from what they experience as stakeholders in a resource pooling effort embodied by the welfare state. One key difference is the importance of free-riding concerns: while mostly irrelevant for thinking about how economic resources are allocated by the market economy, they are central to how people think about how economic resources are allocated by the welfare state. This suggests the existence of a second norm, the reciprocity norm, which prescribes that all members of a group contribute to the collective effort and that free riding does not go unpunished.
Numerous studies have documented the importance of the reciprocity norm when people are engaged in joint cooperative endeavors (Axelrod Reference Axelrod1980; Ostrom and Walker Reference Ostrom and Walker2003). This norm is both simple to describe and surprisingly difficult to theorize. Simply stated, the norm turns people into conditional cooperators. People willingly contribute to a collective endeavor if they feel others are not free riding (positive reciprocity). They punish free riders by either ceasing to cooperate or by excluding them from accessing the goods generated by cooperation (negative reciprocity). Behavior attached to the reciprocity norm is thus inherently two-faceted and can be presented in one of two lights. The more positive light casts it as a form of conditional altruism: people’s default position is to help others unless others are “antisocial” (Fong, Bowles, and Gintis Reference Fong, Bowles, Gintis, Kolm and Mercier Ythier2006; Henrich et al. Reference Henrich, Robert Boyd, Colin Camerer, Gintis and McElreath2001). Viewed in a negative light, it is a form of conditional punishment: people’s default position is to deny help to others unless they are prosocial.
If the proportionality and reciprocity norms are indeed manifestations of consent-inducing moral systems, agreement with these two norms should be quasi-universal. Specifically, people applying the same norm to the same situation will unanimously agree on whether or not this situation is fair and in need of corrective intervention. Such unanimity is routinely observed in experimental settings where the features of a given situation are carefully explained and communicated to participants (Cappelen et al. Reference Cappelen, Konow, Sørensen and Tungodden2013; Konow Reference Konow2003; Petersen Reference Petersen2012). It is unfortunately beyond the scope of this chapter to review this literature in full: the interested reader can turn to the summary of this evidence provided in Cavaillé Reference Cavaillé2023 (Chapter 2). Another type of evidence comes from cross-national surveys. The World Value Survey, for example, includes items that plausibly measure agreement with the proportionality norm: “Imagine two secretaries, of the same age, doing practically the same job. One finds out that the other earns considerably more than she does. The better paid secretary, however, is quicker, more efficient, and more reliable at her job. In your opinion, is it fair or not fair that one secretary is paid more than the other?”Footnote 7 This question holds constant attributes one is not responsible for (age, tasks being given to accomplish) and only varies factors one has control over (i.e., effort). In all countries, more than four out of five respondents find it fair that one secretary is paid more than the other. Relatedly, the 2008 wave of the ESS asked respondents whether they agreed with the statement that “(a) society is fair when hard-working people earn more than others.” On average over 80 percent of respondents agree with this statement, with a high of 92 percent in Austria and a low of 70 percent in the Czech Republic.
Unfortunately, survey items documenting widely shared agreement with the reciprocity norm in postindustrial democracies are not available. One exception is a recent set of studies by Michael Bang Petersen and coauthors focusing on two most-different cases, namely the United States and Denmark. In one study, Petersen et al. (Reference Petersen, Sznycer, Cosmides and Tooby2012) randomly assign representative samples of American and Danish respondents to one of three treatment conditions. Respondents in all three groups are presented with a male welfare recipient and then asked: “To what extent do you disagree or agree that the eligibility requirements for social welfare should be tightened for persons like him?” In one treatment, no cues are provided about the recipient’s labor market attachment and effort. In another treatment condition, respondents are told that he “never had a regular job” and that, while “he is fit and healthy,” he is not “motivated to get a job.” In a third treatment condition, respondents are told that the recipient “always had a regular job” but was affected by a “work-related injury” and is “motivated to get back to work again.” Assuming individuals in both countries reason in similar ways based on the reciprocity norm, there should be little to no difference in how respondents treat the “deserving” recipient relative to the “undeserving” one. In line with expectations, the authors find that, “despite decades of exposure to different cultures and welfare institutions, two sentences of information (…) make welfare support across the U.S. and Scandinavian samples substantially and statistically indistinguishable.”
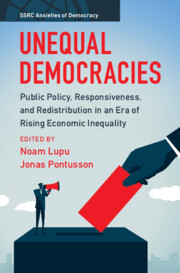
To sum up, the existence of moral systems compel people to behave fairly, that is, justify one’s actions (and policy preferences) according to shared norms of fairness. The proportionality norm is most often mobilized when evaluating the fairness of market outcomes and policies that interfere with such outcomes. It constrains envy and resentment from those who have “less than others” and promotes consent over policies that take from those who have more than others. The reciprocity norm is most often mobilized when evaluating the fairness of redistributive social insurance. It helps a group cooperate over the provision of social solidarity and promotes consent over design features that make social solidarity more or less redistributive.Footnote 8 Note that the distinction between deviations from what the proportionality norm prescribes on the one hand, and deviations from what the reciprocity norm prescribes on the other is partly obscured by the generic terms available to discuss the fairness of a given situation, and relatedly the fairness of the status quo. Specifically, two outcomes can be both judged as fair or unfair, with each evaluation referring to different norms of fairness. Relatedly, the same concept of desert or deservingness can apply to very different fairness judgments as illustrated in Figure 10.1.
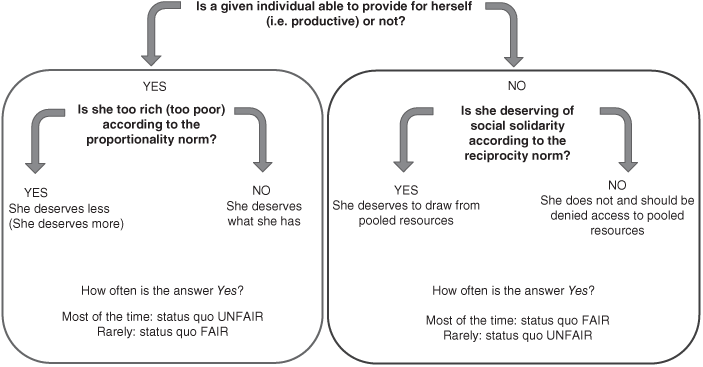
Figure 10.1 What is fair? Who is deserving?
In the realm of mass attitudes toward redistributive social policies, behaving fairly in line with the proportionality norm will mean, for example, opposing (supporting) high taxes because differences in market income (do not) reflect differences in effort and talent. Behaving fairly in line with the reciprocity norm will lead some to oppose social spending cuts because it unfairly affects “deserving” cooperators. Others, in contrast, will support cuts to programs that unfairly reward free riders over those who, in contrast, “carry their weight.” This implies that people rely on prior knowledge regarding the status quo’s defining features. Put differently, they hold empirical beliefs about the nature of the status quo, specifically about the prevalence of deviations from what norms of fairness prescribe (see Figure 10.1). I turn to this point next.
Fairness Beliefs and Demand for Redistribution
Moral systems help promote both stability (consent) and change (dissent). Stability is more likely when enough individuals (1) share the same understanding of what is fair and (2) share the perception that the status quo is fair according to this definition. Change is more likely when enough individuals (1) share the same understanding of what is fair and (2) share the perception that the status quo is unfair according to this definition.Footnote 9 In other words, the existence of a stabilizing moral system implies not only that people agree on shared norms of fairness (what ought to be) but also that people hold beliefs about the fairness of the status quo (beliefs about what is). Yet, while the existence of a stabilizing moral system implies the existence of fairness beliefs, it does not imply that people hold the same set of beliefs. Put differently, agreement on what ought to be does not imply agreement on what is. Indeed, whether a redistributive system is best described as stable (a majority agrees that the status quo is fair), ripe for change (a majority agrees that the status quo is unfair), or a mix of both is an empirical question: moral systems are a social technology that fosters social order, they do not deterministically induce it.
From individuals’ perspective, fairness beliefs function as an anchoring proto-ideology, a mental map helping people interpret a complicated and uncertain world and pick redistributive policies that increase the fairness of the status quo. This suggests that attitudes toward redistributive policies are structured in ways that reflect this mental map. To investigate these empirical patterns, I proceed through a “three-cornered fight” among (1) existing approaches to fairness reasoning (the “does effort pay?” literature), (2) my own framework, and (3) the available data (Hall Reference Hall2006: 27). I start by showing that the argument presented in this chapter suggests a mental map that is very different from the one hypothesized in existing work on the topic. I then show that the evidence overwhelmingly supports the former.
Fairness Reasoning and Support for Redistribution: State of the Art
The previously mentioned “does effort pay?” literature argues that support for income redistribution is affected by the views people hold about “the causes of wealth and poverty, the extent to which individuals are responsible for their own fate, and the long-run rewards to personal effort” (Bénabou and Tirole Reference Bénabou and Tirole2006). If people are rich (poor) for reasons out of their own control, then effort does not pay, income differences are unfair and income redistribution is justified and even fairness-maximizing. In the words of Fong (Reference Fong2001), “the extent to which people control their own fate and ultimately get their just deserts are first-order determinants of attitudes toward inequality and redistribution, even “swamping the effects of own income and education.”
First, a few words on how the literature has conceptualized and measured support for income redistribution, or demand for redistribution for short. One survey item, identified in this chapter as “the traditional redistribution item,” has become researchers’ go to for measuring individual-level differences in support for income redistribution. It asks respondents whether they agree with a version of the following statement: “the government should redistribute income from the better-off to those who are least well-off.” This survey item is also one of the few items that has been asked repeatedly over time in cross-national surveys. As often happens when researchers are constrained by past data collection decisions, this measurement tool has shaped how researchers conceptualize the dependent variable: support for redistribution is now commonly defined as agreement with the policy principle that governments should redistribute income from the haves to the have nots.
As previously discussed, in practice, redistribution occurs through a bundle of heterogeneous policies that affect individuals’ material conditions by taking (e.g., through income or payroll taxes) or not taking (e.g., tax credits) on the one hand, giving more or giving less (e.g., in-cash or in-kind benefits) and sharing (e.g., universal access to healthcare in Great Britain) and not sharing (e.g., benefit targeting as with Medicare in the United States). Under that definition, understanding mass support for redistribution implies understanding how people answer not only the traditional redistribution question but also questions such as:
Should the government financially support those who cannot provide a decent living for themselves? How generous should this support be, and who should pay for it?
Should healthcare be the same for all, irrespective of income, or is a residual system providing basic services enough?
Are taxes too progressive? Not progressive enough?
Can tax cuts come at the expense of social services? If so, should services that benefit the worse off be protected from such cuts?
Are social programs and the taxes that fund them too large? not large enough?
A common approach in the literature is to look for (and usually find) a latent variable that shapes the answers to most, if not all, of the questions listed above. This latent dimension is often described as capturing left-right preferences on “economic issues,” “redistributive issues,” or “government involvement in the economy” (Ansolabehere, Rodden and Snyder Reference Ansolabehere, Rodden and Snyder2008).Footnote 10
These two measurement strategies (the traditional redistribution item and the multi-item latent dimension) are often assumed to capture the same thing, that is, the extent to which people are inclined to support policies designed to take from those who have more to help those who have less, which Alesina and Giuliano describe as one of “the most important dividing line[s] (…)” in democratic politics (Alesina and Giuliano Reference Alesina, Giuliano, Benhabib, Bisin and Jackson2011: 94). According to the “does effort pay?” line of work, one’s position on this dividing line is well predicted by one’s beliefs about the role of effort for explaining both wealth and poverty. This perspective is sketched on the left-hand side of Figure 10.2.
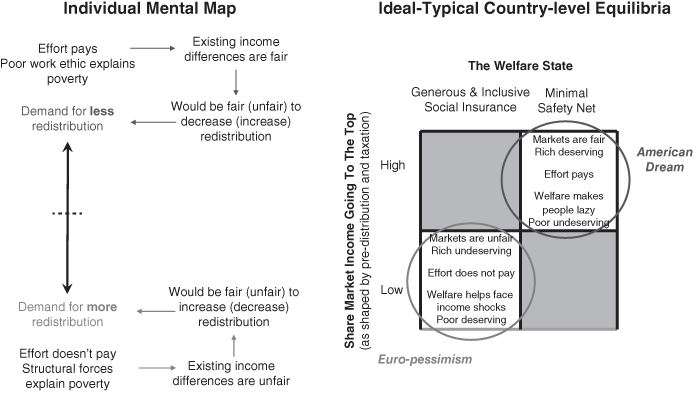
Figure 10.2 Fairness reasoning and demand for redistribution: unidimensional approach
According to Alesina and Angeletos (Reference Alesina and Angeletos2005; see also Bénabou and Tirole Reference Bénabou and Tirole2006), the relationship between demand for redistribution and the belief that effort pays also helps explain why countries differ in their work-to-leisure ratio, levels of income inequality, as well as the share of GDP redistributed through taxes and social spending. Specifically, beliefs, policy preferences, behavior, and institutions all combine to produce a stable outcome, or social equilibrium. Alesina and Angeletos (Reference Alesina and Angeletos2005) identify two ideal-typical equilibria: an American Dream equilibrium and a Euro-pessimistic equilibrium. In the American Dream equilibrium, people believe that effort pays and oppose predistribution policies, progressive taxation, and the redistributive features of social insurance because these policies undermine fairness. Predistribution policies are unwarranted because economic institutions already reward effort. Similarly, taxing those who earn more market income is unfair given that they have worked harder and, consequently, deserve to keep it. Finally, social insurance programs designed to redistribute to the chronically poor and unemployed are also unfair given that they transfer resources to people who prefer living off benefits than trying their best to improve their plight. In this equilibrium, the poor and unemployed are castigated as lazy, income redistribution is limited to offering a charity-like minimal income floor and total effort (annual hours worked) is high. As a result, income inequality is also high.
In the Euro-pessimistic equilibrium, people believe that “effort does not pay” and, consequently, are more supportive of predistribution policies, progressive taxation, and social insurance that is generous and inclusive because these policies help maximize fairness. Specifically, predistribution policies help correct unbalanced labor relations, progressive taxation is fair because it affects the “undeserving” rich and redistributive social insurance helps recipients who, despite efforts to escape poverty, fail to do so because of an unfair “economic system.” In this equilibrium, the poor are less likely to be stigmatized as lazy, income redistribution is extensive, and total effort is comparatively lower than in the American Dream equilibrium. As a result, income inequality is also lower. These two equilibria are summarized in Figure 10.2 (right-hand side). In the next section, I contrast this conceptual framework to the one presented in this chapter.
From One to Two Dimensions
I have argued that what counts as a fair allocation of market income is different from what counts as a fair allocation of social benefits, meaning that beliefs about the fairness of the former can differ from beliefs about the fairness of the latter. The reason for this disconnect extends beyond the existence of two norms instead of one and also follow from the relationship between fairness beliefs and status. People derive status from being “productive members” of society. The distinction between a market economy and the welfare state suggests at least two distinct understandings of “productive.” One draws on an individual’s market value made visible to all through one’s market income: the higher the income, the higher the status. People tend to form proportionality beliefs that make them feel good about their own income level: if high, then they are more likely to believe that effort pays, if low, then they are more likely to think that it does not (Hvidberg et al. Reference Hvidberg, Kreiner and Stantcheva2020). The other understanding of “productive,” overlooked by the “effort pays” literature, draws on an individual’s membership in the welfare state, a resource pool of historical scope. In this case, being a productive member involves “carrying one’s weight” and not free riding on shared resources. Being a productive member is also status-enhancing because of what the members of the pool “owe to one another and to no one else, or to no one else in the same degree,” namely welfare. This implies a distinction between high(er) status members who can access welfare and lower status strangers who cannot. Such distinction makes little sense in a market economy, an “indifferent association, determined solely by personal preference and market capacity” and “open to whoever chooses to come in” (Walzer Reference Walzer1983). People tend to form reciprocity beliefs that make them feel good about being themselves as a deserving member of this resource pooling endeavor. This implies a distinction between oneself and the undeserving other, which can lead to overestimating the prevalence of free riding, even among those most likely to rely on social benefits (Lamont Reference Lamont2002). It can also lead to distorted perceptions of immigrants as welfare shoppers and the perception that access that is not conditional on full membership as inherently unfair.Footnote 11 In other words, there are no reason to expect a priori that status-boosting proportionality beliefs align with status-boosting reciprocity beliefs as hypothesized by the “does effort pay?” literature.
As a result of this disconnect between proportionality and reciprocity beliefs, for some people, fairness reasoning also implies a disconnect between attitudes toward policies that take market income from those who have more (e.g., predistribution and taxation policies) and attitudes toward policies that give to people who can no longer provide for themselves (e.g., generous and inclusive social insurance). As a shorthand, I will call the first type of policy redistribution from policies and the second type redistribution to policies. Below, I provide examples of both types of policies:
Redistribution from Policies
New antitrust legislation or regulations that increase drivers’ bargaining power vis-a-vis a platform like Uber
A progressive wealth tax or closing tax loopholes that benefit rich corporations
A cap on CEO salary
Equal-pay-for-equal-work reforms
Redistribution to Policies
Increase (decrease) in spending on social programs that maintain the living standards of the able-bodied unemployed
Making access to benefits conditional on past contributions and/or on length of residency (if immigrant)
Extending existing generous policies (healthcare, unemployment insurance, pensions) to previously excluded individuals with weak labor market attachment
Because of fairness reasoning, attitudes toward policies that affect the distribution of market income on the one hand can differ from attitudes toward policies that affect the redistributive features of social insurance on the other. This perspective, sketched on the left-hand side of Figure 10.3, implies that individuals sort across four ideal-typical proto-ideological profiles: (1) consistently pro-redistribution (bottom-left quadrant), (2) consistently antiredistribution (top-right quadrant), (3) in favor of more generous redistribution to but skeptical of more redistribution from (top-left quadrant), and (4) inclined to support more redistribution from while opposed to more redistribution to (bottom-right quadrant).
Figure 10.3 Fairness reasoning and demand for redistribution: two-dimensional approach
This two-dimensional conceptualization of demand for redistribution stands in contrast to the mainstream unidimensional conceptualization of demand for redistribution and fairness reasoning sketched on the left-hand side of Figure 10.2. The latter implicitly assumes that proportionality and reciprocity beliefs reinforce each other: the belief that the world is fair (unfair) according to the proportionality norm goes alongside the belief that the world is unfair (fair) according to the reciprocity norm. Specifically, if effort pays, then market income is distributed fairly and net beneficiaries of social transfers are free riders who are not trying hard enough. Conversely, if effort does not pay, income differences are unfair and net beneficiaries cannot be blamed for a situation they cannot control. Relatedly, if the rich are deserving (undeserving) of their high earnings and should not (should) be taxed, then the poor are deserving (undeserving) of their plight and should not (should) be helped. In other words, in this framework, fairness reasoning contributes to what scholars call “issue constraint” (Baldassarri and Gelman Reference Baldassarri and Gelman2008; Converse Reference Converse2006), that is, ideological consistency across beliefs and policy preferences within a given issue area. In contrast, I hypothesize that institutional dualism, as well as free riding and membership concerns that are uniquely salient to the welfare state, imply a disconnect between proportionality and reciprocity beliefs.
Relatedly, the existence of two norms of fairness or two separate institutional spheres suggests not two but four ideal-typical social equilibria (right-hand side of Figure 10.3). To the high redistribution and low redistribution equilibria hypothesized by the “does effort pay?” literature (top-right and bottom-left corners), I add two other combinations: one that limits income inequality at the top but fails to offer generous social insurance cover for the poor and the unemployed (bottom-right corner) and another that does not affect top income inequality but nevertheless engages in large risk pooling through universal and generous social insurance (top-left quadrant). This is summarized on the right-hand side of Figure 10.3.
In the remainder of this chapter, I use survey data to examine which of the unidimensional or two-dimensional conceptualizations of fairness reasoning and demand for redistribution provides the best fit, focusing first on individual-level mental maps and next on country-level differences in support for redistribution to and redistribution from.
Evidence for a Two-Dimensional Mental Map
Because people carry a diverse set of considerations regarding the fairness of the status quo, using more than one survey item is necessary to better differentiate individuals holding mostly “status quo unfair” considerations from people holding mostly “status quo fair” considerations. To proxy for an individual’s proportionality beliefs, researchers can rely on at least three types of survey items. A first type includes items used by the “does effort pay?” literature. Respondents are asked to what extent they believe that economic institutions reward talent and effort. These items need to be complemented with questions asking about the prevalence of norm-violating/conforming outcomes and behaviors. Indeed, the goal is to measure not only whether one believes that effort pays but also whether one believes that effort pays for most people, most of the time. A third type of item directly elicits respondents’ perceptions of the size of the disconnect between existing income differences (what is) and fair income differences (what ought to be).Footnote 12 Below, I provide example of survey items that can be used to measure proportionality beliefs:Footnote 13
Fairness of Market Institutions
“In COUNTRY, people get rewarded for their intelligence and skill. Agree/disagree?” ***
“In COUNTRY, people have equal opportunities to get ahead. Agree/disagree?” ***
“In COUNTRY, with hard work and a bit of luck most people can succeed financially. Agree/disagree?”
“The stock market is mostly there to help rich people get richer. Agree/disagree?”
“The economic system mostly benefits a privileged minority. Agree/disagree?”
Prevalence of Norm-Violating Outcomes
“In your opinion, what share of rich (poor) people are rich (poor) for reason that have nothing to do with how hard they work? All/most/some/none”
“For people born in a poor (rich) family, hard work leads to economic success most of the time/some of the time/rarely/never?” **
“What share of people born in [COUNTRY] in a [POOR/RICH/MIDDLE CLASS] family get a fair shot at life? All/most/some/none” ***
Fairness of the Income Distribution
“What is the income difference between a janitor/bricklayer and a doctor/CEO?” “In your opinion, should this difference be larger/smaller/stay the same?” ***
“Are differences in market income too large/too small/about right?” ***
In the case of the reciprocity norm, norm violation takes the form of people free riding on the common effort. To measure reciprocity beliefs, researchers can ask respondents what they think about benefit recipients’ tendency to cheat “the system” and their perceptions of the system’s ability to successfully identify cheats. Also important are people’s priors regarding how others behave when confronted with the option to free ride on shared resources, something economists like to call “moral hazard.” Below, I provide example of three types of survey items that can be used to measure reciprocity beliefs:Footnote 14
Prevalence of Free Riders in the Recipient Population
“Most unemployed people are trying hard to find a job. Agree/disagree?” ***
“People on benefits do not really have a choice. Agree/disagree?”
Failure to Identify Free Riders
“What share of social benefit cheats are successfully identified? Most/some/only a few/none” ***
“How often does welfare go to people who do not really deserve it? Most of the time/some of the time/rarely” ***
“What share of people who qualify are wrongly denied benefits? A majority/some/only a few/none” ***
Human Nature and Moral Hazard
“Social benefits are too generous and make people lazy?” ***
“To what extent can others be trusted to not abuse and cheat the system? Most of the time/sometime/rarely/never” ***
With enough items similar to those listed earlier, alongside items asking about redistribution from and redistribution to policies, I can directly test which of the two hypothesized mental maps best fits the data using both exploratory and confirmatory factor analysis. To the best of my knowledge, the British Social Attitude Survey (BSAS) is the only representative survey that includes both proportionality and reciprocity items alongside redistribution from and redistribution to policy items. Using the 2016 wave of the BSAS, I examine whether proportionality beliefs and redistribution from policy items load on the same latent factor while reciprocity beliefs and redistribution to policy items load on a separate, only weakly correlated factor.Footnote 15 If the unidimensional framework better fits the data, then all items will load on the same latent factor, with the latter approximating the latent left-right economic dimension often described in the existing literature. Alternatively, items might load on separate but highly correlated factors. Because cross-national surveys do not ask the same respondents about both reciprocity and proportionality beliefs, I cannot repeat this analysis in countries beyond Great Britain. Instead, I follow alternative empirical strategies (described in more detail later) designed to best leverage the set of items available in the cross-national European Social Survey (ESS). When combined, these tests provide additional evidence that the patterns uncovered in the British context are not unique to this country.
Moving from the individual to the country level, I combine data from the ESS and the International Social Survey Programme (ISSP) and examine whether, in line with the unidimensional approach, countries that find it fair (unfair) to increase redistribution from the better off as prescribed by the proportionality norm also find it fair (unfair) to increase redistribution to the worse off as prescribed by the reciprocity norm. Against this expectation, I expect two additional clusters of countries to emerge: countries skeptical of more redistribution from policies but supportive of extending redistribution to on the one hand, and countries enthusiastic about more redistribution from but opposed to increasing redistribution to on the other.
Individual-Level Results
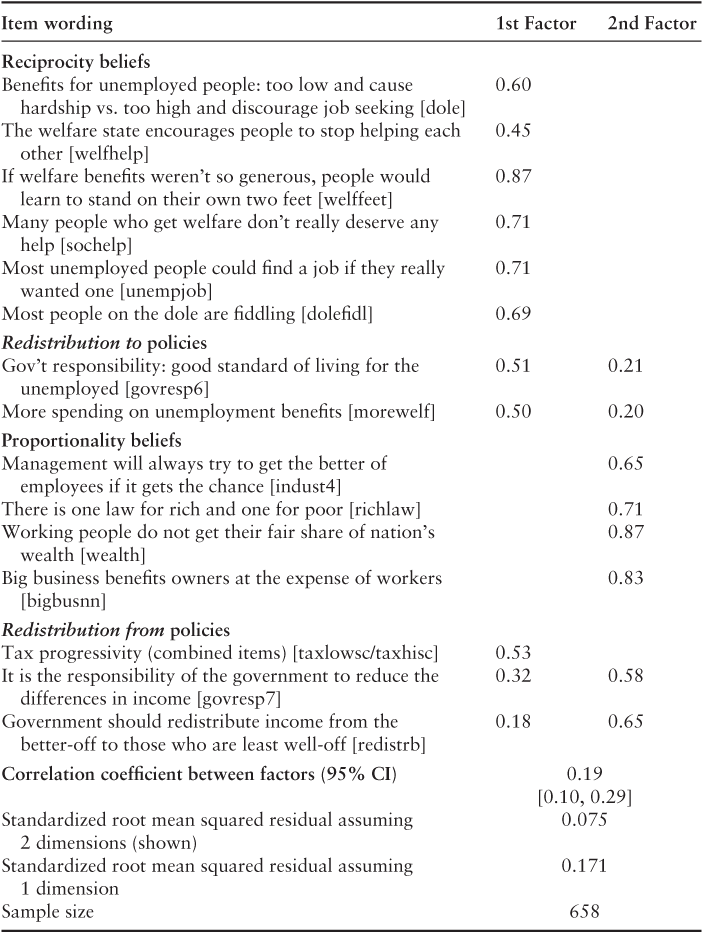
Since the late 1980s, the BSAS has repeatedly asked a battery of items aimed at measuring core political beliefs regarding income redistribution, labor relations, income inequality, social insurance, unemployment insurance, and welfare recipients (Evans, Heath, and Lalljee Reference Evans, Heath and Lalljee1996). When combined into multiple-item scales, these items have helped researchers place respondents on a “socialist versus laissez-faire – or left-right – dimension” as well as a “prowelfare versus antiwelfarist” dimension (Park et al. Reference Park, Clery, Curtice, Phillips and Utting2012). To the best of my knowledge, there has been no attempt to use these items as part of a larger inquiry into the mental maps people use to reason about redistributive social issues. I focus my analysis on the 2016 wave in particular, as it includes additional questions on the topic of progressive taxation alongside questions about social spending for the poor and the unemployed, as well as the traditional redistribution item used in most studies of redistributive preferences. Items are listed in Table 10.1.Footnote 16 Specifically, respondents were asked a set of questions about existing tax levels, differentiating between the taxes of the rich and those of the poor. I use these items to classify people based on the extent to which they think that the tax system in 2016 is not progressive enough (tax on the rich too low and on the poor, about right or too high). I assume that this measure provides a decent proxy of support for, or opposition to, a more progressive tax system and examine whether the tax progressivity item loads on the same dimension as items that measure proportionality beliefs.
Table 10.1 Attitude structure in Great Britain: confirmatory factor analysis
| Item wording | 1st Factor | 2nd Factor |
|---|---|---|
| Reciprocity beliefs | ||
| Benefits for unemployed people: too low and cause hardship vs. too high and discourage job seeking [dole] | 0.60 | |
| The welfare state encourages people to stop helping each other [welfhelp] | 0.45 | |
| If welfare benefits weren’t so generous, people would learn to stand on their own two feet [welffeet] | 0.87 | |
| Many people who get welfare don’t really deserve any help [sochelp] | 0.71 | |
| Most unemployed people could find a job if they really wanted one [unempjob] | 0.71 | |
| Most people on the dole are fiddling [dolefidl] | 0.69 | |
| Redistribution to policies | ||
| Gov’t responsibility: good standard of living for the unemployed [govresp6] | 0.51 | 0.21 |
| More spending on unemployment benefits [morewelf] | 0.50 | 0.20 |
| Proportionality beliefs | ||
| Management will always try to get the better of employees if it gets the chance [indust4] | 0.65 | |
| There is one law for rich and one for poor [richlaw] | 0.71 | |
| Working people do not get their fair share of nation’s wealth [wealth] | 0.87 | |
| Big business benefits owners at the expense of workers [bigbusnn] | 0.83 | |
| Redistribution from policies | ||
| Tax progressivity (combined items) [taxlowsc/taxhisc] | 0.53 | |
| It is the responsibility of the government to reduce the differences in income [govresp7] | 0.32 | 0.58 |
| Government should redistribute income from the better-off to those who are least well-off [redistrb] | 0.18 | 0.65 |
| Correlation coefficient between factors (95% CI) | 0.19 [0.10, 0.29] | |
| Standardized root mean squared residual assuming 2 dimensions (shown) | 0.075 | |
| Standardized root mean squared residual assuming 1 dimension | 0.171 | |
| Sample size | 658 | |
Notes: Results are based on a confirmatory factor analysis; final model relaxes the assumption that policy items load on one dimension only.
Best practice, when testing for the existence of a latent structure using survey data, is to divide the sample in two and run an exploratory factor analysis (EFA) on the first half of the dataset and a confirmatory factor analysis (CFA) on the second half. I use the EFA to test the plausibility of a unidimensional versus a multidimensional factor solution. By letting all survey items freely load on any latent factors in the data, an EFA provides information on whether interitem correlations are larger for distinct subset of items. To improve the interpretation of factor loadings, an EFA imposes structure on the relationship between the latent factors.Footnote 17 Switching to a CFA provides a more reliable estimate of the correlations between latent factors. Indeed, in contrast to EFA, CFA imposes constraints on the factor loadings, allowing to freely estimate the correlation between latent factors (Costello and Osborne Reference Costello and Osborne2005; Matsunaga Reference Matsunaga2010). In other words, an EFA tells us which items “go together” and to what extent, while a CFA tells us whether the latent factors underpinning each cluster of items are meaningfully correlated or not.Footnote 18
Table 10.1 presents the results from the CFA (for EFA results, see Cavaillé, 2023). They indicate that the two-dimensional conceptualization of fairness reasoning and demand for redistribution sketched in Figure 10.3 better explains the correlation patterns found in the BSAS than the unidimensional conceptualization sketched in Figure 10.2. Indeed, the estimation returns a correlation coefficient of 0.19. Furthermore, when analyzing earlier waves, I cannot reject the null that the two dimensions are orthogonal to each other (see Cavaillé Reference Cavaillé2023). Policy items load in expected ways. First, questions about transfers to the poor and the unemployed load more strongly on the same latent dimension as reciprocity beliefs items. Second, items asking about taxes load on the same latent dimension as proportionality beliefs items.
Interestingly, attitudes toward income redistribution as traditionally measured most strongly load on this second latent dimension, implying that answers to this item are best explained by differences in proportionality beliefs, not differences in reciprocity beliefs. In other words, and against common expectations in political economy, answers to the traditional redistribution item appear only weakly correlated with beliefs about the work ethic of net beneficiaries of redistribution: support for redistribution measured in this fashion is best interpreted as support for redistribution from policies, not redistribution to policies.
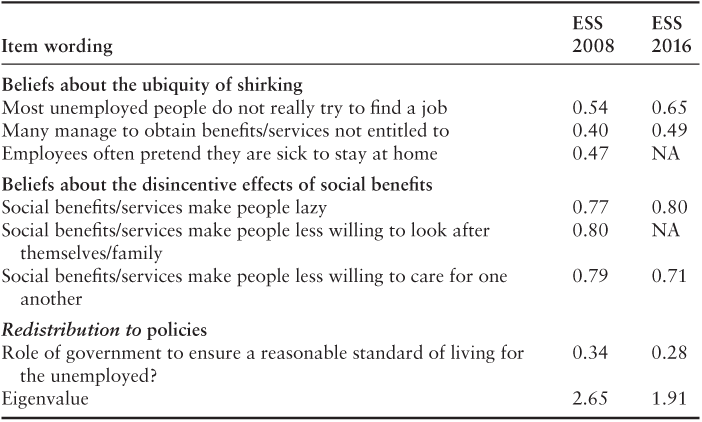
As previously mentioned, data limitations preclude me from running the same analysis in countries beyond Great Britain. As a result, I focus on testing empirical expectations adapted to the available data. In 2008 and 2016, the ESS included a battery of items similar to the ones used in the British analysis to measure reciprocity beliefs (listed in Table 10.2). Both waves of the ESS also included a version of the traditional redistribution question worded as follows: “The government should take measures to reduce differences in income levels. Agree/disagree?” I examine whether, as found in the BSAS, knowing what someone thinks about the prevalence of free riding among welfare recipients says little about their agreement with the claim that the government should redistribute income from the most to the least worse off.
Table 10.2 Reciprocity beliefs: factor loadings
| Item wording | ESS 2008 | ESS 2016 |
|---|---|---|
| Beliefs about the ubiquity of shirking | ||
| Most unemployed people do not really try to find a job | 0.54 | 0.65 |
| Many manage to obtain benefits/services not entitled to | 0.40 | 0.49 |
| Employees often pretend they are sick to stay at home | 0.47 | NA |
| Beliefs about the disincentive effects of social benefits | ||
| Social benefits/services make people lazy | 0.77 | 0.80 |
| Social benefits/services make people less willing to look after themselves/family | 0.80 | NA |
| Social benefits/services make people less willing to care for one another | 0.79 | 0.71 |
| Redistribution to policies | ||
| Role of government to ensure a reasonable standard of living for the unemployed? | 0.34 | 0.28 |
| Eigenvalue | 2.65 | 1.91 |
Notes: Exploratory factor analysis on the pooled data using a polychoric correlation matrix adapted to ordinal variables. Extracted method: iterated principal factor method, robust to using other extraction methods. Countries included in the analysis are GB, FR, IE, BE, PT, DE, NL, CH, NO, AT, ES, FI, DK, SE, GR, as well as EE, HU, PL, SI, SK, CZ. The latter countries were included because they are market economies with large welfare states. Note however, that given half a century of Soviet occupation, the results for these countries should be analyzed with caution.
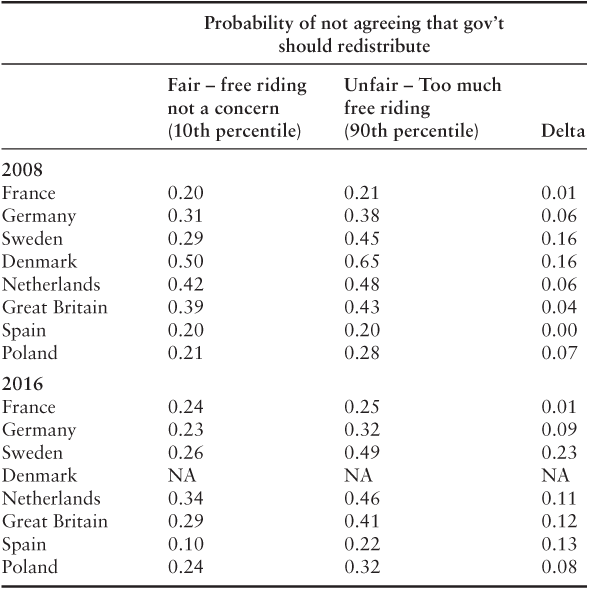
To do so, I use items listed in Table 10.2 to compute individual factor scores that rank respondents according to how prevalent (and concerning) they believe free riding to be.Footnote 19 Table 10.3 (top panel) reports the predicted probability of disagreeing with the principle of income redistribution for a hypothetical individual with a reciprocity belief score equal to the 10th and 90th percentile of scores in her country. I repeat this analysis using the 2016 data, results are presented in the bottom panel of Table 10.3. In most countries and in both waves, moving from the 10th to the 90th percentile on the reciprocity scores says little about one’s level of opposition to income redistribution as traditionally measured. There is one notable exception to this pattern, Sweden, with a differential equal to 23 percentage points for the year 2016. Additional analysis seems to indicate that, in Sweden, the correlation between the two latent dimensions is likely higher than in other countries (Cavaillé and Trump 2015).
Table 10.3 Opposition to redistribution is not predicted by reciprocity beliefs
| Probability of not agreeing that gov’t should redistribute | |||
|---|---|---|---|
| Fair – free riding not a concern (10th percentile) | Unfair – Too much free riding (90th percentile) | Delta | |
| 2008 | |||
| France | 0.20 | 0.21 | 0.01 |
| Germany | 0.31 | 0.38 | 0.06 |
| Sweden | 0.29 | 0.45 | 0.16 |
| Denmark | 0.50 | 0.65 | 0.16 |
| Netherlands | 0.42 | 0.48 | 0.06 |
| Great Britain | 0.39 | 0.43 | 0.04 |
| Spain | 0.20 | 0.20 | 0.00 |
| Poland | 0.21 | 0.28 | 0.07 |
| 2016 | |||
| France | 0.24 | 0.25 | 0.01 |
| Germany | 0.23 | 0.32 | 0.09 |
| Sweden | 0.26 | 0.49 | 0.23 |
| Denmark | NA | NA | NA |
| Netherlands | 0.34 | 0.46 | 0.11 |
| Great Britain | 0.29 | 0.41 | 0.12 |
| Spain | 0.10 | 0.22 | 0.13 |
| Poland | 0.24 | 0.32 | 0.08 |
Notes: People who agree and strongly agree that the government should redistribute income are coded as 0. Other response categories are coded as 1.
Country-Level Analysis
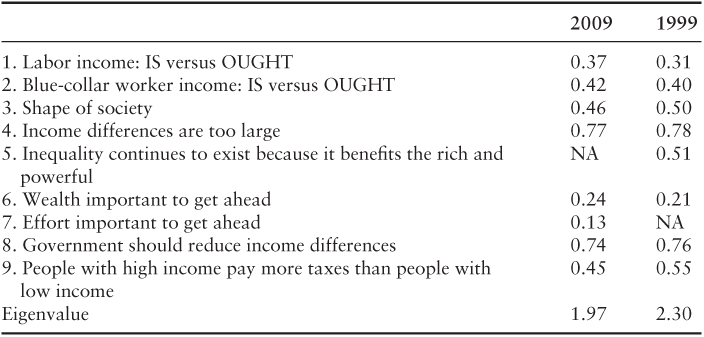
Moving from the individual to the country level, I combine data from the ESS survey of 2008 and the ISSP survey of 2009 to examine country differences in fairness beliefs and policy preferences. First, a few words on the ISSP items, which are listed in Table 10.4. The first measurement item combines answers to a set of questions asking about the perceived and preferred income of a fixed set of occupations. Specifically, I regress items capturing preferred income (what ought to be) over items capturing perceived income (what is). The resulting regression coefficient is equal to 1 if a respondent believes that existing income differences align with their preferred income differences. The closer the coefficient is to zero, the more the respondents believe that existing income differences (as they perceive them) deviate from their preferred benchmark. In other words, this item measures perceived dissatisfaction-satisfaction with existing income differences. The second item captures the extent to which people think blue-collar workers are underpaid. I focus on this occupation as embodying the quintessential hardworking individual: respondents who believe that this individual is underpaid are less likely to believe that effort alone is enough.Footnote 20 The third item is a dummy variable equal to 1 if a respondent perceives the society she lives in as highly unequal, that is, a few rich at the top and most people at the bottom. Items 4 and 5 directly ask about inequality, while items 6 and 7 ask about the role of wealth and effort to get ahead in the country respondents live in. Item 8 is the ISSP’s version of the traditional redistribution item, while item 9 asks about support for more progressive taxation.
Table 10.4 Proportionality beliefs and “redistribution from”: factor loadings
| 2009 | 1999 | |
|---|---|---|
| 1. Labor income: IS versus OUGHT | 0.37 | 0.31 |
| 2. Blue-collar worker income: IS versus OUGHT | 0.42 | 0.40 |
| 3. Shape of society | 0.46 | 0.50 |
| 4. Income differences are too large | 0.77 | 0.78 |
| 5. Inequality continues to exist because it benefits the rich and powerful | NA | 0.51 |
| 6. Wealth important to get ahead | 0.24 | 0.21 |
| 7. Effort important to get ahead | 0.13 | NA |
| 8. Government should reduce income differences | 0.74 | 0.76 |
| 9. People with high income pay more taxes than people with low income | 0.45 | 0.55 |
| Eigenvalue | 1.97 | 2.30 |
Notes: Exploratory factor analysis on the pooled data using a polychoric correlation matrix adapted to ordinal variables. Extracted method: iterated principal factor method, robust to using other extraction methods. Note the small factor loading on items 6 and 7, items which are often used in the “does effort pay?” literature.
Table 10.4 includes factor loadings from an EFA on the pooled data: all items load on the same latent factor. I also repeat the analysis on the 1999 wave of the ISSP, which includes many of the same items.Footnote 21 I use these items to compute factor scores that measure individual differences in how much people find income differences unfair (fair) and support (oppose) redistribution. I then aggregate these scores at the country level.
Figure 10.4 compares country averages computed using the 2009 wave with country averages computed using the 1999 wave. The correlation between the 1999 country averages and the 2009 averages is 0.90 (N = 13). Figure 10.4 also includes the same analysis using the 2008 and 2016 waves of the ESS. Specifically, I use the items in Table 10.4 to compute factor scores measuring individual differences in the extent to which people believe the unemployed and the poor are free riding and oppose transfers that benefit this group. In this case, the correlation between the two waves is 0.86 (N = 19). Fairness beliefs appear to be a stable component of a country’s attitudinal landscape.
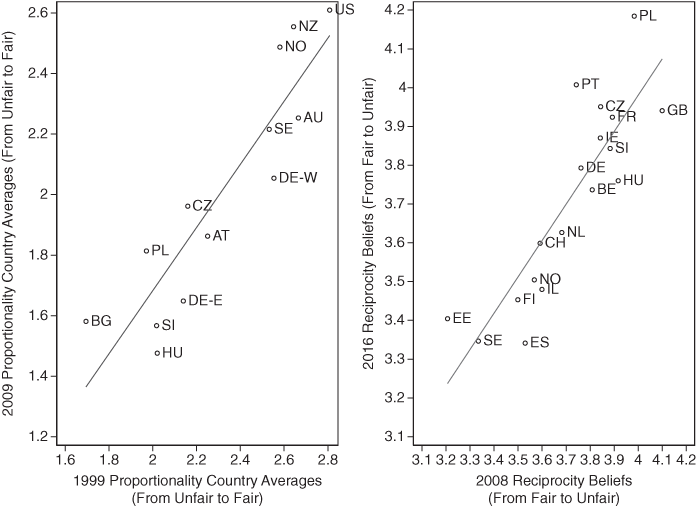
Figure 10.4 Changes in fairness beliefs
Note: See text for more detail on the measures.
Figure 10.5 combines the 2008 wave of the ESS and the 2009 wave of the ISSP. Note that the ESS does not include the United States. To place this country with regards to the reciprocity norm, I have relied on data collected independently by Clem Brooks and available in Svallfors (Reference Svallfors and Svallfors2012). Brooks’ results show that response patterns in the United States are similar to those found in Great Britain. Overall, very few countries align along the traditional left-right axis (from the bottom-left to the top-right), which runs from consistently pro-redistribution beliefs (fair according to reciprocity, unfair according to proportionality) to consistently antiredistribution beliefs (unfair according to reciprocity, fair according to proportionality). If anything, the key axis appears to be one running from fair to unfair according to both norms.
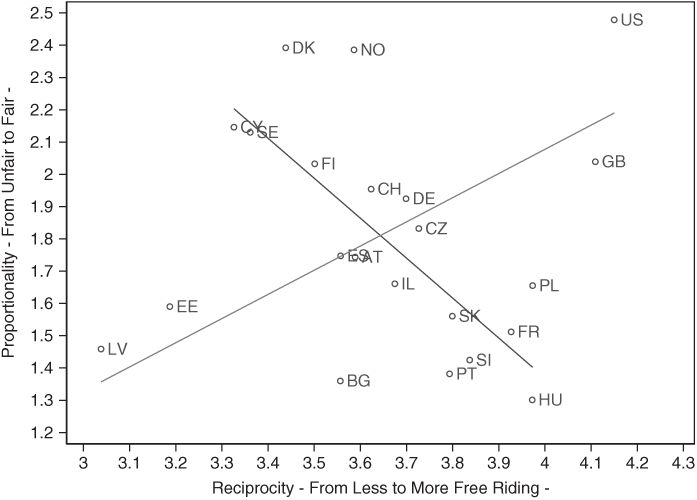
Figure 10.5 Correlation between proportionality and reciprocity beliefs
Notes: See text for more detail on the measures. Note that the US score on the X-axis is approximated using Svallfors (Reference Svallfors and Svallfors2012).
Given the imperfection of available items, the country-level evidence remains tentative. Nevertheless, it highlights the limits of existing approaches to fairness reasoning as well as the benefits of the two-dimensional framework. First, notice how, despite very different institutional setups, Denmark, Norway, and the United States are in the same ballpark when it comes to proportionality beliefs. Scandinavians find their economic system fair and rightly so: mobility rates are much higher and differences in market income lower. As a result, in these countries, support for income redistribution, as traditionally measured, is often lower than one might expect. In Denmark, for example, agreement with the traditional redistribution item was a low 55 percent, compared to a high 90 percent in Portugal. Where Scandinavian countries differ from the United States is in terms of their reciprocity beliefs: they express high trust and comparatively much lower concerns about free riding and moral hazard. In contrast, the United States (and Great Britain) are much more likely to perceive unemployed workers as undeserving and be concerned about shirking. There is a similar split among countries that find the economic system and income inequality unfair. France and most postcommunist countries are closer to the United States and Great Britain than to Scandinavian countries in terms of their level of concern about free riding. The exceptions are Baltic countries who appear satisfied with how welfare spending is disbursed in their country.
Overall, the two-dimensional structure found at the individual level is also found at the country level, echoing the ideal-typical setup sketched in Figure 10.3 (right panel). Jointly, the individual- and country-level evidence demonstrates that the conceptualization of fairness presented in this chapter provides a better fit to the available survey data than existing work on fairness reasoning. In the concluding section, I discuss implications for studying the relationship between income inequality and attitudes toward redistributive policies.
Implications for Policy Change in the Age of Inequality
I have argued that in Western societies with mature welfare states, there exist, to paraphrase Michael Walzer, distinct “spheres” of fairness, each with their own social good and distributive principle (Walzer Reference Walzer1983). The “economy” and “markets” produce one type of good – market income – whose allocation is, at least partly, regulated (and contested) through the proportionality principle. “Society,” through the “welfare state,” pools resources to produce a second type of good – social insurance in the form of social benefits – whose allocation is, at least partly, regulated through the reciprocity principle. The existence of a shared understanding of what constitutes fair inequality and fair social solidarity (i.e., shared norms of fairness) helps regulate envy, minimize resentment, and promote consensual resource sharing. When fairness beliefs, policy preferences, and existing institutional arrangements complement each other, then the system is in equilibrium. On the policy side, this means that fairness beliefs constrain the types of policy reforms that get implemented: those that do not “fit” existing fairness beliefs tend to fail. On the mass opinion side, changes in aggregate preferences should be limited to small fluctuations around a stable mean. What evidence do we have for this?
With regards to policy reforms, one interesting case is that of flexicurity, a type of policy reform first promoted in Scandinavian countries and heralded as the ideal combination of market efficiency and social solidarity. Based on Figure 10.5, Scandinavian countries’ combination of fairness beliefs appears particularly hospitable to such reform: the belief that effort pays underpins support for proactive labor market policy, while the belief that abuse of social spending and free riding is the exception, not the norm, underpins support for generous social insurance. Now imagine trying to advocate for such reforms in a country like France, which holds the exact opposite beliefs: these reforms are likely to poll poorly. A combination of vocal opposition from those directly affected by the reform and bad polling will be enough to block proposed reform packages. This has indeed been a recurrent pattern in France since the mid-1990s. France, which taxes high incomes and regulates the market based on the belief that effort does not pay, appears to be less enthusiastic about deepening the redistributive features of social insurance. While there have been no dramatic welfare cuts in France, this might nevertheless preclude welfare reforms that seek to better meet the needs of the growing contingent of labor market “outsiders” (Emmenegger et al. Reference Emmenegger, Häusermann, Palier and Seeleib-Kaiser2011; Rueda Reference Rueda2007; Saint-Paul Reference Saint-Paul1999).
With regards to public opinion, in line with expectations, stability is the norm and change is the exception. Indeed, as shown by Kenworthy and McCall, while aggregate social policy preferences vary across countries, they do not vary nearly as much over time (Kenworthy Reference Kenworthy2009; Kenworthy and McCall 2008; McCall and Kenworthy Reference Kenworthy2009; see also Svallfors Reference Svallfors and Pierre2016). These patterns, in line with the hypothesis of fairness reasoning as the manifestation of an order producing social technology, align with the hypothesized existence of self-reinforcing equilibria.
This suggests a key role for fairness reasoning in explaining the disconnect between rising inequality and support for redistribution (specifically, the redistribution from a subset of redistributive policies that interfere with the accumulation of market income among the better off). For most people, income inequality is an abstract reality, meaningful only through the lenses of fairness reasoning and prior proportionality beliefs. At the individual level, stable proportionality beliefs introduce a disconnect between changes in inequality and mass perceptions of these changes. At the aggregate level, only a subset of the population (the one that already finds market income unfair) will experience a rise in income inequality as something that needs to be addressed. Ultimately, countries with institutions most favorable (unfavorable) to an increase in income inequality are also those most likely to have a larger share of the population that believes that income inequality is fair (unfair) and are less likely to increase their support for policies that interfere with this distribution (Bénabou and Tirole Reference Bénabou and Tirole2006).
This argument presented in this chapter also has implications for research on demand for redistribution broadly defined.Footnote 22 For example, studies that focus on information about inequality as the missing link in the causal chain connecting inequality to demand for redistribution (e.g., Matthews et al., this volume) assume a very specific distribution of fairness beliefs, one in which the median voter finds the status quo unfair, as defined by the proportionality norm. Only then can we expect more information on rising income inequality to translate into a growing demand for more egalitarian policies. However, whether or not a majority perceives income inequality as a violation of the proportionality norm is something to be explained, not assumed.
Researchers should also revisit expectations that disruptive events such as an economic recession or a pandemic have implications for mass policy preferences. Absent ideal conditions, the expectation should be that mass attitudes will not be affected by such events. Instead of puzzling over “too much” stability, researchers might choose to focus their efforts on theorizing what such “ideal conditions” for change might look like. One recent example is given by Scheve and Stasavage (Reference Scheve and Stasavage2016). Change, they argue, happens as a result of a unique “shock” (i.e., total warfare) and political entrepreneurs finding the correct fairness appeal to present policy innovations as both necessary and fair. Total warfare constitutes a social dilemma: citizens’ individual interest is to defect, at the expense of the collective. In line with the reciprocity principle, their willingness to contribute their blood to the war effort is conditional on the belief that everyone is engaged in a similar sacrifice, that is, nobody is free riding (Levi Reference Levi1991). In such a context, large economic profits are perceived to violate the reciprocity norm: they reflect an actors’ selfish economic gains at the expense of the collective (ultimate) sacrifice. According to Scheve and Stavasage, the ability to (temporarily) frame high-income earners as war profiteers who violate the reciprocity norm helps explain why some countries were able to introduce wealth taxation while others were not. In other words, total warfare opens the door to a new type of critique of high-income individuals as profiteers abusing the joint effort. When mobilized by political actors, this fairness language finds echo in people’s personal experiences of hardship and sacrifice.


 Open access