

Research has demonstrated that public policy in many advanced democracies is biased toward the preferences of affluent and highly educated citizens. They respond little to the interests of the uneducated and poor – or even to those of the average citizen. These findings present a severe challenge for democracy, in which, theoretically, political equality is required. It is thus no surprise that scholars have sought to understand the workings of unequal representation. While there are various mechanisms that could potentially account for these outcomes, including the role of money in politics, descriptive representation, and a supply gap in the party system, we here focus on one complementary mechanism that traditionally has gotten the most attention in the literature: unequal political participation. Political research going back to the early 1970s has argued that systematic inequalities in, for example, who votes, contacts elected officials, demonstrates, and signs petitions, are bound to produce a political system that caters more to citizens who actively voice their opinions. Although the logic of this argument appears sound and much empirical work points to its credibility, scholars have noted a problem of endogeneity. Namely, is responsiveness unequal because of unequal participation, or is participation unequal because of unequal responsiveness? It might very well be that citizens who rarely see their preferences translated to policy are discouraged from participating in politics, and likewise, that citizens who feel that the government is listening to them view participation as effective and meaningful.
Determining the direction of the causal arrow is hard. In this chapter, we make an attempt at estimating the extent to which the reversed causality scenario (unequal representation affecting participation) occurs. Specifically, under the key assumption that unequal representation produces differences in participation mainly through citizens’ subjective perceptions of the system, we can calculate to what extent these beliefs account for gaps in participation across income and educational groups. That is, we can estimate to what extent participation gaps are caused by gaps in perceptions on whether the system can offer adequate representation. To this end, we use Oaxaca-Blinder Decomposition to decompose education and income gaps in participation and estimate counterfactually how large these gaps would have been if low-educated and poor citizens had the same beliefs about the system as the more-educated and affluent citizens. Using nine different measures of system satisfaction and looking at nine different forms of political participation, we find that the gap in voting between the bottom and top education/income quintile would be around 15 to 20 percent smaller if those groups were equally optimistic about the workings of the system and their possibilities for influence. Gaps in other forms of participation would change even less, or not at all. These results provide some evidence that unequal participation is mainly attributable to other factors than the system being perceived as unequally responsive.
Our chapter proceeds as follows. We first discuss previous findings regarding unequal representation, outlining the various approaches in this research as well as the scope of the problem. We then highlight the main findings regarding participation gaps in many developed democracies, including various forms of political participation. Further, we outline why participation would be expected to affect the representation of preferences before dealing with the potential reversed causality puzzle.
Differential Representation Based on Income and Education
The last fifteen years have seen an increasing number of studies exploring if, and to what degree, rich citizens are better represented politically than the less well-off in modern democratic states. Some of these studies compare public opinion with subsequent changes in public policy. Gilens (Reference Gilens2005, Reference Gilens2012) and Gilens and Page (Reference Gilens and Page2014), the most extensive studies of the kind (but see Jacobs and Page Reference Jacobs and Page2005), estimate the relationship between policy outcomes and the opinions of affluent, middle-class, and poor Americans with a dataset of nearly 2,000 policy issues. They conclude that economic elites have “substantial independent impacts on U.S. government policy,” while average citizens “have little or no independent influence” (Gilens and Page Reference Gilens and Page2014, p. 564). Importantly, however, ordinary citizens “often get the policies they favor,” but only because they often agree with economic elites, “who wield the actual influence” (576). Some scholars have criticized their methods and conclusions (Bashir Reference Bashir2015; Branham et al. Reference Branham, Soroka and Wlezien2017; Elkjær and Iversen, this volume; Enns Reference Enns2015; Soroka and Wlezien Reference Soroka and Wlezien2008), and the authors have in turn responded to the critiques (Gilens, Reference Gilens2009, respectively; Gilens Reference Gilens2015a, Reference Gilensb, Reference Gilens2016; Gilens and Page Reference Gilens and Page2016). Other studies of the United States have demonstrated responsiveness bias in favor of the rich with respect to roll-call voting in Congress (Bartels Reference Bartels2016), specific policies at the state level (Flavin Reference Flavin2012), and the broader policy orientations of the Democratic and Republican parties across the states (Rigby and Wright Reference Rigby and Wright2013).
Outside of the United States, single-country studies using more or less the same research design as Gilens (Reference Gilens2012) have been undertaken in Germany (Elsässer and Schäfer Reference Elsässer2018), the Netherlands (Schakel Reference Schakel2021), Sweden (Persson Reference Persson2023), Norway (Mathisen Reference Mathisen2023), as well as comparatively (Mathisen et al., this volume). All find similar results as Gilens, the only partial exception being Norway, where Mathisen (Reference Mathisen2023) finds the poor to have some independent influence on economic issues.
Other studies have taken a cross-national approach to unequal responsiveness using more aggregate policy measures, such as spending or the ideological orientation of governments and parties. Peters and Ensink (Reference Peters and Ensink2015, p. 596) match income-disaggregated support for redistribution with subsequent changes in government social spending for twenty-five European countries. They find that “[l]ower-income groups tend to be under-represented while higher-income groups appear over-represented” and that “low levels of turnout seem to emphasize” this pattern. Bartels (Reference Bartels2017) similarly finds what he calls a “social welfare deficit” of 10 to 15 percent in affluent democracies due to government spending being biased in favor of the preferences of the affluent. Examining congruence around the world by matching citizen and elite surveys, Lupu and Warner (Reference Lupu and Warner2022a) also find that the rich are generally overrepresented compared to the poor, specifically on economic issues. Moreover, Giger et al. (Reference Giger, Rosset and Bernauer2012, p. 57) find that “generally, the poor are represented worse than the rich” in terms of their distance to the nearest party and the government on a left-right scale. However, they observe “considerable variation in the effect” across twenty-one Western democracies. In subsequent work, the authors find that the unequal ideological proximity is smaller in PR systems (Bernauer et al. Reference Bernauer, Giger and Rosset2015) and in countries with lower levels of economic inequality (Rosset et al. Reference Rosset, Giger and Bernauer2013).
So far, this relatively young empirical literature has produced robust evidence suggesting that rich citizens are substantially better represented politically than the average citizen and the poor in Western states. This finding is strengthened by the wide variety of empirical strategies that scholars have utilized, all leading to similar conclusions. Indeed, Bartels (Reference Bartels2017, p. 10) notes that except for his unpublished manuscript on immigration in Europe (Bartels Reference Bartels2017), he has found no study “providing positive evidence of egalitarian responsiveness to the preferences of affluent and poor people.” Recent work by Lupu and Warner (Reference Lupu and Warner2022a), however, does find that the poor are overrepresented on certain cultural issues.
Compared to the work on differential responsiveness based on income, there is little work on the issue with respect to educational differences. Gilens (Reference Gilens2012) showed that in the United States, responsiveness does not increase with education the same as he found with income. On the other hand, Schakel (Reference Schakel2021) and Mathisen (Reference Matthews and Kerevel2022) find that responsiveness is actually more contingent on education than income in the Netherlands and Norway, respectively. Further, an additional study of the Netherlands found that the unequal representation of educational groups extended to both cultural and economic policy issues (Schakel and Van Der Pas Reference Schakel and Van Der Pas2021). These studies indicate that differential responsiveness is not limited to affluence but extends to educational differences.
Understanding Differential Representation
Scholars have identified a range of possible causes for existing political inequality based on income, ranging from an unequal influence of interest groups (Gilens and Page Reference Gilens and Page2014), a supply gap in the policy space covered by political parties (Rosset and Kurella Reference Rosset and Spohie Kurella2021), money in politics (Flavin Reference Flavin2015a), the structural power of business (Young et al. Reference Young, Banerjee and Schwartz2018), skewed descriptive representation (Butler Reference Butler2014; Carnes Reference Carnes2013; Carnes and Lupu Reference Carnes and Lupu2015), to the way that the media reports economic news (Jacobs et al. Reference Jacobs, Scott Matthews, Hicks and Merkley2021). Recently, Lupu and Warner combined different explanations of why some countries experience more affluence-based unequal representation than others and found that economic conditions and good governance are the most important determinants (2022b).
At the same time, scholars of political participation have long argued that the systematic inequality in participation is a main source of unequal representation (e.g., Dalton Reference Dalton2017; Lijphart Reference Lijphart1997; Schlozman et al. Reference Schlozman, Verba and Brady2012). We argue that, indeed, unequal political participation is a complementary explanation and likely contributes to unequal representation. Even if the important structural factors would not incentivize politicians to be more responsive to the rich and more educated, politicians would still struggle to represent preferences more equally because poorer and less-educated citizens tend to be less involved in politics. In this section, we provide an overview of the inequalities in participation that previous research has found and present some data to suggest that gaps in participation on the basis of education and income still exist today. Second, we outline the potential mechanisms that would lead unequal participation to cause unequal representation. We consider participation beyond voting alone because, while often less immediately consequential to political careers, other forms of participation emphasize the communication of preferences. Indeed, politicians may learn more about citizen preferences through alternative participation than through voting.
Unequal Political Participation
Democracies need the participation of its citizens in order to function, and because political participation informs governments about the policies that citizens want, citizens should participate in more or less equal ways. Often, however, this is not the case. Research has shown that people with some backgrounds are more likely to be involved than others. In many cases, citizens are not equally likely to engage in active forms of participation. Citizens with more resources, that is, time, money, and skills, are more likely to participate politically than those with fewer resources (see, in particular, Verba and Nie Reference Verba and Nie1972; Verba et al. Reference Verba, Schlozman and Brady1995). For one, citizens need to be able to understand something about politics, both in terms of the contents as well as the participation procedures. Politics can be complex, and not all citizens feel equally capable of participating effectively. Indeed, Gallego (Reference Gallego2010) demonstrates that in contexts where voting procedures are easier, and where there are fewer political parties, turnout inequality based on education is reduced. Moreover, with the decline of the welfare state and increasing labor market inequalities (Häusermann, Kemmerling, and Rueda Reference Häusermann, Kemmerling and Rueda2020), labor is now also more divided in being either more secure or more fragile. This development affects political preferences but is also likely to affect the available time and energy that some people have. It may, for example, imply that some people work double or even triple jobs in order to earn a sufficient income, leaving these people with little time resources. Labor market inequalities, thus, further emphasize a difference in resources, encouraging unequal participation.
The inequality in resources thus tend to lead to inequalities in participation. In their meta-analysis on the individual determinants of voting, Smets and van Ham (Reference Smets and van Ham2013) show that most studies find education, income, and social class to be important predictors of voting. It appears that a social-status gap exists in terms of who votes, where higher status individuals are more politically active (Dalton Reference Dalton2017, p. 57) and are thus more likely to communicate their preferences through a vote. These inequalities are not limited to voting, however, but apply to many forms of political participation. Income, education, and citizens’ occupation often affect the likelihood of being engaged in contacting, donating money, protesting, and online activism (see, e.g. Dalton Reference Dalton2017; Schlozman et al. Reference Schlozman, Verba and Brady2012). People from a higher social class and with a higher income are also more actively involved in party politics (e.g., Whitely and Seyd Reference Whitely and Seyd1996).
These types of involvement are important, in part to voice preferences to the political elite, in part to place issues on the political agenda. One important way through which legislators get their information about citizen preferences and the issues that they find important is through contacting (Butler and Dynes Reference Butler and Dynes2016; Fenno Reference Fenno1977); and again, not everyone is equally likely to contact politicians. In a clear illustration of such inequality in involvement, a survey among very wealthy Americans showed that these people are politically active through attending meetings, voting, and discussing politics, but are also very active in terms of contacting various politicians (Page et al. Reference Page, Bartels and Seawright2013). The wealthy Americans tend to have access and be close to public officials, with respondents indicating some form of personal familiarity with members of the political elite.
What is more, while these patterns are often driven by socioeconomic status, they are also reinforced through parental socialization. For instance, research has shown that political interest in part depends on parental socialization (Neundorf et al. Reference Neundorf, Smets and García-Albacete2013) and that conversations about politics in the family directly affect the frequency of participation of the children (Cornejo et al. Reference Cornejo, Rocha, Castro, Varela, Manzi, González, Jiménez-Moya, Carvacho, Álvarez, Valdenegro, Cheyre and Livingstone2021). Moreover, Schlozman et al. (Reference Schlozman, Verba and Brady2012) show that besides their own level of education and family income, the education of parents and their exposure to politics at home when younger affect the political activity by Americans. This research suggests that persistent socioeconomic inequalities through generations are, to some extent, also accompanied by persistent intergenerational inequalities in political participation.
The overall unequal patterns of participation have raised concerns for the health of democracy (Dalton Reference Dalton2017; Lijphart Reference Lijphart1997; Schlozman et al. Reference Schlozman, Verba and Brady2012; Verba et al. Reference Verba, Nie and Kim1978). It is important to note, however, that gaps in political participation are not equally large in all countries, and there are even places where the pattern is reversed. Kasara and Suryanarayan (Reference Kasara and Suryanarayan2015) show, for example, that the rich tend to turn out more than the poor in countries where redistribution preferences of the rich and poor diverge more, and where the state has the capacity to tax the rich. In a way, this implies that when the rich do not see a credible threat to their wealth, they also tend to participate less. Moreover, Amat and Beramendi (Reference Amat and Beramendi2020) show that the poor tend to turn out to vote at higher rates when inequality is high and capacity is low. In these cases, parties see a benefit and an easy opportunity to mobilize poorer voters, conditioning “the political voice of the poor as opposed to excluding them altogether” (p. 860). Gallego (Reference Gallego2015) further highlights that the gap in voting based on education varies considerably between countries, to the extent that some countries do not experience an educational bias or that the bias is reversed. She demonstrates that institutional structures affect inequality in voting, including electoral procedures, party systems, and unionization. This literature emphasizes that unequal participation among citizens can be remedied (or worsened) by how politics and participation are structured institutionally.
Figure 9.1 displays average levels of voting across the twenty-nine European countries in the ESS (2018) and Figure 9.2 provides this information for alternative forms of participation. They show that overall, there are substantial participation gaps between the rich and poor, and between the more and less educated. This is true for all forms of participation, sometimes with differences of around 20 percent on average. This is especially the case for forms that are overall less used, such as signing a petition. Figures 9.1 and 9.2 further highlight that gaps in participation tend to be larger between the more and less educated, than between the rich and poor, emphasizing the importance of the role of education in politics (Bovens and Wille Reference Bovens and Wille2017).
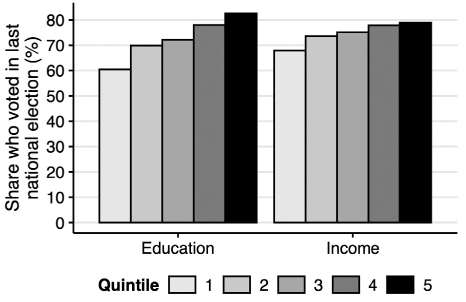
Figure 9.1 Voting, by education and income
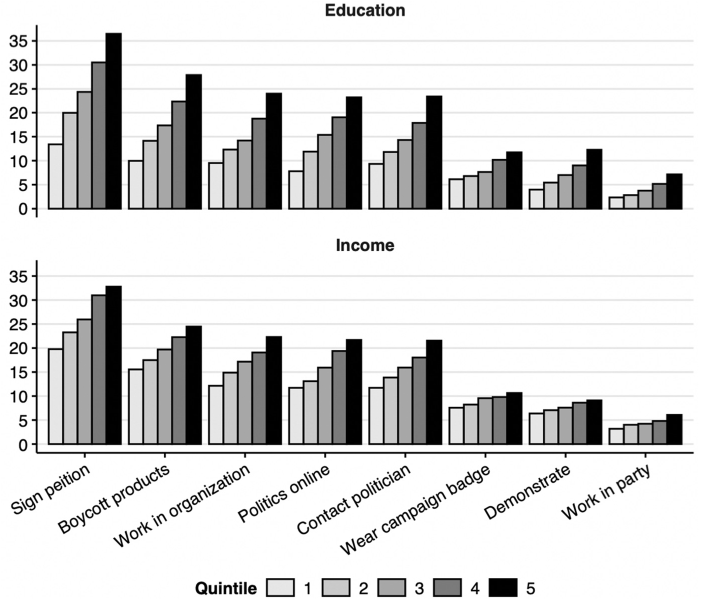
Figure 9.2 Alternative forms of political participation, by education and income
How Unequal Participation Can Translate to Unequal Representation Political participation can affect political representation through (1) the selection of parties and candidates into office, (2) the communication of preferences, and (3) the representatives’ strategic behavior in response to known participation patterns (see also Griffin and Newman Reference Griffin and Newman2005). First, citizens effectively select political parties and candidates who will make up the legislature and government through elections. To the extent that preferences in part depend on citizens’ wealth and educational background, this implies that nonvoters’ preferences are underrepresented in the legislative and executive bodies. With the larger absence of poorer and less-educated citizens, the pivotal median voter is richer and more educated than the median citizen contributing to representational biases (Larcinese Reference Larcinese2007). This may hold in terms of both policy and ideological considerations, as well as the specific candidates that are elected. Since people tend to appreciate candidates that are similar to them in certain relevant personal characteristics (Arnesen and Peters Reference Arnesen and Peters2018), one may expect that a bias in who votes also translates to who is elected to office. Furthermore, how people vote when they do vote may contribute to representational inequality. Some scholars have, for example, shown that some citizens tend to vote “incorrectly”, that is, not in the way that their preferences or interests would suggest they would vote (e.g., Ha and Lau Reference Ha and Lau2015). Predictions in the vote choice are less accurate for people with less education and less political interest. Moreover, Bartels (Reference Bartels2008) finds that the vote choice of the less wealthy is in part dependent on how much the wealthy improved their economic situation in an election year – not on their own economic situation. While there may be valid explanations for the deviations in expected vote choice, this research suggests some people may be more fortunate in the results of the elections than others in terms of preference reflection.
Second, various forms of political participation serve to communicate preferences to the political elite. In order for legislators to represent accurately, they require more or less accurate perceptions of public opinion (Miller and Stokes Reference Miller and Stokes1963). Research has found that representatives tend to align more with constituent opinion when they have more accurate information about it (Butler and Nickerson Reference Butler and Nickerson2011). Yet, some research has shown that legislators are indeed not always very accurate in knowing what citizens want (e.g., Belchior Reference Belchior2014; Hedlund and Friesema Reference Hedlund and Friesema1972). United States legislators, for example, appear to have a systematic conservative bias in their perception constituents’ preferences, which can be attributed to a bias in who contacts (Broockman and Skovron Reference Broockman and Skovron2018). A systematic bias in who participates politically would then also translate into a bias in the information that politicians have about their constituents and may consequently lead to a bias in representation. Communication of preferences, here, can include various forms of participation, and especially contacting and involvement in parties may be important in this respect.
Third, participation may matter through the strategic considerations of political candidates. If candidates are motivated by (re-)election, they would primarily be motivated to please people who may help them to get elected. On the one hand, this may be citizens with larger voting power, that is, groups that are (a) more likely to vote, (b) are less decided on who to vote, and (c) larger groups (Griffin and Newman Reference Newman2013). This suggests that the persistent inequalities in voting form, in part, the basis for decisions on who politicians aim to represent. On the other hand, politicians may be motivated to cater to the preferences of those who make political donations and/or campaign contributions, something that candidates need in some election contexts. Indeed, joining campaign work and/or donating money is often undertaken with the motivation to increase one’s impact beyond one’s own vote (Schlozman et al. Reference Schlozman, Verba and Brady2012: 239).
Some research has attempted to connect unequal participation to unequal representation, often suggesting that participation may have some effect, but that it is not the main driver of differential representation. Some scholars find that voters are better represented (Griffin and Newman Reference Griffin and Newman2005) and that turnout levels affect the representation gap between the rich and the poor (Larcinese Reference Larcinese2007; Martin and Claibourn Reference Martin and Claibourn2013; Peters and Ensink Reference Peters and Ensink2015), although it does not seem to be the main explanatory factor (Bartels Reference Bartels2008; Lupu and Warner Reference Lupu and Warner2022b). At the same time, Leighley and Oser (Reference Leighley and Oser2018) show that roll-call votes correspond better to the preferences of the politically active, and Adams and Ezrow (Reference Adams and Ezrow2009) show that parties in Europe respond better to the preferences of those who are politically engaged. Bartels (Reference Bartels2008) finds some evidence that contacting reduces the inequality gap. Aligning with some of the arguments regarding the role of money in politics, Barber (Reference Barber2016) finds that US senators are in general not very congruent to their constituents, though they do tend to respond to the preferences of the average financial contributor.
In addition to the potential mechanisms through which participation affects representation, the context of political supply may further affect this relation. On the one hand, there is the pool of candidates that run for office, effectively defining who can be elected by voters. Carnes and Lupu (this volume) show that workers are strikingly underrepresented both in the pool of candidates and among the elected legislators in many European countries. Indeed, looking at the composition of several European parliaments, Best (Reference Best2007) also shows that few representatives have a background in the primary sector and most have a university degree. Carnes (Reference Carnes2013) shows that in the United States, such gaps also exist: citizens are much more likely to have a working-class background, be without a college degree, or own less than a million dollars, than the political elite. The notion that not all citizens are likely to become part of the political elite is perhaps further supported by the change that political parties have experienced. European-focused research has indicated that parties are increasingly outside of civil society, the political elite has specialized and professionalized, and are more focused on output legitimacy (Mair Reference Mair2013). This suggests that the political elite has become a sphere on its own, without too strong ties to the citizenry in general terms. This type of bias, however, does not seem to be driven by specific citizen preferences for these higher socioeconomic candidates (Carnes and Lupu Reference Carnes and Lupu2016a; Griffin et al. Reference Griffin, Newman and Buhr2019), nor do working class citizens have less of a nascent political ambition (Carnes and Lupu Reference Carnes and Lupu2023). It appears that citizens are presented with a choice at the outset that limits the possibility to approach descriptive representation of poorer and less-educated citizens; something that may facilitate equal representation (e.g., Bratton and Ray Reference Bratton and Ray2002; Carnes Reference Carnes2012; Hakhverdian Reference Hakhverdian2015).
On the other hand, research has shown that the political offer in terms of policies and ideology is biased toward higher socioeconomic citizens. Rosset and Kurella (Reference Rosset and Spohie Kurella2021) show that preferences of the poor are less well reflected in the political offer that parties present. They show that parties cover different combinations of preferences for the middle incomes best, while both the rich and poor need to make a trade-off. In addition, they find that poorer voters take policy less in consideration, so that they do not make up their disadvantage in offer in the way that the rich tend to do. Furthermore, Weber (Reference Weber2020) discovers that party platforms cater mostly to male, educated, and affluent citizens while attempting to appear agreeable to others. This shows again that already before electoral choices are made, the political landscape favors citizens with a higher socioeconomic background.
At the same time, this political supply issue does not exist exogenously from citizens’ participation. Through their participation, citizens can affect who runs for office and what issues parties put on the agenda. But they also affect who gets elected, that is, even though the pool of candidates is in part given to voters, they select who represents them. Seeing how this may be affecting the composition of the parliament in that there is an overrepresentation of affluent and more-educated legislators (Carnes and Lupu; Curto-Grau and Gallego, both in this volume), it implies that descriptive representation and political participation would have both complementary and interactive effects on unequal representation.
The Endogeneity Problem: Is Participation Unequal Because Representation Is Unequal?
Can we conclude from the earlier discussion that policy outcomes are biased toward the preferences of the affluent and educated partially because they participate more in politics? Not necessarily. While we have discussed several reasons why one would expect unequal participation to translate into unequal representation, the causal arrow might very well go in the other direction. Figure 9.3 demonstrates this point. As we can see, the top three mechanisms in the figure imply that it is participation that influences representation (as we discussed earlier), while the bottom two imply that the causal relationship is the other way around. That is, participation could be unequal precisely because representation is unequal. If elected officials systematically favor the preferences of some citizens over others, one would expect this to have consequences for how citizens perceive the political system. Specifically, citizens who rarely see their preferences enacted in policy might feel that the system is rigged against them, that elected officials ignore their needs, and mainly attend to the interests of the privileged. Therefore, they might see little hope for changing the system through traditional forms of political participation. Conversely, citizens whose views are well represented might feel that the system is working as it should and view participation as effective and meaningful. Hence, the presence of unequal representation could produce unequal efficacy among the public.
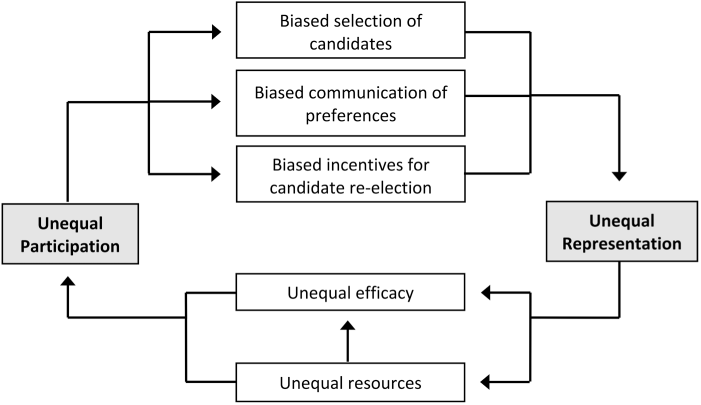
Figure 9.3 Possible mechanisms explaining the association between unequal participation and unequal representation
Notes: The top three mechanisms imply that it is participation that influences representation, while the bottom two imply that the causal relationship is the other way around: representation affects participation. In our empirical analysis, we estimate how much of the relationship that can maximally be attributed to unequal efficacy. That is, how much unequal participation would change under perfectly equal efficacy.
Unequal representation might produce unequal efficacy both directly – as described earlier – but also indirectly. Indirectly, when the voices of the well-to-do dominate the policymaking process, this is likely to produce policies that exacerbate existing inequalities in access to resources. The policy outcomes resulting from unequal representation might thus have important feedback effects on politics (Pierson Reference Pierson1993). Specifically, it might discourage certain strata from participating politically (Brady et al. Reference Brady, Verba and Lehmann Schlozman1995). As argued by Solt (Reference Solt2008: 58), when economic inequality increases, the nonrich are more likely to conclude that “politics is simply not a game worth playing” because the resources needed to play the game are so unevenly distributed.
In sum, we are left with an endogeneity problem (see Anderson and Beramendi Reference Anderson, Beramendi, Christopher and Beramendi2008), that is, does the lower participation rate of poor and less-educated citizens lead to unequal representation; or does unequal representation lead to lower participation rates among those these groups? Realistically, the causal arrow probably goes in both directions – so one could imagine a vicious cycle by which unequal participation creates unequal responsiveness, which in turn exacerbates future inequality in participation. Yet it matters whether the relationship is mainly driven by participation or representation. If participation is the driving factor, then equalizing political participation might produce more egalitarian representation. On the other hand, if unequal political participation is merely a consequence of unequal representation, then equalizing participation should not be expected to have any effect on representational inequality.
Tackling this question empirically is challenging. For example, trying to isolate the causal effect of unequal representation on participation is hampered by factors including a lack of comparable cross-country measures of unequal representation and the rarity of exogenously induced changes. However, under the key assumption that unequal representation, to the degree that it leads to unequal participation, would mainly do so through citizens’ subjective perceptions of the system (i.e., through unequal efficacy in Figure 9.3), we can estimate the effect. Specifically, we then estimate to what extent differential perceptions of the system account for gaps in participation across income and educational groups. We believe the assumption to be highly plausible. Of course, it cannot be ruled out that unequal representation could discourage the low educated and poor from participating without them knowing about it: Unequal representation might produce unequal access to resources, which might influence participation independently of citizens’ beliefs.Footnote 1 That is, worse access to resources could hamper the participation of certain strata, even if they believe the government is actually listening to them. It seems more likely, however, that if unequal representation produces unequal access to resources, then this would adversely affect citizens’ feelings of political efficacy and consequently reduce participation. That such an effect must mainly run through citizens’ subjective perceptions is tacitly assumed by Rennwald and Pontusson (Reference Rennwald and Pontusson2021) when they argue that “growing class bias in responsiveness can hardly be invoked to explain growing working-class support for populist parties” if “citizens have failed to register this development in their perceptions of political representation” (p. 21).
In order to examine to what extent gaps in participation across income and education can be accounted for by different beliefs about how the system works, we employ Oaxaca-Blinder Decomposition. Oaxaca-Blinder Decomposition (Blinder Reference Blinder1973; Oaxaca Reference Oaxaca1973) has become a standard method in economics for estimating how much of a wage gap (typically between males and females) is attributable to a set of predictors (typically occupation, working hours, and experience). However, the method can be used to explain any average difference in a numeric variable between two groups. The method has so far seen limited use in political science (for exceptions, see e.g., Dow Reference Dow2009; Kostelka et al. Reference Kostelka, Blais and Gidengil2019). We here use what is known as a “twofold” decomposition, which will decompose a difference in participation between two groups into the share that is attributable to group differences in a set of predictors, and the remaining, which is unexplained. The explained share is determined by counterfactually imputing the predictor levels of one group onto the other and then predicting with a regression model the level of participation under this scenario. The difference between this prediction and the actual observed level of participation is what is attributable to group differences on the predictors. Standard errors for the estimates are calculated (Jann Reference Jann2008).
Our data source is the European Social Survey Round 9 for twenty-nine European countries. This survey is well suited for our purposes since it contains multiple measures of both concepts in which we are interested: political participation and perceptions of the political system. Our decomposition model includes three types of predictors from the ESS: nine predictors tap into satisfaction with the political system, four predictors measure internal efficacy (i.e., personal abilities, confidence, etc.), and four predictors are sociodemographic variables about the respondent. Most of our predictors are measured on Likert scales from strongly agree to strongly disagree, which we treat as numeric variables in the analysis.
Results
We begin by examining the relationship between beliefs about how the political system works and propensity to participate. If it is indeed the poor and less-educated citizens’ lower satisfaction with the political system that drives their lower rates of participation, then satisfaction with the system needs to be positively associated with participation in the first place.Footnote 2 We use nine variables from the ESS to measure satisfaction with the political system: Agreement that the system allows people “like you” to have (1) influence and (2) say, (3) that everyone can participate, (4) that government considers the interests of all citizens, (5) satisfaction with the country’s democracy, (6) that the respondent feels closer to any of the parties, and lastly, trust in (7) politicians, (8) parties, and (9) parliament (see Table 9.A1 in the Appendix). To test in a simple manner whether these perceptions are related to participation, we made an index by linearly transforming the variables to the same scale and then averaging them for each respondent. We then assigned the respondents into quintiles based on the index distribution in their respective countries.Footnote 3 When it comes to voting, there are clear differences between the people who think the system is working properly and the ones who do not. People in the bottom quintile of the index are 65 percent likely to vote, while this number is 82 percent for the people at the top quintile, and 76 percent for the middle quintile. Furthermore, Figure 9.4 shows the estimated share of respondents who engage in different alternative forms of participation for different quintiles on the satisfaction with the system index. The results show that respondents who are more optimistic about the system are more likely to participate. This is especially the case for respondents who are in the top quintile on the index for their country. Differences are particularly large when it comes to working in organizations and parties or contacting politicians.
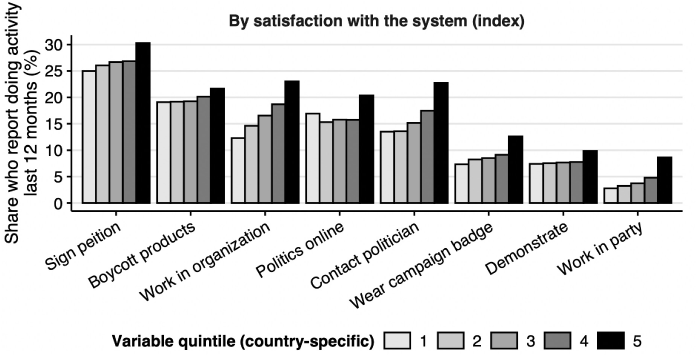
Figure 9.4 Participation by satisfaction with the system
Notes: Index averaging the nine measures of satisfaction with the system. Quintiles are based on each country’s respective distribution. See Table 9.1.
Next, Table 9.1 presents results from the Oaxaca-Blinder Decomposition for voting. Starting from the top of the table, it shows the average gap in voting between the top and bottom education quintile (18.3 percentage points) and between the top and bottom income quintile (10.7 percentage points). Furthermore, the results show that all the predictors we have included in the model (listed in italics) together explain 18 percent of the educational gap and 40 percent of the income gap. Simply put, this means that if the low educated and high educated had had the same values on all the predictors, the difference in voting would be reduced by 18 percent (from 18.3 pp to 14.9 pp; the income gap would go from 10.7 pp to 6.5 pp).
Table 9.1 Oaxaca–Blinder decomposition of the voting gap between high income/highly educated and low income/low educated
| Education | Income | |||
|---|---|---|---|---|
| Contribution (Std. Err.) | % of gap | Contribution (Std. Err.) | % of gap | |
| Overall | ||||
| Gap in voting between bottom and top quintile | 18.29 | 100.0 | 10.67 | 100.0 |
| Total explained | 3.35 (1.21) | 18.3 | 4.22 (0.08) | 39.5 |
| By variable | ||||
| Satisfaction with the system | 0.86 (0.19) | 4.7 | 1.03 (0.35) | 9.7 |
| System allows people like you to have influence | –0.03 (0.08) | –0.2 | 0.00 (0.09) | 0.0 |
| System ensures everyone can participate | 0.45 (0.05) | 2.5 | 0.43 (0.26) | 4.1 |
| Government considers interests of all citizens | –0.05 (0.05) | –0.3 | –0.28 (0.07) | –2.6 |
| Satisfied with working of democracy in country | –0.02 (0.01) | –0.1 | 0.10 (0.02) | 0.9 |
| Feel closer to any of the parties | 1.28 (0.07) | 7.0 | 0.74 (0.14) | 6.9 |
| Trust in politicians | –0.37 (0.25) | –2.0 | –0.15 (0.20) | –1.4 |
| Trust in parties | 0.01 (0.16) | 0.0 | 0.09 (0.15) | 0.9 |
| Trust in parliament | 0.50 (0.30) | 2.7 | 0.23 (0.02) | 2.1 |
| Sum | 14.3 | 20.6 | ||
| Internal efficacy | ||||
| Able to take active role in political group | 0.16 (0.17) | 0.9 | 0.52 (0.13) | 4.9 |
| Confident in own ability to participate in politics | 0.37 (0.31) | 2.0 | –0.01 (0.02) | –0.1 |
| Interest in politics | 3.06 (0.21) | 16.7 | 1.76 (0.12) | 16.5 |
| News consumption | –0.01 (0.01) | –0.0 | 0.06 (0.08) | 0.6 |
| Sum | 19.6 | 21.9 | ||
| Sociodemographic | ||||
| Income (education) quintile | 2.18 (0.43) | 11.9 | 4.85 (0.10) | 45.5 |
| Age | –4.75 (0.04) | –26.0 | –5.97 (0.02) | –56.0 |
| Gender | 0.03 (0.01) | 0.1 | –0.50 (0.15) | –4.7 |
| Born abroad | –0.31 (0.12) | –1.7 | 1.31 (0.05) | 12.3 |
| Sum | –15.7 | –2.9 | ||
Note: Percentages are interpreted as the expected share of the voting gap that would disappear if the bottom education/income quintile had the same levels on a given explanatory variable as the top quintile (or visa-versa, both scenarios weighted equally). Negative values suggest that the gap would be even larger if the two groups had the same levels.
If we look at the first block of predictors – those measuring satisfaction with the system – we see that they together account for 14 percent of the educational gap and 21 percent of the income gap. Among the survey items in this group, it is, The system allows people like you to have influence and Feel closer to any of the parties that explain the most on their own. Still, in the counterfactual world where citizens with very different levels of income and education have the exact same beliefs on all these nine opinion variables, at least 80 percent of the gap in voting would remain.
For comparison, we also included a set of predictors measuring a respondent’s internal efficacy, that is, one’s ideas on own political abilities and interests. These variables explain a little more of the voting gap than the previous block (20 percent for education; 22 percent for income). If we look closer, however, it is clear that within this block, one survey item – Interest in politics – does almost all the work (17 percent for both income and education).Footnote 4
Further, to separate the explanatory power of sociodemographic variables that are correlated with the first two blocks of opinion variables, we include a set of socio-demographic variables in the model. These are presented in the third block. They show, unsurprisingly, that equalizing income would reduce some of the educational gap in voting, and vice versa.Footnote 5
In the next step, we used the Oaxaca-Blinder method to decompose income and educational gaps in the alternative forms of participation. The results of this are summarized in Figure 9.5, which plots for each form of participation the percentage of the gaps explained by differential satisfaction with the system (i.e., the sum of the first block of predictors in Table 9.1). Two of the activities – working in organizations and wearing a campaign badge – would see the income/education gaps reduced about as much as voting (15–20 percent) if satisfaction with the system were equalized. The other six activities, however, would see less of a reduction or almost none. Inequalities in terms of who contacts politicians, works in parties, and signs petitions would be almost unchanged.
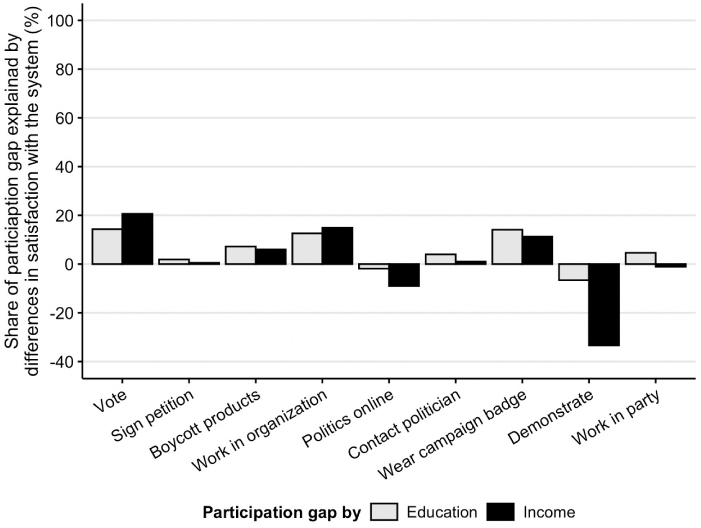
Figure 9.5 The power of differential satisfaction with the system in explaining differences in participation across income and education
Note: Estimated with Oaxaca-Blinder Decomposition using the same model as presented in Table 9.1 for different forms of participation.
In the last part of the analysis, we look at variation across countries in terms of how participation gaps would change if people at high/low income and education had the same satisfaction with the system. We do this for voting since it showed some of the largest reductions among the different forms of participation. Furthermore, since the Oaxaca-Blinder models are computationally demanding, we employ a simpler way of estimating the effect of equalizing beliefs about the system. Specifically, we estimate an OLS model for each country where the dependent variable is a vote dummy, and the main independent variable is a dummy for whether the respondent is in the first or fifth education quintile (only respondents in one of the two groups are included in the analysis). We also include the set of sociodemographic variables from the third block in Table 9.1. From there, we compare the coefficient for the education dummy with the same coefficient after we add the nine variables measuring satisfaction with the political system to the model. The difference represents the amount that the voting gap between the first and fifth education quintiles is reduced when holding constant these nine variables. We then do the same for income.
Figure 9.6 shows the results of this analysis. As one would expect, most of the countries follow the general pattern of little difference before and after taking satisfaction with the system into account. This goes for countries such as France, Germany, Sweden, and the Netherlands. On the other hand, in some of the Eastern European countries, such as Bulgaria, Lithuania, and Latvia, differential beliefs about the system explain more of the voting gaps than in most other countries. However, in none of the countries that have substantial voting gaps in the first place (e.g., above 5 pp), would the gap reduce by more than half if satisfaction with the system had been equal for income and educational groups?
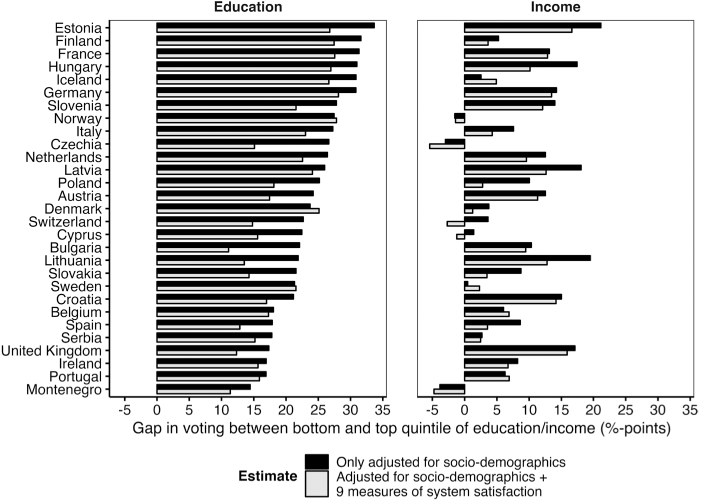
Figure 9.6 Country variation in the voting gap by income and education
Discussion
Over the past two decades, research has shown that representation of political preferences in established democracies tends to favor the richer and more-educated citizens. Since these findings present a severe challenge to the democratic idea of political equality, scholars have sought to find the various causes for the gaps in representation. One of the main explanations that has been discussed, even before the actual representational inequalities were demonstrated, is unequal participation. There tend to be structural inequalities that make it more or less likely for citizens to participate, mainly centering around the idea that individuals are facilitated in their political engagement through their resources (i.e., time, money, and skills). Consequently, those who participate more determine election outcomes, communicate their preferences, and are strategically better catered to by politicians who seek reelection. Indeed, while this area needs more research, there are some studies that have found a link between unequal participation and representation – even if it may not be the main explanatory factor.
However, because there are good arguments for the idea that people decide not to participate because they do not experience representation (while they may observe it for others), we are presented with an endogeneity problem. In this chapter, we sought to address this problem, at least in part, by examining whether participation gaps would narrow if the rich and poor, and more and less educated, would view the political system as equally well functioning. We find, in overall terms, that these participation gaps would likely be reduced in such a scenario – but only in limited ways.
Although there seems to be some support in the data for the argument that the poor and low educated participate less because they feel the system is not working properly, such perceptions account for a rather small part of the gaps in political participation across income and educational groups (15–20 percent for voting; less for other forms of participation). And in fact, if anything, we are probably overestimating rather than underestimating the effects. The reason for this is that the results from the Oaxaca-Blinder models assume that all of the relationship between satisfaction with the system and participation is causal. To the degree this is not the case (and the relationship is, for instance, explained by people viewing the system more favorably as a result of participating), the gap would see an even smaller change as a result of equalizing beliefs about the system. Moreover, it is not certain that having perfectly equal political representation at the system level would in fact equalize beliefs about the system. The poor and low educated could distrust the system for other reasons than unequal representation. Therefore, we should be careful when inferring from our analysis a specific amount by which unequal participation would be reduced if the political system was perfectly equally representative. Given the ways in which we are likely to overestimate that quantity here, a gap reduction on the order of 15 to 20 percent should be viewed as an upper bound.
While the reduction in the gap does not appear that large, it needs to be noted, however, that even such smaller effects may be consequential. We mentioned that the relationship between representation and participation is likely to go in both directions, at least to some extent. This means that if unequal participation exists, it may lead to (more) unequal representation. This in turn would affect gaps in participation somewhat, which then again translates into increased representational inequality. So, even if the effect of unequal representation on participation is minimal, we may be observing a part of the vicious cycle we highlighted earlier. Importantly, this cycle may reach a (an unspecified) threshold level, with potentially severe consequences for democracy. On the one hand, we could conclude that certain systems are in fact no democracies at all, but rather oligarchies (or plutocracies). On the other hand, however, we may in the future observe a strong, potentially revolutionary reaction among citizens who do not accept to be underrepresented while being told they are. Such processes have uncertain outcomes and may lead to even worse situations.
Finally, while most studies have found unequal representation of richer citizens, we see that, especially, education is a dividing factor regarding participation. And indeed, some research has already suggested that, at least in some contexts, the educational representational gaps are more important than the ones based on income (Mathisen Reference Matthews and Kerevel2022; Schakel Reference Schakel2021). Other research has also highlighted the importance of educational divides in politics (e.g., Bovens and Wille Reference Bovens and Wille2017; Gallego Reference Gallego2010), and it suggests that cleavages may have shifted within society. It also suggests that research should perhaps focus more deeply on the relation between education and politics, paying also special attention to potential country difference.


 Open access