


Introduction
Global seafood consumption and aquaculture production expanded greatly in the past 50 years, doubling world per capita fish consumption (FAO, 2020). With the increase in fish consumption, seafood has become one of the most highly globally traded food types (Anderson et al., Reference Anderson, Asche and Garlock2018). Worldwide per capita seafood consumption reached a record high of 45.2 lbs. in 2018 (FAO, 2020). The United States experienced a similar increase in seafood consumption, posting an all-time high of 19.2 lbs. per capita in 2019 (National Marine Fisheries Service, 2021). The Dietary Guidelines for Americans 2020–2025 Footnote 1 promote fish as a healthy source of protein. The Guidelines particularly emphasize the benefits of consuming trout and salmon as natural sources of vitamin D and omega-3 fatty acids. Further motivation for this increasing per capita consumption can be attributed to consumers’ growing preferences for healthy proteins, particularly during the COVID-19 pandemic (Roberts, Reference Roberts2021). Other concerns, especially among younger consumers, relate to sustainability, leading retailers to partner with seafood suppliers to increase sustainable seafood offerings.
Despite this growing domestic demand, U.S. aquaculture has not kept pace. Aquaculture production in the United States grew from 866 million pounds in 1996 to 1.3 billion pounds in 2004 but then fell to 875 million pounds in 2011 (FAO, 2020). Despite this contraction, the U.S. aquaculture industry shows signs of recovery and produced approximately 1 billion pounds in 2018 (FAO, 2021). However, domestic fish supply still relies heavily on imports. The current gap in seafood trade can be attributed to capture fisheries reaching sustainable levels, while domestic fisheries and the aquaculture industry concomitantly struggle to compete with import prices (FAO, 2020). Between 70% and 85% of U.S. current seafood consumption is imported, making the United States the world’s second-largest fish importing market after the European Union (Gephart et al., Reference Gephart, Froehlich and Branch.2019; National Marine Fisheries Service, 2021).
Geographically, most aquaculture operations are concentrated in the Southern region of the United States. The North Central Region (NCR),Footnote 2 despite hosting favorable climate conditions and abundant water resources, accounts for fewer than 10 % of U.S. fish farms and produces less than 4% of sales (USDA, 2019). NCR states could potentially supply the growing U.S demand for cold-water species, including rainbow trout (Oncorhynchus mykiss) and cool-water species such as walleye (Sander vitreus) and yellow perch (Perca flavescens), presenting an opportunity for development and expansion.
Salmonids, including Atlantic salmon, Pacific salmon, and trout, grew from 57% of food fish imports by volume in 2013 to 72% in 2018 (USDA ERS, 2019). Although salmon leads grocery store retail sales by volume (Goldschmidt, Reference Goldschmidt2020), the volume of rainbow trout imports increased 79% between 2014 and 2018 (USDA ERS, 2019). Domestic production, on the other hand, increased at a lower 6% between 2013 and 2018 (USDA, 2019). Furthermore, the yellow perch market faces significant shortages and most domestically consumed walleye is imported from Canada, though U.S. Great Lakes source a limited Native American commercial harvest.
Though the NCR produces roughly 3% of the fish farmed in the United Sates, producers in the region are particularly poised to meet the growing need for fish due to their unique geography proximal to the Great Lakes and access to freshwater. However, information about the marketability and demand for NCR-produced fish are needed to justify expanding aquacultural production in the region.
This paper seeks to fill the current knowledge gap and support the NCR aquaculture industry by helping producers, processers, and retailers target U.S. fish consumers. In particular, we collected primary survey data from U.S. adult fish consumers to investigate whether they value fish produced in the NCR, if they are willing to buy farm-raised fish, and which species and attributes they seek. To elicit the value attributed to fish originated from NCR states, we conducted a hypothetical discrete choice experiment (DCE) to estimate consumers’ willingness to pay (WTP) for an NCR-sourced label. We also measure consumer WTP for wild-caught fish and fresh fillets to see which harvesting methods and preparations U.S. fish consumers seek when they shop for fish. To facilitate this analysis, we presented respondents with six choice scenarios and varied our chosen attributes over rainbow trout, walleye, and yellow perch in a simulated purchasing experience. Our analysis focuses on these three species given the prominence of each to the regional tradition of fish production, NCR gastronomic culture, biological adaptation to the region’s climate, and pronounced trade imbalances. Our results can inform domestic producers and exporters of the demand and potential markets beyond the NCR.
This paper also addresses a gap in the literature concerning variation in regional preferences for these species and important seafood attributes. The current literature reports either transnational or nationally aggregated consumer purchasing behavior and preferences for other finfish and shellfish species or considers a limited geographic extent. Other studies focus on a different selection of seafood products and species (Brayden et al., Reference Brayden, Noblet, Evans and Rickard.2018; Bouchard et al., Reference Bouchard, Camire, Davis, Shaler, Dumont, Bernier and Labbe.2021; Tian et al. Reference Tian, Croog, Bovay, Concepcion, Getchis and Kelly.2021), different regions (Printezis et al., Reference Printezis, Grebitus and Hirsch.2019; Bouchard et al., Reference Bouchard, Camire, Davis, Shaler, Dumont, Bernier and Labbe.2021), only one state (Quagrainie et al., Reference Quagrainie, Hart and Brown.2008; Tian et al. Reference Tian, Croog, Bovay, Concepcion, Getchis and Kelly.2021), or only one city (Fonner and Sylvia, Reference Fonner and Sylvia.2015). Further, many of these studies limit their analysis to products of aquaculture alone (Quagrainie et al., Reference Quagrainie, Hart and Brown.2008; Runge et al., Reference Runge, Shaw, Witzling, Hartleb, Yang and Peroff.2021). Specifically, our analysis fills a knowledge gap concerning NCR and national WTP for increasingly popular cool- and cold-water fish in the domestic markets. We also address consumer preferences for search and credence attributes including wild-caught and farm-raised systems, fillets sold fresh or frozen at retail points, and “localness” encompassing the whole NCR.
The next section describes the current structure of the NCR aquaculture industry, including farms and species produced. The following section describes U.S. consumer fish preferences. We then outline our consumer survey instrument, including the DCE specifically tailored for NCR species. We present results before discussing the implications of our findings. Finally, we conclude with a summary and opportunities for expanding our research.
The NCR aquaculture industry
The NCR spans from the Great Lakes Region to the Great Plains, has plentiful water resources, and experiences a seasonally cold climate. The region produces a wide variety of seafood species (Batterson, Reference Batterson, Taylor, Lynch and Leonard2013) with strength in the food fish production of trout, yellow perch, and sport fish production of largemouth bass, which is also sold as food fish, and walleye (Table 1). Other species produced in the region include catfish, tilapia, carp, hybrid striped bass, crawfish, shrimp (saltwater), prawns (freshwater), ornamental fish, and baitfish. Most NCR trout farms are in Wisconsin, Michigan, and Nebraska, but trout farms can be found in all other NCR states except North Dakota. Yellow perch production is strong in Ohio and Wisconsin, but it is also produced in Michigan and Minnesota.
Table 1. Total number of farms and sales reported by NCR Aquaculturea
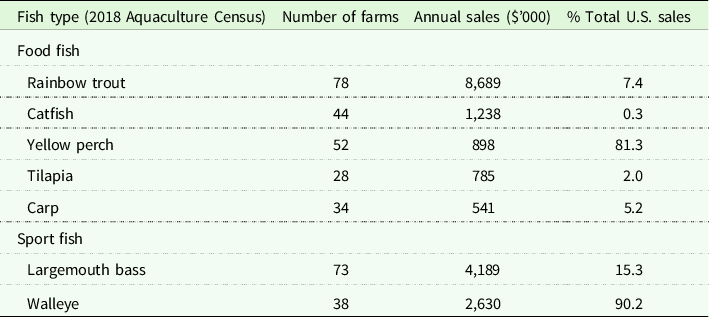
a Source: 2018 USDA Aquaculture Census.
Rainbow trout (Oncorhynchus. Mykiss), though nonnative, is an important species in the NCR. It is a typical cold-water fish that thrives in the climatic conditions of the Great Lakes region (Kinnunen, Reference Kinnunen2000; Hinshaw et al., Reference Hinshaw, Fornshell and Kinnunen.2004). In 2005, the NCR accounted for 28% of all U.S. trout farms and 9% of national sales (USDA, 2006), but regional production contracted modestly to 23% of total farms and 7% of national sales in 2018 (USDA, 2019) and nationally, trout generated $12.4 million dollars in exports in 2018 (USDA ERS, 2019). Presently, the NCR produces less than 8% of total domestic trout value (USDA ERS, 2019) but boasts 90.2% of U.S. walleye (Sander vitreus) production and 81.3% of U.S. yellow perch (Perca flavescens) production (USDA, 2019). Once abundant in the Great Lakes, commercial fisheries serviced the large domestic demand for yellow perch and walleye, solidifying the two species in the gastronomic traditions of the region (Riepe, Reference Riepe1999; Malison, Reference Malison2003; Summerfelt et al., Reference Summerfelt, Clayton, Johnson and Kinnunen.2010).
Walleye is regionally important as both a sport fish and a food fish; increasingly becoming a food fish in recent decades. In the late 1990s, recreational sport fishing crowded out the commercial walleye catch in the United States (Riepe, Reference Riepe1999). Today, only Native American commercial fishers may harvest walleye in the U.S. waters of Lakes Huron, Michigan, and Superior: no harvesting is allowed for state-licensed commercial fisheries. Due to these regulations, domestic walleye landings cannot satisfy domestic walleye demand. The domestic walleye catch pales in comparison to the Canadian catch. In 2020, imported Canadian walleye accounted for 1,300 metric tons, equivalent to nearly 3 million lbs. and $17 million U.S. dollars (USDA FAS, 2021). Walleye’s biological characteristics make it a good fit for aquacultural production, while its excellent flesh quality and palatability make it a popular food fish (Kinnunen, Reference Kinnunen and Summerfelt1996; Summerfelt et al. Reference Summerfelt, Clayton, Johnson and Kinnunen.2010). With a relatively high market value, walleye is considered an opportunity for the NCR aquaculture industry’s growth and development (Summerfelt et al. Reference Summerfelt, Clayton, Johnson and Kinnunen.2010). As such, walleye received the NCR priority species designation for financial support and research funding through the 1990s (Riepe, Reference Riepe1999).
Yellow perch is another historically important species in the Great Lakes region, and it also bears the NCR priority species designation. Like walleye, yellow perch is particularly adapted to the seasonal cycle of the lower NCR temperate systems (Hokanson, Reference Hokanson1977; Linkenheld, Reference Linkenheld2019) making it an ideal candidate for aquacultural development in the region. During the twentieth century, the international supply of yellow perch came from capture fisheries in the Great Lakes region of the United States and Canada (Malison, Reference Malison2003). Wild catch exceeded 33 million lbs. annually in the 1950s and 1960s but fell significantly to 11–18 million lbs. by the end of the century (Malison, Reference Malison2003). With its natural population in decline since the 1980s, aquaculture and the Canadian Lake Erie commercial fishery currently service U.S yellow perch demand. Canadian imports alone accounted for 155 metric tons in 2020, the equivalent to $4.2 million dollars (USDA FAS, 2021). On a smaller scale, there is a limited U.S. state-licensed commercial fishery for yellow perch in Lake Huron’s Saginaw Bay and Lake Michigan’s Green Bay in addition to Native American commercial fisheries in Michigan.
U.S. consumer preferences for fish
U.S. per capita seafood consumption grew 10.3% between 2009 and 2019 (National Marine Fisheries Service, 2021). Most of this growth can be attributed to an increase in the consumption of fresh and frozen seafood, while per capita consumption of canned and cured seafood products held constant (National Marine Fisheries Service, 2021). With increasing frequency, consumers choose seafood to meet their dietary needs based on the abundance of omega-3 fatty acids, low fat content, and high protein content it affords (Averbook, Reference Averbook2018; de Boer et al., Reference de Boer, Schösler and Aiking.2020; Runge et al., Reference Runge, Shaw, Witzling, Hartleb, Yang and Peroff.2021).
Consumer preferences and consumption trends ultimately reflect individual definitions of quality, which in turn is a multidimensional attribute constructed from perceptions of a combination of traits (Wirth et al., Reference Wirth, Stanton and Wiley.2011). As a result, retail seafood products may be thought of as “bundles of characteristics” composed of many search, experience, and credence attributes (Ward et al., Reference Ward, Lusk and Dutton.2008; Ahmad and Anders, Reference Ahmad and Anders.2012; Alfnes, et al., Reference Alfnes, Chen and Rickertsen.2018). Consumers can readily observe “search” attributes, like prices, at the time of sale. In contrast,“experience” attributes require an interaction, such as eating, to discern. “Credence” attributes are most difficult to verify, even after handling or consumption, and are imparted through labels. In the case of seafood, search attributes include species, price, and form of the product (such as fresh or frozen). The latter, if taken as a search attribute, subdivides into a range of possible attributes such as convenience and flavor. Nevertheless, choices between fresh and frozen can be associated with individuals’ previously experienced taste, blurring the lines that separate this classification of attributes. However, flash-freezing technology has improved the quality of frozen fish in comparison to fresh fish, rendering attributes such as fresh (not previously frozen) and frozen imperceptible and therefore credence attributes. In blind taste tests, consumers prefer flash-frozen samples to never-frozen-fresh samples (Kinnunen and Pisitis, Reference Kinnunen and Pistis.2007; Cox et al., Reference Cox, Colonna, Norton, Mackey, Behnken, Cobb, Lovewell, Rasor, Pelissier, Oborne and Bowman.2017).
At present, whether fish is sold fresh or frozen plays an important role in framing consumer fish choices. Consumers face many forms of fish products at seafood retail counters and freezer cases from live, undressed whole to processed frozen fillets. National scanner data show most seafood expenditures go to frozen products with just 18% spent on fresh seafood products (Gorstein and Larkin, Reference Gorstein and Larkin.2014). Fresh fish is considered least affordable based on consumer perceptions, and cost is the most influential attribute for consumer purchasing decisions (42% of respondents), followed closely by taste (41%) and healthfulness (30%) (Averbook, Reference Averbook2018). In some instances, the preference for fresh seafood over frozen is specific to a geographical region or species (Foltz et al., Reference Foltz, Dasgupta and Devadoss.1999). For example, when U.S. consumers were presented with fresh tilapia versus previously frozen tilapia, consumers in Colorado exhibited a $2.67/lb. lower WTP, while consumers in Florida showed a $4.47/lb. WTP premium; consumers were indifferent about the form of salmon and tuna (Meas and Hu, Reference Meas and Hu.2014). More recently, consumers report purchasing equal shares of fresh fish and frozen fish and viewing frozen foods as equally nutritious to their counterparts (Averbook, Reference Averbook2018). Our choice experiment presents the form of fish at retail, a search attribute, as either fresh fillets or frozen fillets.
Similarly, whether fish was wild-caught or farm-raised can be considered a credence attribute because it cannot be consistently perceived or identified by consumers in the absence of a label (Sogn-Grundvag et al., Reference Sogn-Grundvåg, Larsen and Young.2014). WTP estimates for wild-caught fish are neither widespread nor uniform in the literature, and evidence shows geographic heterogeneity in preferences for production method (Jaffry et al., Reference Jaffry, Pickering, Ghulam, Whitmarsh and Wattage.2004; Davidson et al., Reference Davidson, Pan, Hu and Poerwanto.2012; Roheim et al., Reference Roheim, Sudhakaran and Durham.2012; Uchida et al. Reference Uchida, Onozaka, Morita and Managi.2014; Rickertsen et al., Reference Rickertsen, Alfnes, Combris, Enderli, Issanchou and Shogren.2016). Nationwide, consumer surveys show that 36% of consumers report searching for wild-caught fish while only 14% report seeking out farm-raised fish, but the equal shares of regular buyers of seafood buy farm-raised and wild-caught fish (Kraushaar, Reference Kraushaar2014; Averbook, Reference Averbook2018). For example, Hawaiian consumers are willing to pay a premium for wild-caught fish (Davidson et al., Reference Davidson, Pan, Hu and Poerwanto.2012). A 2012 study of consumers in Colorado and Florida found no positive WTP for wild-caught salmon or tuna relative to farm-raised, a $2.98/lb. discount for wild-caught or farm-raised Salmon, and a $6.69/lb. discount for wild-caught tuna (Meas and Hu, Reference Meas and Hu.2014). Other studies have focused on those in Europe and China, where per capita seafood consumption is much higher (Menozzi et al., Reference Menozzi, Nguyen, Sogari, Taskov, Lucas, Castro-Rial and Mora.2020; Zheng et al., Reference Zheng, Wang and Shogren.2021). The number of studies estimating WTP for wild-caught or farm-raised fish, especially those of U.S.-based consumers, are few but indicate a positive WTP for wild-caught fish that may vary across species (Maesano et al., Reference Maesano, Di Vita, Chinnici, Pappalardo and D’Amico.2020) or seafood product (Brayden et al., Reference Brayden, Noblet, Evans and Rickard.2018).
Consumers sometimes associate health and environmental impacts with the two forms of production. In part, wild-caught preferences can be attributed to the perception of wild-caught fish as more “natural” and better quality, consumer apprehension regarding the environmental impact of aquaculture farms, and lack of trust in farm production systems (Whitmarsh and Palmieri, Reference Whitmarsh and Palmieri.2011; Claret et al., Reference Claret, Guerrero, Ginés, Grau, Hernández, Aguirre, Peleteiro, Fernández-Pato and Rodríguez-Rodríguez.2014; Runge et al., Reference Runge, Shaw, Witzling, Hartleb, Yang and Peroff.2021). In contrast, the Aquaculture Stewardship Council (ASC) reports more than half of seafood consumers are indifferent between wild-caught and farm-raised fish, if production is environmentally and socially responsible (Holland, Reference Holland2020). Moreover, 69% of the ASC report respondents stated they bought both farmed and wild-caught products or did not know which production method was used. This international survey reported respondent consensus prioritizing responsibly produced food. Further, 29% of respondents believed purchasing farm-raised fish provides positive ecological impacts by preserving wild stocks, and 40% agreed that significantly more farm-raised seafood should be consumed globally. In the United States, consumers report growing trust in fish farmers and government regulatory agencies and understand that aquaculture reduces pressure on wild stocks (Runge et al., Reference Runge, Shaw, Witzling, Hartleb, Yang and Peroff.2021). Aquaculture standards and fishery management practices improved steadily over the last decade, which has catalyzed a worldwide movement to demystify the “wild versus farmed” debate to benefit both capture fisheries and aquaculture industries (Hill, Reference Hill2020).
Given the prominence of trout as a farmed commodity domestically, the familiarity of NCR residents with walleye as a sport fish, and evidence of consumer nonattendance toward wild-caught fish, one would expect our estimates to vary compared to the localized studies of the extant literature. The two production alternatives presented to consumers are wild-caught or farm-raised. Ultimately, the ability of NCR and U.S. aquaculture to serve domestic demand rests on the willingness of consumers to purchase farm-raised products. A strong preference for wild-caught fish would imply further reliance on landings from Canada.
Another example of a credence attribute is “locally sourced,” which is often sought due to concerns about health, nutrition, and food safety (Wirth et al., Reference Wirth, Stanton and Wiley.2011). Fish products sold in the United States must bear a country-of-origin label (COOL), but these labels do not necessarily convey state or region of production in the United States (Mandatory Country of Origin Labeling of Beef, Pork, Lamb, Chicken, Goat Meat, Wild and Farm-Raised Fish and Shellfish, Perishable Agricultural Commodities, Peanuts, Pecans, Ginseng, and Macadamia Nuts, 2013). Labels indicating the fish geographic origin or source are known to affect consumer seafood preferences (Brayden et al., Reference Brayden, Noblet, Evans and Rickard.2018). Some studies show consumers find it only “somewhat” important to purchase locally produced or farm-raised fish (Gvillo et al., Reference Gvillo, Quagrainie, Olynk and Dennis.2013; Runge et al., Reference Runge, Shaw, Witzling, Hartleb, Yang and Peroff.2021), indicating the term “locavore” has yet to cross over from beyond terrestrial food products to seafood. More recently, supply chain disruptions during the COVID-19 pandemic were especially severe for meat products and seafood (Arita et al., Reference Arita, Grant, Sydow and Beckman.2021), expanding the benefits of local production beyond healthy and food safety concerns to food security. Stated preferences for locally sourced food fish have been previously reported in Europe (Altintzoglou et al., Reference Altintzoglou, Verbeke, Vanhonacker and Luten.2010; Risius et al., Reference Risius, Janssen and Hamm.2017) and have been elicited more recently in the United States (Runge et al., Reference Runge, Shaw, Witzling, Hartleb, Yang and Peroff.2021). A survey of Wisconsin-based seafood consumers identified preferences for fish sourced locally or in the United States relative to imported alternatives (Shaw et al., Reference Shaw, Runge, Yang, Witzling, Hartleb and Peroff.2019; Runge et al., Reference Runge, Shaw, Witzling, Hartleb, Yang and Peroff.2021). While certain regions in the United States hold strong historical affinities for certain seafood species, evolving attitudes regarding the health and welfare of seafood have changed the landscape nationally. We capture the consumer WTP for NCR state-sourced fish compared with non-NCR-sourced fish through our choice experiment design. Within the NCR, the NCR-sourced designation serves as a proxy for local production or landing.
As the lines between search, experience, and credence attributes change for fish and seafood due to farm production and preservation technology improvements, the consumer preferences for these attributes should also adjust. This paper estimates consumers’ WTP for fish search attributes including species and fresh versus frozen fillets, as well as wild-caught versus farmed. We produce national and NCR-specific WTP estimates using a hypothetical choice experiment of trout, walleye, and yellow perch to identify whether these attributes attract premia.
Consumer survey
Data
We collected the data for this analysis by constructing and distributing an online survey instrument using QualtricsXM in the fall of 2020. The survey featured screening questions, a consequentiality statement (Zheng et al., Reference Zheng, Wang and Shogren.2021), an image illustrating the geography and states of the NCR, a DCE, and a demographics section. Qualtrics recruited adult respondents from across the United States through email and provided them with compensation for participation. The choice experiment designed for this study, described below, asked respondents to consider a hypothetical purchasing scenario typical of a fish retailer. This required us to include respondents who prepared and ate fish at home and screen out those who only dined on fish away from home. Further, our targeting of fish consumers, as opposed to seafood consumers, removes those who reported eating only crustaceans and/or mollusks from the sample.
A pilot study of 106 respondents preceded the full survey release to provide a quality check on the suitability of the questions, survey flow, and display logic. After full distribution, we discarded any respondents who fell outside the sampling frame, did not complete the survey, failed a speed test, or submitted multiple survey responses from the final sample.
After screening and quality control, the final sample consisted of 876 respondents. Summary statistics for the demographics of the respondents are presented in Table 2. According to the 2019 American Community Survey (U.S. Census Bureau, 2020), one in five Americans lives in the NCR and our sample is proportionate in composition. Our sample skews slightly more female, younger, and lower on the income spectrum than is nationally representative.
Table 2. Summary of consumer demographics (N = 876)

a Source: American Community Survey 2019 1-Year Estimates.
b Due to differences in the classification of race and ethnicity, the national race statistics do not sum to one and “Hispanic” overlaps with other categories.
Discrete choice experiment
In the DCE portion of our survey, respondents faced several hypothetical purchasing choice scenarios (Appendix Figure 1). Each choice scenario presented attributes across alternatives to force respondents to make trade-offs between species and attributes. Each choice scenario included three labeled alternatives (trout, yellow perch, and walleye) and a no-buy option to simulate a real purchasing situation (Lusk and Schroeder, Reference Lusk and Schroeder.2004; Scarpa et al., Reference Scarpa, Ferrini, Willis., Scarpa and Alberini2005). Each alternative was accompanied by a picture of species-specific fillets. Attributes varied over the alternatives according to levels presented in Table 3. Prices ranged from $9 to $16 in dollar increments for each alternative, producing eight price levels. Footnote 3 We chose price levels conservatively to avoid biasing WTP results up due to large magnitude price vectors (Glenk et al., Reference Glenk, Meyerhoff, Akaichi and Martin-Ortega.2019). The two production methods considered were farm-raised and wild-caught. Each alternative was labeled as “NCR sourced” or “Not NCR sourced” to differentiate fish originating inside or outside the region. This grouping of non-NCR but U.S.-sourced fish with imported fish is like the categorization used in the analysis of Brayden et al. (Reference Brayden, Noblet, Evans and Rickard.2018). Each alternative bore a “Fresh Fillets” or “Frozen Fillets” label to reflect the availability of different forms at retail.
Table 3. Choice experiment attributes and levels
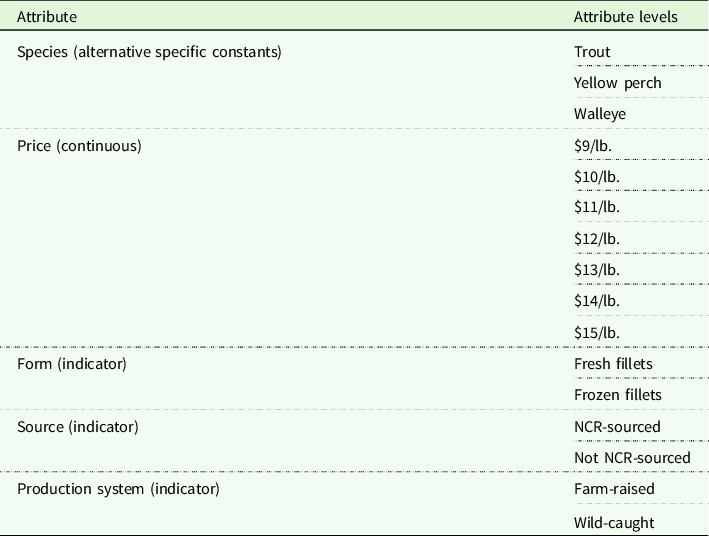
We constructed the experimental design for this study using NGene software. The combination of four labeled alternatives, eight prices, two regions of origin, two production methods, and two product forms yielded an untenable number of choice tasks under a full factorial design: 262,144 (83 × 23 × 23 × 23) different choice tasks. To address this dimensionality, we employ a simultaneous orthogonal factorial design Footnote 4 and subdivide the resulting 24 choice scenarios into 4 blocks. Each respondent faced just six choice scenarios randomly assigned from the four blocks to combat respondent fatigue Footnote 5 (Hanley et al., Reference Hanley, Wright and Koop.2002). This design achieved orthogonality within and across the attribute levels of alternatives to ensure pairs of attributes are uncorrelated while every pair of attributes occurred equally often to attain balance. The full design, an example of a choice scenario presented to respondents, and ex ante multinomial logit efficiency measures are found in the appendix.
Conceptual framework
Our conceptual framework follows McFadden’s random utility model (RUM) (McFadden, Reference McFadden and Zarembka1974). The utility of consumer n for fish alternative j can be decomposed into two components: observed component ${V_{nj}}$
and unobserved component
${V_{nj}}$
and unobserved component ${\varepsilon _{nj}}$
:
${\varepsilon _{nj}}$
:
 $${U_{nj}} = {V_{nj}} + {\varepsilon _{nj}}$$
This model forms the foundation of multinomial logit model assuming the unobserved utility component is identically and independently (i.i.d.) distributed following an extreme value type 1 distribution. Under this assumption, the probability of consumer n choosing fish alternative j is
 $${P_{nj}} = Prob\left[ {{V_{nj}} + {\varepsilon _{nj}} \gt \;{V_{ni}} + {\varepsilon _{ni}}} \right]\;\forall \;i \ne j{\rm{\;}}$$
 $$ = Prob\left[ {{\varepsilon _{nj}} \gt \;{V_{ni}} - {V_{nj}} + {\varepsilon _{ni}}} \right]\;\forall \;i \ne j$$
which is to say that the unobserved component of utility for every unchosen fish alternative i must be smaller than the differences between the observed component n and observed component for fish alternative i plus the unobserved component of fish alternative j.
Under the assumption of independence between unobserved utility components, we can multiply the probability for all i ≠ j to obtain the probability of individual n choosing alternative i and integrate the conditional probability over all possible ${\varepsilon _{nj}}$
values to obtain the closed-form equation:
${\varepsilon _{nj}}$
values to obtain the closed-form equation:
 $${P_{nj}} = \;{{\exp \left( {\beta '{x_{nj}}} \right)} \over {{\sum _i}\exp \left( {\beta '{x_{ni}}} \right)}}\;.$$
The multinomial logit has several limitations due to the strong assumptions required to obtain equation (4) (Henscher et al., Reference Hensher, Rose and Greene.2005). These include an inability to model random taste variation, the imposition of irrelevance of independent alternatives (IIA) property, and state independence. These challenges can be addressed with more flexible models like universal logit models, heteroskedastic extreme value models, random parameter logit (RPL) models, and error components models (ECM) (Lusk and Schroeder, Reference Lusk and Schroeder.2004; Scarpa et al., Reference Scarpa, Ferrini, Willis., Scarpa and Alberini2005; Scarpa et al., Reference Scarpa, Campbell and Hutchinson.2007).
In particular, ECMs provide desirable innovations because they can include random parameters as well as correlation between alternatives and the random parameters (Train, Reference Train2003). A random parameter logit with error component model (RPLEC) decomposes equation (1) into three components:
 $${U_{nj}} = \alpha ^\prime{x_{nj}} + \;{\mu _n}^\prime{z_{nj}} + {\varepsilon _{nj}}$$
where x
nj
and z
nj
are observed attribute vectors for fish alternative j, α represents fixed coefficients, μ represents random coefficients with zero means, and ${\varepsilon _{nj}}$
is the i.i.d. extreme value type 1 unobserved portion of utility. The random part of the utility specification is thus
${\varepsilon _{nj}}$
is the i.i.d. extreme value type 1 unobserved portion of utility. The random part of the utility specification is thus ${\eta _{nj}} = \;\;\mu _n^\prime{z_{nj}} + {\varepsilon _{nj}}$
, and this portion can exhibit correlation over alternatives for individual n. In the case of nonzero error components, consider individual i facing alternative i and alternative j:
${\eta _{nj}} = \;\;\mu _n^\prime{z_{nj}} + {\varepsilon _{nj}}$
, and this portion can exhibit correlation over alternatives for individual n. In the case of nonzero error components, consider individual i facing alternative i and alternative j:
 $${\rm{Cov}}\left( {{\eta _{ni}},\;{\eta _{nk}}} \right) = {\rm{\;E}}\left( {\;\mu _n^\prime{z_{ni}} + {\varepsilon _{ni}}} \right)\left( {\;\mu _n^\prime{z_{nk}} + {\varepsilon _{nk}}} \right) = z_{ni}^\prime{\rm{W}}{z_{nj}}{\rm{\;}}$$
where W is the covariance of μ n. Through these error component terms, utilities U ni and U nk are correlated so the utility of individual n is correlated across alternatives. In the hypothetical choice experiment context of this paper, we prefer error component random parameters logit models to handle heteroskedasticity emerging from correlation between the labeled fish species alternatives. We expect respondents to experience our hypothetical labeled fish alternatives differently than the no-buy option as respondents can only experience the no-buy option in reality (Scarpa et al., Reference Scarpa, Ferrini, Willis., Scarpa and Alberini2005, Reference Scarpa, Campbell and Hutchinson.2007).
Empirical estimation
We choose a panel logit specification with random parameters and error component to relax the strict assumptions of i.i.d. errors and account for correlation between choices and alternatives. This allows the choice model to exhibit more realistic substitution patterns, correlation between the utilities of the fish species, and correlation across the utilities associated with specific respondents. The random parameters and latent random effects may covary between the labeled alternatives but not between labeled alternatives and the no-buy option. This is modeled as:
 $${{U_{njt}} = {\alpha _{nj}} + \;{\beta _1}Pric{e_{njt}} + {\beta _{n2}}NCRSource{d_{njt}} + \;\beta {n_3}WildCaugh{t_{njt}} + \beta {n_4}Fres{h_{njt}} + {\eta _{nj}} + \;{\varepsilon _{njt}}}$$
where j = trout, yellow perch, and walleye; α
j
is the alternative specific constant relative to the “no buy” option; Price
njt
is the continuous price of alternative j for consumer n; NCRSourced
njt
is an indicator variable taking a value of 1 for NCR state origin; WildCaught
njt
is an indicator variable taking a value of 1 when alternative j is labeled wild-caught; and Fresh
njt
is an indicator variable taking a value of 1 when alternative j is labeled fresh. Each non-price attribute enters as a random variable ${\beta _{njt}} = \overline {{\beta _j}} + \;{\sigma _j}{\tilde \beta _{nj}}$
with population mean
${\beta _{njt}} = \overline {{\beta _j}} + \;{\sigma _j}{\tilde \beta _{nj}}$
with population mean ${\bar \beta _j},$
standard deviation
${\bar \beta _j},$
standard deviation ${\sigma _j},\;$
and individual-specific independently and identically distributed standard normal disturbance
${\sigma _j},\;$
and individual-specific independently and identically distributed standard normal disturbance ${\tilde \beta _{nj}}$
(Revelt and Train, Reference Revelt and Train.1998). Both correlation across utilities and heterogeneous alternative specific constant parameter can introduce stochasticity into the model and prevent a closed-form solution for the log-likelihood of the choice probability (Train, 2009). Due to this computational necessity, we employed a simulated maximum likelihood estimation strategy to perform integration and estimate probabilities. We used NLogit (Version 6.0, Econometric Software Inc.) to perform all estimation and simulation.
${\tilde \beta _{nj}}$
(Revelt and Train, Reference Revelt and Train.1998). Both correlation across utilities and heterogeneous alternative specific constant parameter can introduce stochasticity into the model and prevent a closed-form solution for the log-likelihood of the choice probability (Train, 2009). Due to this computational necessity, we employed a simulated maximum likelihood estimation strategy to perform integration and estimate probabilities. We used NLogit (Version 6.0, Econometric Software Inc.) to perform all estimation and simulation.
The estimates obtained from equation 7 can be used to estimate total and marginal WTP for fish attributes and alternatives. The total WTP for an attribute represents the amount an individual would pay to obtain attribute j relative to forgoing purchase. When the attribute in question is species, alternative specific constants are used to estimate the total WTP relative to the no-buy option (Lusk and Schroeder, Reference Lusk and Schroeder.2004). To obtain the total WTP for alternative j, we estimate
 $$WTP = - {{{\beta _j}} \over {{\beta _{price}}}}$$
where $WT{P_j}$
is the willingness to pay for the
$WT{P_j}$
is the willingness to pay for the ${j^{th}}\;$
attribute,
${j^{th}}\;$
attribute, ${\beta _j}$
is the coefficient associated with the
${\beta _j}$
is the coefficient associated with the ${j^{th}}$
attribute, and
${j^{th}}$
attribute, and ${\beta _{price}}$
is the price coefficient. In the context of this study, the WTP measures for the dummy variables
${\beta _{price}}$
is the price coefficient. In the context of this study, the WTP measures for the dummy variables $WildCaught$
,
$WildCaught$
, $Fresh$
, and
$Fresh$
, and $NCRSourced$
are relative to the base level, or converse label. They are thus interpreted as farm-raised to wild-caught, frozen fillets to fresh fillets, or not NCR-sourced to NCR-sourced. Further, all the species-specific WTP estimates are relative to the no-buy option as we normalize the utility of no-buy option to zero.
$NCRSourced$
are relative to the base level, or converse label. They are thus interpreted as farm-raised to wild-caught, frozen fillets to fresh fillets, or not NCR-sourced to NCR-sourced. Further, all the species-specific WTP estimates are relative to the no-buy option as we normalize the utility of no-buy option to zero.
We model each of the random attribute parameters using a normal distribution ${\beta _{nj}}\;\sim \;N\;\left( {\widehat {{\beta _j}}\;,{\sigma _j}} \right).$
As such, the WTP estimates for attributes (and alternatives) also follow normal distributions. Since this study seeks to identify the WTP estimates for attributes and species pertinent to NCR aquacultural production, the distributions provide illustrations of consumer valuation beyond mean WTP estimates. We use Krinsky and Robb’s bootstrapping approach (Krinsky and Robb, Reference Krinsky and Robb.1986; Lusk and Schroder, Reference Lusk and Schroeder.2004; Hensher et al., Reference Hensher, Rose and Greene.2005) with 1,000 simulated draws to obtain the parameters of these distributions.
${\beta _{nj}}\;\sim \;N\;\left( {\widehat {{\beta _j}}\;,{\sigma _j}} \right).$
As such, the WTP estimates for attributes (and alternatives) also follow normal distributions. Since this study seeks to identify the WTP estimates for attributes and species pertinent to NCR aquacultural production, the distributions provide illustrations of consumer valuation beyond mean WTP estimates. We use Krinsky and Robb’s bootstrapping approach (Krinsky and Robb, Reference Krinsky and Robb.1986; Lusk and Schroder, Reference Lusk and Schroeder.2004; Hensher et al., Reference Hensher, Rose and Greene.2005) with 1,000 simulated draws to obtain the parameters of these distributions.
Results
Our results demonstrate U.S. fish consumers are on average willing to pay premia for NCR-sourced fish, wild-caught fish, and fresh fillets. Further, we find significant, regionally varying heterogeneity in the WTP estimates for these attributes. We also find NCR-based consumers have similar WTP for trout, yellow perch, and walleye, while non-NCR fish consumers strongly prefer trout to walleye and yellow perch.
The simulated maximum likelihood estimation results are shown in Table 4 below. The first column corresponds to the panel logit with random parameters and error component (RPLEC) specification from equation 7. The second column includes a dummy interaction for respondents within the NCR for each attribute. This allows us to investigate heterogeneity in attribute means between fish consumers in the NCR (roughly 20% of the sample) compared to the rest of the United States. For each model, we estimate fixed parameters for the Price while all remaining attributes enter as normally distributed random coefficients. Estimated mean and standard deviation coefficients, as well as standard errors, are reported for these random parameters.
Table 4. Panel logit with random parameters and error components results

Standard errors in parentheses; *p < 0.1, **p < 0.05, ***p < 0.01.
First, we find evidence supporting our RPLEC specification, which models correlation in the unobserved component of utility between the three purchase options (labeled species alternatives). After comparing our results with several RPL models, we prefer our RPLEC models because they allow for more realistic correlation between the species alternatives, produce betters fit in terms of Akaike Information Criteria (AIC) and Bayesian Information Criteria (BIC), and generate estimates closer to observed prices in the market, and standard deviation of the error components are statistically significant (Table 4).
Consistent with consumer theory, the Price coefficient is negative and statistically significant at the 1% level. The statistically significant negative interaction between Price and the NCR indicator suggests that NCR fish consumers are more price-sensitive than other U.S. fish consumers. The mean coefficients for the other three non-species attributes are also statistically significant. This confirms the salience of our chosen attributes and indicates that U.S. fish consumers find fresh fillets preferable to frozen ones, NCRSourced labels increase consumer utility, and Americans choose wild-caught fish over farmed fish. However, the large standard deviations demonstrate taste variation in the market and underscore the importance of modeling heterogeneity. The estimated standard deviations for Fresh, NCRSourced, and WildCaught all exceed the estimated means. The estimated dummy interactions coefficients for Fresh, NCRSourced, and WildCaught suggest that the utility for NCR fish consumers are not meaningfully different from other Americans for these attributes.
The alternative specific constants for Trout, YellowPerch, and Walleye are positive and statistically significant in both specifications. As such, consumers across the United States prefer each of the three species in the choice set relative to the no-buy option. The species-specific mean and standard deviation estimates differ from the non-species attributes, because the first moments are much larger while each estimated standard deviation is smaller than the associated mean estimate. The NCR interactions in the second specification provide evidence that NCR fish consumers derive higher utility from each of the species in this study.
Though the signs are the same, the sizes of the Price, Fresh, NCRSourced, and WildCaught estimates differ across the two geographic samples, reflecting regional taste and preference variation. Particularly, seafood consumers in NCR states are significantly more price-sensitive than seafood consumers outside the region. Given the observed variation in price estimates, we forgo discussing the raw, unscaled maximum likelihood coefficients any further and instead proceed with comparing and interpreting the WTP estimates they produce.
Table 5 displays WTP estimates constructed from the RPLEC coefficients from Table 4 through Krinsky–Robb simulation. Footnote 6 The WTP estimates in the first column of Table 5 are constructed from the first column in Table 4, which specifies a fixed national price parameter. In contrast, the WTP estimates in the second and third columns of Table 5 use the region-specific price coefficients presented in the second and third columns of Table 4.
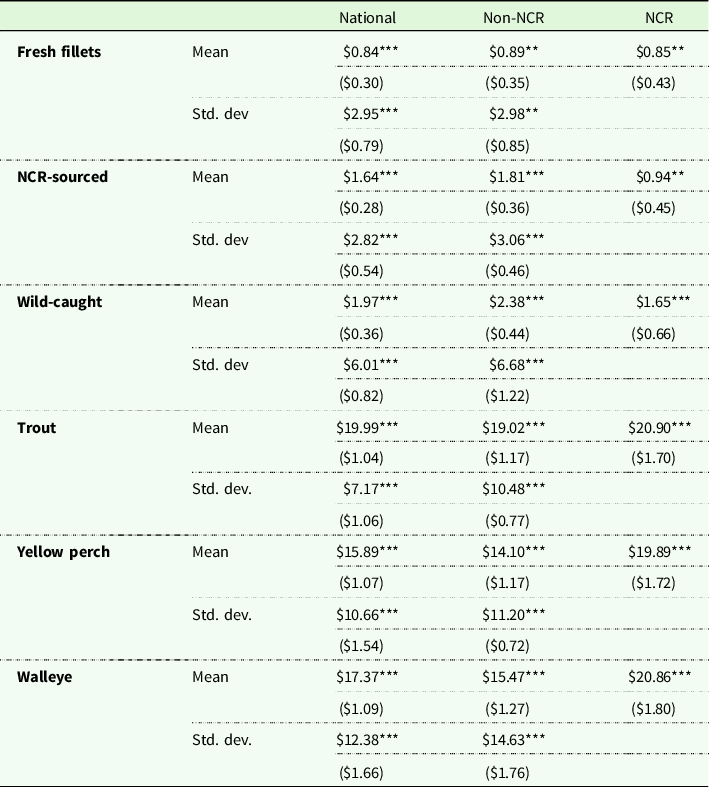
a WTP estimates obtained from RPLEC specification with 500 Halton draws. Standard errors are bootstrapped using the Krinsky–Robb method.
b Column 1 WTP estimates were constructed from the nationally pooled model with a single, fixed price. The column 2 Non-NCR and column 3 NCR WTP estimates were constructed from RPLEC coefficients, where NCR regionality is introduced with interaction terms for each attribute.
c Standard errors in parentheses; *p < 0.1, **p < 0.05, ***p < 0.01.
WildCaught commands the highest premium at $1.97/lb. followed by NCRSourced at $1.64/lb. and Fresh at $0.84/lb. The relatively small premium for fresh fillets relative to frozen fillets could be due to the convenience of frozen fillets, advances in freezing technologies, or a popular perception that frozen fish can improve food safety while reducing food waste, an understanding often encouraged by retailers (O’Donnell et al., Reference O’Donnell, Katz, Romey, Fulton, Croskey, Pearson and Deutsch.2021). Each of the standard deviation estimates for Fresh, NCRSourced, and WildCaught are statistically significant and at least twice as large the corresponding estimated means, highlighting the existence of U.S. fish consumers who prefer the opposite of each attribute and are willing to pay premia for frozen, sourcing outside the NCR, and farmed fish, respectively.
Taking the United States as one fish market, Trout commands the highest mean WTP at $19.99/lb. trailed by Walleye at $17.37/lb. and Yellow Perch at $15.89/lb. There is strong evidence of heterogeneity in the WTP estimates for each species given the size and significance of the alternative specific constant standard deviations. Within the NCR, the mean WTP estimates for all three species are clustered: Trout is highest at $20.90/lb., followed closely by Walleye at $20.86/lb., and Yellow Perch at $19.89/lb. Outside the NCR, mean WTP estimates exhibit more variation but all fall below $20.00/lb. at $19.02/lb. for Trout, $17.37/lb. for Walleye, and $15.89/lb. for Yellow Perch.
We performed Wald tests of equality between the WTP estimates from Table 5 to statistically test the magnitudes of the WTP estimates, draw conclusions about whether consumers are willing to pay more for attributes related to aquaculture, and gather evidence regarding regional attribute heterogeneity (Table 6). Nationally, U.S. fish consumers are willing to pay significantly more for either an NCR-sourced label or wild-caught label than fresh fillets. This provides important information for NCR aquaculture producers, suggesting that American fish consumers will accept and pay for frozen NCR-sourced products. However, there is no statistically significant difference between NCRSourced and WildCaught, though the mean value is higher for WildCaught. These findings are similar for fish consumers outside the NCR. Within the NCR, there is insufficient statistical evidence to conclude that the estimates for Fresh, NCRSourced, and WildCaught differ from one another, possibly due to insufficient power (the NCR is about 20% of our sample).
Table 6. Wald tests of equality of mean WTP estimates
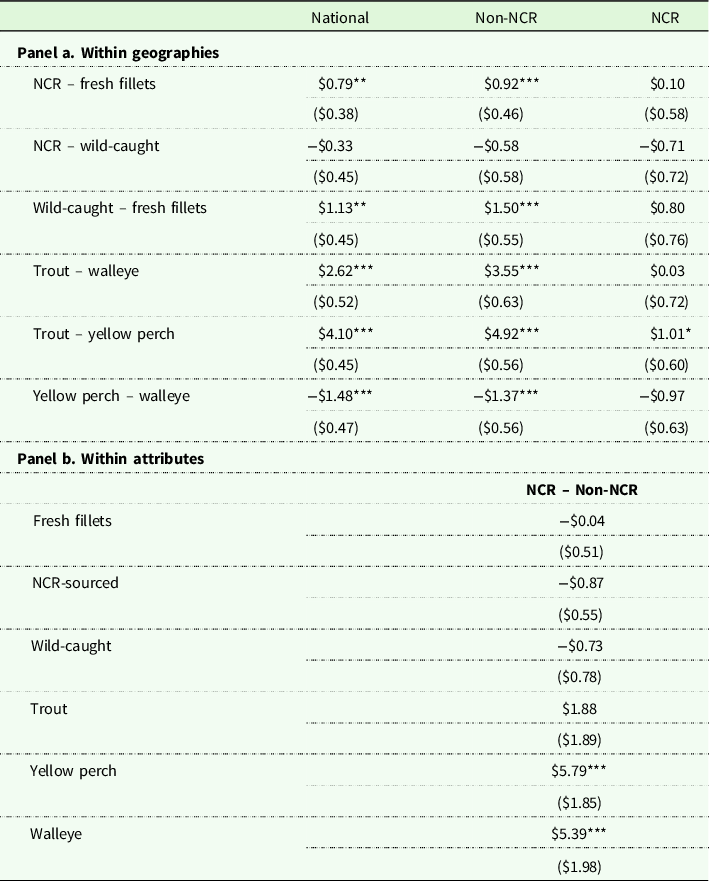
1. Panel a. presents results of Wald tests of equality between mean WTP estimates for attributes within geographies. The null hypothesis for each test is equality between the two mean WTP estimates.
2. Panel b. presents results of Wald tests of equality between mean WTP estimates for attributes comparing respondents from inside the NCR to respondents from outside the NCR. The null hypothesis for each attribute is equality between the NCR mean WTP estimate and non-NCR mean WTP estimate.
3. Standard errors are bootstrapped using the Krinsky–Robb method.
4. Standard errors are in parentheses; *p < 0.1, **p < 0.05, ***p < 0.01.
Trout commands a large, statistically significant premia over the other two species at the national level. On average, U.S. fish consumer WTP for Trout is $4.10/lb. higher than YellowPerch and $2.62/lb. higher than Walleye. These findings are led by major differences in the WTP for Yellow Perch and Walleye inside the NCR compared to outside. NCR fish consumers are willing to pay $5.79/lb. more for YellowPerch than their counterparts outside the region, on average (Panel b. of Table 6). Similarly, Walleye is valued at $5.39/lb. more in the NCR than other parts of the United States.
Discussion
Our results present several important implications for producers, distributers, and retailers marketing yellow perch and walleye in the NCR. First, and most importantly, we find strong evidence that U.S. seafood consumers prefer, and are willing to pay for, domestically produced fish sourced from NCR states. To our surprise, we cannot conclude that NCR fish consumers have a higher WTP for an NCR-sourced label than those outside the area. However, previous work has shown geographic heterogeneity in the value of localness, which could offset (Printezis et al., Reference Printezis, Grebitus and Hirsch.2019). For example, NCR residents, who consume walleye and yellow perch more regularly, may be more familiar with or indifferent to Canadian imports. Further, non-NCR residents may, on average, have stronger preferences for U.S. products than those in the NCR. We take this as evidence that fish-related “locavore” preferences extend beyond state lines and regions and that U.S fish consumers value labels reflecting NCR sourcing.
Consumers prefer wild-caught fish over farmed fish across the United States. Specifically, seafood consumers outside the NCR exhibit an average WTP of $2.38/lb, while inside the NCR, the estimated mean WTP for WildCaught is lower, but statistically indistinguishable from the rest of the U.S. fish market. While these results provide some evidence of relative homogeneity in mean WTP for wild-caught fish, the context of the species in this study must be highlighted. Previous studies have demonstrated that wild-caught WTP estimates vary based on the specific context of the choice task, alternatives, attributes, and respondent base. These results suggest that an NCR-sourced label can offset the distaste most U.S. fish consumers hold for farmed fish. Increasing consumer WTP for farm-raised fish is critical to increasing demand for aquacultural producers, and evidence of consumer indifference regarding harvest method under environmentally and socially responsible production suggests one way to use marketing to overcome this gap (Holland, Reference Holland2020).
Next, preferences for fresh or frozen fish options were rated the least important in the choice experiment compared to the location of origin or harvest method. Nevertheless, we obtained positive, significant WTP across all three samples for fresh fillets, suggesting a preference for the health benefits of fresh fish over convenience frozen alternatives. Nationally, consumer WTP is $0.84/lb. for fresh filleted fish compared to frozen fillets, and the most uniformly valued attribute across the NCR and non-NCR samples. This finding suggests that consumers value the convenience and safety of frozen fish options. Moreover, freshness may not play as large a role in ascertaining quality for consumers as it once did, especially when compared to source and production methods. That allows flexibility for the NCR seafood industry to expand the distribution of traditional NCR-sourced species to their loyal local demand and a wider captivated national demand.
Finally, U.S. fish consumers at large demonstrate a clear preference for trout over walleye and yellow perch. These finding suggest that aquaculture producers should focus on marketing walleye and yellow perch within the NCR as WTP is highest in the region. However, the greater takeaway is that NCR fish producers should intensify production of trout: it is as valuable in the NCR as walleye and yellow perch and much more valuable outside the NCR.
Conclusion
Per capita U.S consumption of seafood products and finfish has increased in recent decades, with demand met by an ever-growing supply of imported products. Aiming to promote the development of the U.S. aquaculture industry, we analyze consumers’ preferences for trout, yellow perch, and walleye, bearing different sources, forms, and growth environments. We designed and distributed a hypothetical DCE and obtained responses from 876 Americans from a nationally representative sample of seafood consumers. We estimate heterogeneous preferences for species and fish attributes using a panel logit with random parameters and error components. To capture geographic heterogeneity, we test WTP estimates from NCR residents relative to non-NCR state residents and find NCR fish consumers value their native species more than other Americans.
Trout, yellow perch, and walleye are each important species to NCR cultural traditions. A strong demand for these species endures in the NCR despite profound restructuring to the supply chain for yellow perch and walleye due to regulatory changes. Possibly led by this persistent gastronomic culture, we identify a pronounced preference for yellow perch and walleye in the NCR. Specifically, NCR consumers are willing to pay $20/lb–$21/lb. for each of the three species. Meanwhile, trout is nationally most preferred, commanding a $4.10/lb. premium over yellow perch and a $2.62/lb. premium over walleye. American seafood consumers are willing to pay an average $19.99/lb. for trout, $17.37/lb. for walleye, and $15.89/lb. for yellow perch.
Regarding the form of fish, this survey instrument presented respondents with hypothetical choice scenarios for alternatives defined as “fresh fillets” or “frozen fillets” for each of the three species. Although fish processors employ various processing, packaging, freezing, and thawing technologies which can affect the palatability, texture, and other product quality cues (Nagarajarao, Reference Nagarajarao2016), we presented respondents with the two most general forms consumers face at retail. While consumers valued fillet preparation least among the tested attributes, our results suggest a small but positive WTP for fresh fillets over frozen alternatives. Future research can augment this study by including consumer experience with different preservation technologies or knowledge and attitudes regarding quality cues of fresh versus frozen fish alternatives.
Our analysis also contributes to the active debate regarding consumer preferences for wild and farmed seafood. Consistent with many previous studies, we identify price premia for wild-caught fish for U.S. markets within and outside the NCR. This analysis assumes that wild harvesting constitutes a credence attribute as consumers cannot reliably perceive it through search or experience activities. If consumers can discern production methods based on their senses, one might expect that the presence of a label would be insignificant. Due to the magnitude and significance of our estimates, however, it appears the inclusion of wild-caught or farm-raised labels provides relevant, valuable information to consumers. However, our results also show a national preference for NCR-sourced fish in addition to other studies’ evidence of consumer growing indifference regarding harvest method under environmentally and socially responsible production. For NCR aquaculture producers, the important takeaway is that an NCR-source label can help offset the distaste most U.S. fish consumers hold for farmed fish.
Data availability statement
Replication materials are available at https://github.com/aprilathnos. The experimental design of the choice experiment was created in NGene. All estimates were obtained using NLogit software.
Acknowledgments
The authors thank our industry liaisons Phil Shambach, Dan Vogler, Bill Lynch, Ernie Birchmeier, and Board members of the North Central Regional Aquaculture Center for productive comments and support.
Funding statement
This study was funded by the by USDA-NIFA through the North Central Regional Aquaculture Center Award 2016-38500-25753.
Conflicts of interest
None.
Appendix A
Table A1. Full experimental design—choice tasks by block

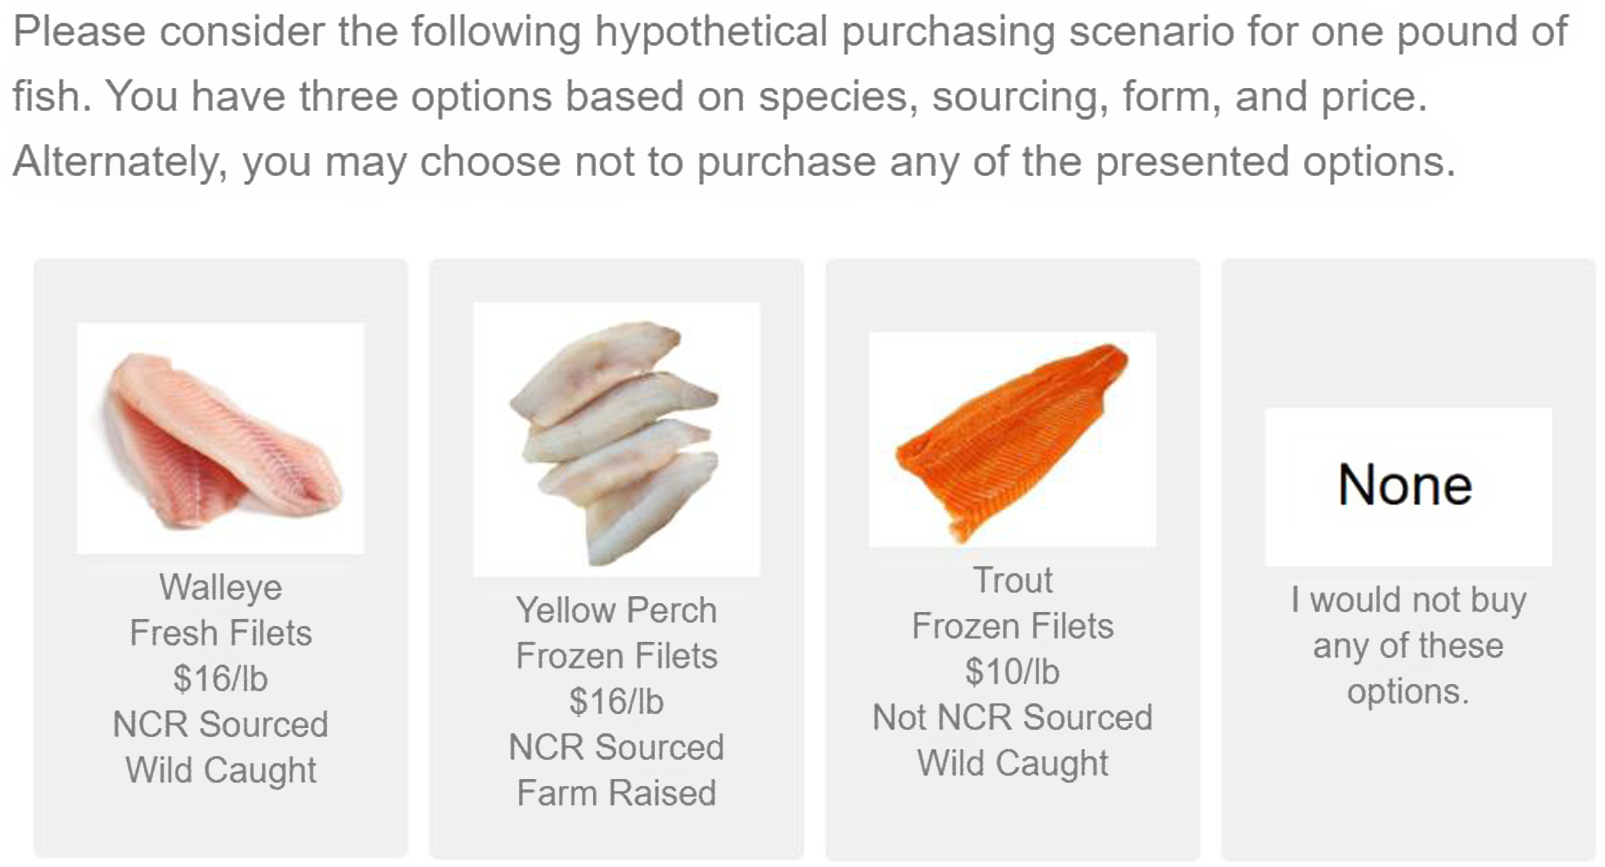
Figure A1. Example of a choice task.
aRespondents either clicked their preferred alternative with a mouse or touched it with their finger on a mobile device.
Table A2. Ex ante MNL efficiency measures


 Open access