


Introduction
Local food is an increasingly common product in retail channels such as grocery stores where packaged goods play an important role (King et al. Reference King, Hand, DiGiacomo, Clancy, Gómez, Hardesty, Lev and McLaughlin2010; Martinez et al. Reference Martinez, Hand, Pra, Pollack, Ralston, Smith, Vogel, Clark, Lohr, Low and Newman2010). As more local food brands enter the retail market, an open question is how incumbent brands will respond to entry of a new brand. Understanding incumbent response to increased competition from local brands is important as these responses determine market outcomes, policy effectiveness at encouraging new entrants, and welfare impacts to consumers (Perloff and Salop Reference Perloff and Salop1985; Klemperer Reference Klemperer1988; Smiley Reference Smiley1988; Thomas Reference Thomas1999; Ellison and Ellison Reference Ellison and Ellison2011). One of the primary responses of incumbent brands to a new entrant and the associated increase in competition is price change, and the literature on price change due to entry is mixed, with studies finding both incumbent price decreases (Simon Reference Simon2005; Goolsbee and Syverson Reference Goolsbee and Syverson2008; Tan Reference Tan2016) and price increases due to displacement effects (Rosenthal Reference Rosenthal1980; Hollander Reference Hollander1987; Frank and Salkever Reference Frank and Salkever1992).
In addition to price competition, there is increasing attention in the literature to nonprice competition. Changes in product quality are one of the nonprice pathways by which incumbent firms can respond to new entrants (Prince and Simon Reference Prince and Simon2014). For quality changes, the theoretical literature has shown that the direction of incumbent quality changes from increased competition is mixed (Schmalensee Reference Schmalensee1979; Banker, Khosla, and Sinha Reference Banker, Khosla and Sinha1998); however, the majority of the empirical literature finds incumbent quality improves after entry in diverse industries including legal services (Domberger and Sherr Reference Domberger and Sherr1989), airlines (Mazzeo Reference Mazzeo2003), cell phones (Economides, Seim, and Viard Reference Economides, Seim and Viard2008), television channel choices (Goolsbee and Petrin Reference Goolsbee and Petrin2004), and supermarkets (Matsa Reference Matsa2011).
Ice cream is a popular dessert for many American households, with 23 pounds of the frozen treat being consumed per capita annually (International Dairy Food Association 2018), which is roughly equivalent to 150 servings per person per year. Individual ice cream flavors are generally characterized as horizontal product differentiation within brands, with different consumers preferring different flavors. Given the entry of a new, local, super-premium brand containing many different flavors, we focus our analysis on the brand-level response to a new entrant, and we model the number of varieties provided by each brand as a positive vertical quality attribute of the brand. Modeling the number of varieties of a product line, or the product-line length, as a positive quality attribute of a brand is well established in the literature when brands contain many individual products. Richards and Hamilton (Reference Richards and Hamilton2006) examine how retailers compete in the number of products offered as a positive attribute of product lines in fruit. In Goolsbee and Petrin (Reference Goolsbee and Petrin2004), one quality aspect of television viewing choices is specified as the number of viewing channels, and they show that the number of viewing channels for incumbent cable increases after entry of direct broadcast satellite as a quality improvement response. Draganska and Jain (Reference Draganska and Jain2005) find consumers prefer yoghurt product lines that offer greater numbers of varieties, and Berning and McCullough (Reference Berning and McCullough2017) find that the number of beer varieties offered by brewers increases with the density of local breweries and competition.
Most of the existing literature on variety and product-line length have focused on retail items where retailers retain control of variety provision (Richards and Hamilton Reference Richards and Hamilton2006). In the frozen desserts market, the manufacturers/brand labels operate as direct-to-store distributors (DSDs) and typically have control over product variety and retain full responsibility of stocking decisions (Draganska, Mazzeo, and Seim Reference Draganska, Mazzeo and Seim2009). According to the Grocery Manufacturers Association (2008), “Knowledgeable representatives of suppliers of DSD products are in stores multiple times a week merchandising products . . . the supplier assumes the costs for delivery, inventory management and merchandising.” One ice cream DSD touts among its services, “optimiz(ing) product mix and profitability.” With full control of stocking on shelves, we hypothesize that incumbent ice cream brands will also increase the number of varieties offered in response to entry as a form of nonprice competition.Footnote 1
In 2011, several stores of a large supermarket chain in the Columbus, Ohio region, introduced a popular local ice cream brand with its own store front among its ice cream offerings. We use the staggered entry of this new ice cream brand as a quasi-natural experiment to examine how incumbent brands respond to local brand entry. We examine whether and to what extent incumbent brands responded through nonprice channels by increasing the number of offerings/varieties as a quality improvement in response to entry of a new brand using difference-in-differences models. The USDA and International Dairy Food Association also separates ice cream brands into four categories based on quality: super-premium, premium, regular, and economy, and the classification depends on three characteristics: overrun, fat content, and the quality of ingredients. As the new ice cream brand is a super-premium ice cream, we hypothesize an amplified response from closer substitute brands, namely other super-premium ice cream brands. Our findings provide novel contributions to the literature on nonprice competition in a retail setting. We extend the literature on non-price competition by examining how ice cream brands compete in the number of varieties offered. We also focus on the ice cream industry, where manufacturers typically have control over stocking decisions, and contribute to the literature by showing how manufacturers compete under stocking freedom. We empirically test and find evidence of an increased number of varieties offered by incumbent brands after entry of a new local brand. As an increasing number of local brands consider entry into the traditional retail market, we show that incumbent responses to improve quality in response to entry of a local brand is an important competitive response with the potential to further increase consumer choice.
Data
The dataset we use contains weekly sales data for all ice cream sold in 10 Columbus, Ohio, and Toledo, Ohio stores of a large supermarket chain. Columbus is known as the test center of America, and marketing firms have routinely used Columbus as a test market due to Columbus being a representative demographic snapshot of middle America and a representative city for the USA as a whole (Gest Reference Gest2016). The Columbus, Ohio metropolitan area, is the third-largest metropolitan area in Ohio with a population of 1.9 million as of 2010, and the Toledo, Ohio metropolitan area, is the sixth-largest metropolitan area in Ohio with a population of 0.6 million as of 2010.Footnote 2 The combined Columbus and Toledo metropolitan areas represent 21.8 percent of the total Ohio population. Our data on ice cream comes from a large supermarket chain with a significant market share in the Columbus and Toledo metropolitan areas and Ohio as a whole. For this supermarket chain, both Columbus and Toledo are a part of the same marketing region, the administrative division where a central authority coordinates the pricing, purchasing, and supply chains for all stores within the marketing region.
Figure 1 shows a map of store locations, with circles representing supermarket locations that introduced the new brand and X representing no introduction stores. Table 1 shows the demographic characteristics of the local area of each store location based on census tract data. Table 1 also distinguishes stores that began carrying the new brand and those that did not. Across stores, we see that the new brand was introduced to wealthier (higher income) and more urban areas (higher pop density), with an average income of $63,551 for new brand stores and $29,137 for no new brand stores, highlighting the importance of controlling for baseline differences between treatment and control stores as part of the difference-in-differences estimation strategy. The average population density around the stores in the dataset is higher than the Ohio and U.S. average, likely due to stores being located in more urban areas. Overall, the average demographic characteristics around the stores are fairly similar to the Ohio and U.S. averages.

Figure 1. Comparison of Stores with the New Brand Entry and No Entry.
Table 1. Comparison of stores with new brand entry and no entry
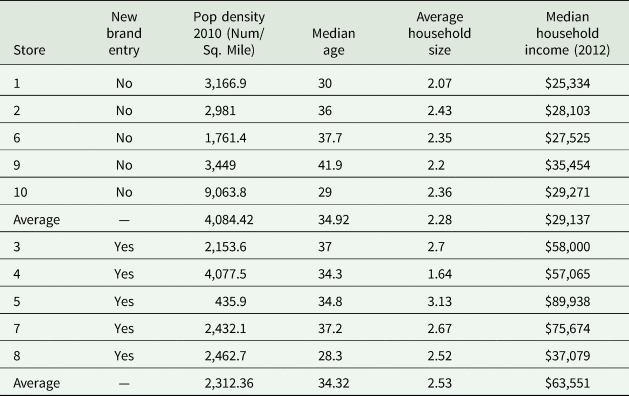
Notes: Information based on the census tract of the store location. Details from the 2010 Census.
Each unit of observation in our data contains the total expenditure and total units sold of a specific ice cream product, classified by GTIN code, during a particular week in a particular store location. The granular nature of GTIN codes assigns a unique code to each flavor and package size of an ice cream brand, allowing us to identify sales of different ice cream flavors within the same ice cream brand. We aggregate individual sales to the brand level. Each unit of observation in the resulting dataset corresponds to the number of varieties of a particular ice cream brand sold and records the brand sold, store location, quantity sold, price, and the date of each transaction. For the number of varieties offered by each brand, we follow the literature (Draganska and Jain Reference Draganska and Jain2005; Richards and Hamilton Reference Richards and Hamilton2006), where the number of varieties is an aggregate count of the different products offered by each brand, and we distinguish each product based on its GTIN number. The final cleaned dataset contains 9,112 weekly store-level observations for 11 ice cream brands, excluding the new brand, occurring between July 2010 and February 2012.
Table 2 reports the sales expenditure weighted-average price for each ice cream brand. The supermarket chain offers three different private labels: a basic ice cream label, regular ice cream label, and premium label. The three different private labels are set at different price points, with the basic label at $0.14 per serving, the regular label at $0.23 per serving, and the premium label at $0.35 per serving. Across all ice cream brands, the average price is $0.54 per serving. The most expensive ice cream brand is Brand 5, with an average price of $1.13 per serving. There is significant heterogeneity in variety offerings between different brands, with an average of 10 varieties offered per week per store for some brands compared with an average of 52 varieties offered by others. The average number of varieties offered per brand is 27. Table 2 also reports the overall market share held by each brand in terms of total sales. The regular private label is the most popular, accounting for 26 percent of the market. Aggregating all private label brands reveals that the private label accounts for 48 percent of the in-store ice cream market share. The new brand comprised 6 percent of the total revenue market share after entry. In terms of volume sold, the new brand comprised less than 1 percent of the ice cream market in stores carrying it, and the small share likely indicates that the physical entry of the new brand did not significantly alter the freezer space and the presence of other incumbent brands. Figure 2 plots the detrended ice cream revenue between the treatment and the control stores. We see that the entry of the new brand corresponds to an increase in the ice cream revenue for the treatment stores in comparison with the control stores that did not see entry.
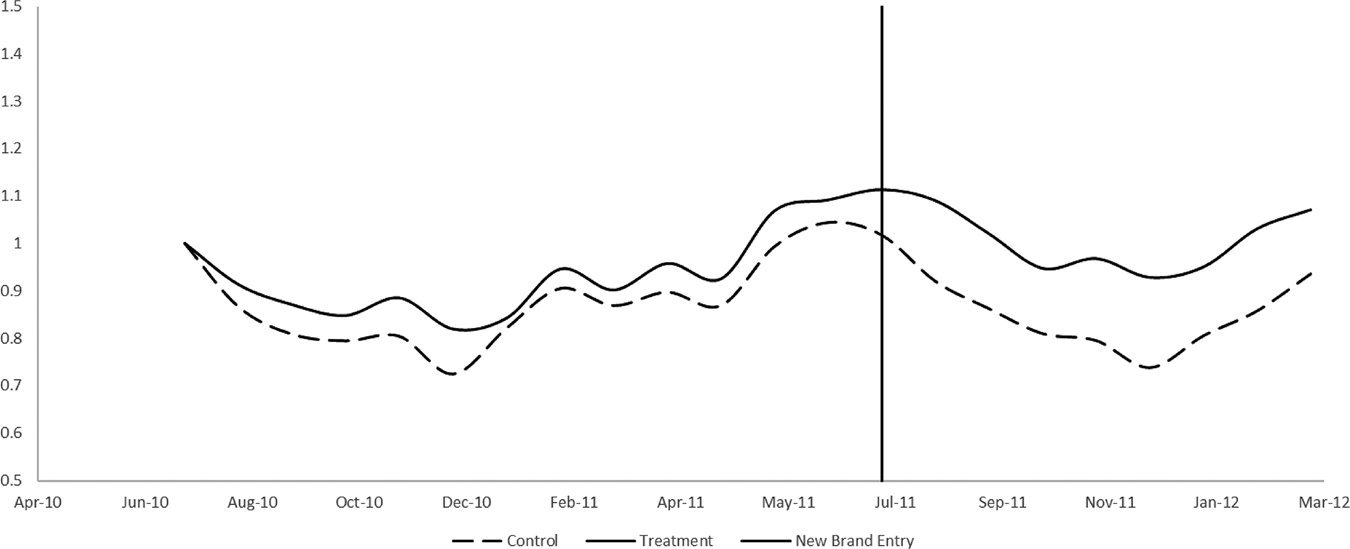
Figure 2. Detrended Ice Cream Revenue of Treatment and Control Stores.
Table 2. Summary statistics for ice cream by the brand
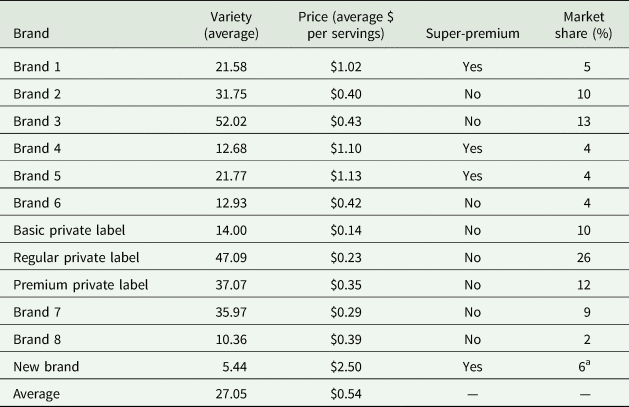
Notes: aFrom stores that contain the new brand. The new brand's data is not included in the regression analysis.
To identify the super-premium brands of ice cream, we use the total fat content of the ice cream brand, as total fat is an indicator of butter fat content and quality. In Table 2, the classification of super-premium ice cream is associated with the brands consumers typically think of as the high-end brands of ice cream. These brands exhibit the highest price and total fat content, and there is a large gap in fat content between the identified super-premium brands and the other brands. In Figure 3, we show the detrend average revenue of super-premium and non-super-premium ice cream brands before and after entry of the new brand. The graph indicates that ice cream sales, especially that of super-premium brands, were negatively affected by the entry of the new brand.Footnote 3
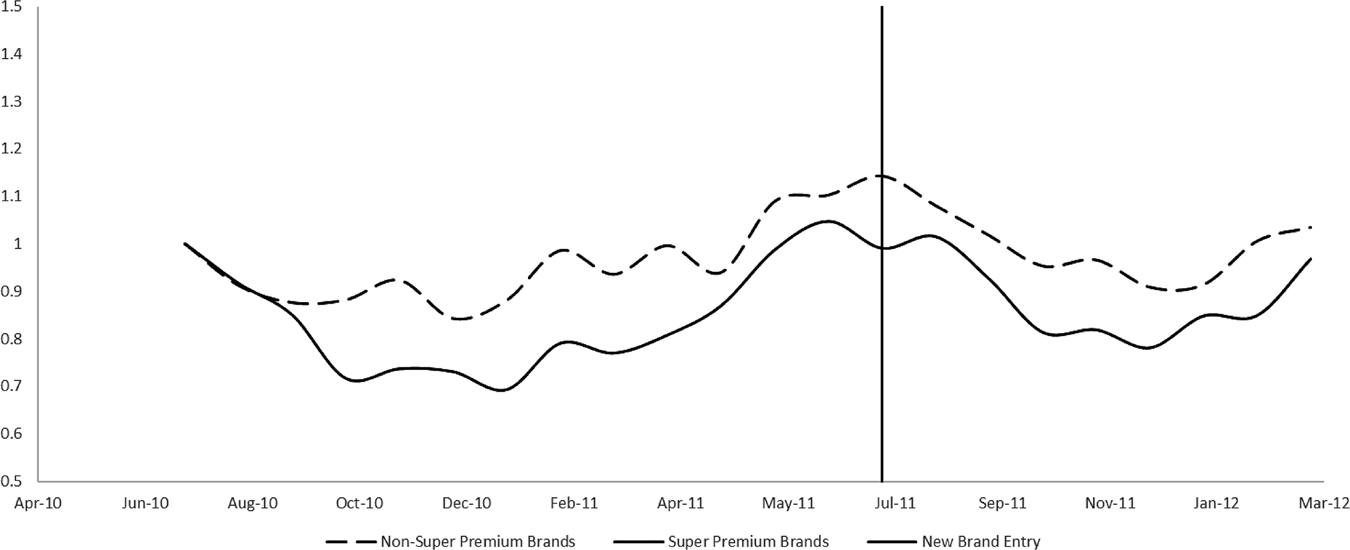
Figure 3. Detrended Revenue of Super-Premium and Non-Super-Premium Brands.
Empirical model
The introduction of the new brand to only 5 out of 10 stores in our data provides a quasi-natural experimental setting to examine the incumbent brand response to the entry of the new brand. The stores that carried the new brand comprise the treatment group, and the stores that did not carry the new brand comprise the control group. The new brand was first introduced in July 2011, and we use this date as the beginning of the treatment period. Table 3 presents the average number of varieties divided into treatment and control categories. We see that the difference in the number of varieties before and after entry for the control group is −0.6, while the difference in the number of varieties before and after entry for the treatment group is 0.1. The −0.6 difference in the control store varieties suggests that the average number of varieties per brand was on a declining trend, potentially due to changing seasonal demand. The average number of varieties per brand in the treatment stores would also have likely been −0.6 absent in the entry of the new brand, but incumbent brands actually increased varieties by 0.1. Accounting for the general trend of decline in the number of varieties, these summary statistics indicate a baseline difference-in-differences response of a 0.7 increase in varieties and provide preliminary evidence of a nonprice response due to entry.
Table 3. Average number of varieties

For our empirical design, the entry event is similar to a policy change, where a central policy maker decides on the date of the change and the targeted groups. According to the website of the supermarket chain in our analysis, a central authority within the supermarket chain marketing region is the key decision maker behind whether to carry a new brand. The central authority then decides when and which stores will start carrying the new brand. The decision process is typically entirely dictated by the supermarket chain's central authority and chain buyers.
To gauge the appropriateness of treatment and control designations after controlling for observable differences across stores, Figure 4 plots residuals for a regression on the number of varieties after controlling for seasonal fixed effects, brand fixed effects, store fixed effects, and price. Figure 4 shows similar trends in the number of product offerings per brand between the stores carrying the new brand and stores without the new brand before July 2011. However, there is a large increase in varieties carried in the treatment stores after the entry of the new brand in July 2011.Footnote 4
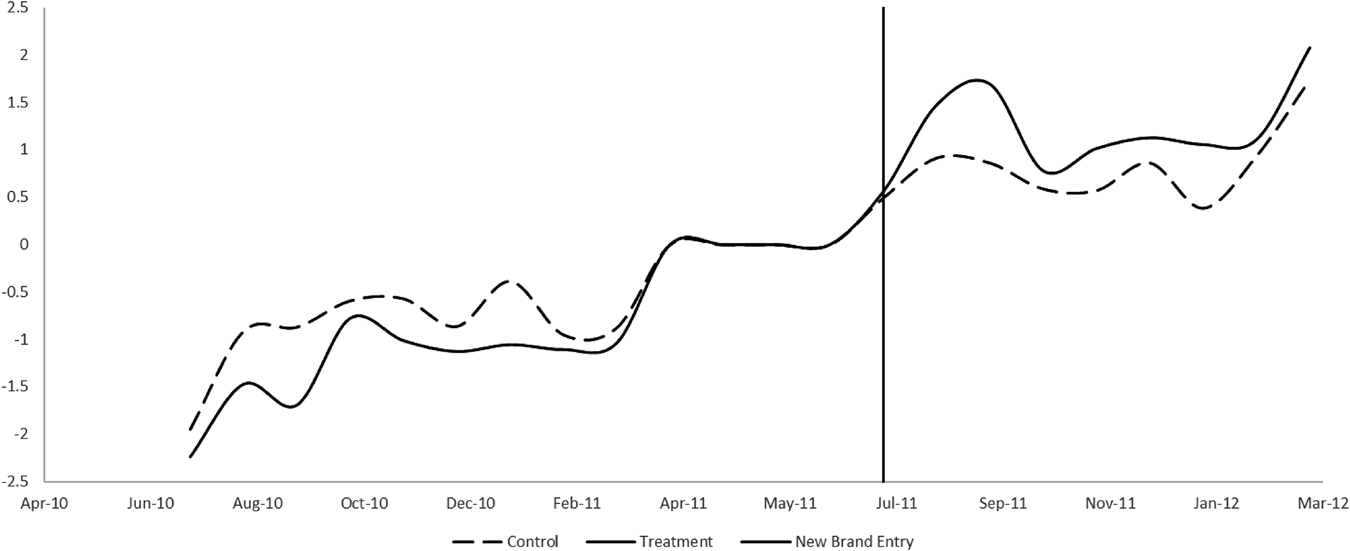
Figure 4. Parallel Trend Graph.
Figure 5 plots the average price per serving of ice cream in the treatment and control stores, respectively. It is noteworthy that there is virtually no difference between the average price per serving between treatment and control stores. Furthermore, prices between treatment and control stores appear to move uniformly over time. The consistent price trends across stores provide evidence that a central retail authority sets prices for all stores, which is consistent with recent literature that stores do not set retail prices to maximize profit based on local store conditions (DellaVigna and Gentzkow Reference DellaVigna and Gentzkow2019). However, we see significant differences in the number of varieties offered at treatment and control stores, suggesting that nonprice competition among brands is occurring within retail stores.

Figure 5. Average Price between Treatment and Control Stores.
To econometrically estimate the effect of entry, we use a difference-in-differences estimator shown in equation 1, where j indexes ice cream brands, s indexes store, and t indexes month.

The dependent variable, No. of Varjst, is the number of varieties of brand j in store s during month t. We control for the difference between the pre-entry and post-entry time periods with the indicator variable, PostEntryt, which equals to 1 after the introduction of the new brand in July 2011. We control for the stores that saw the introduction of the new brand with EntryStores. The PostEntryt term controls for any time-specific effects in the post-entry time periods that are common to both treatment and control stores. The EntryStores term captures time-constant differences in attributes, such as the income of the surrounding community, between treatment and control stores. We also control for brand fixed effects, store fixed effects, and seasonal fixed effects at the month-of-year level. Further robustness checks use the week of sample fixed effects. The interaction variable ${\rm EntryStor}{\rm e}_s\ast {\rm PostEntr}{\rm y}_t$ forms the basis for the difference-in-differences estimator of interest.
To examine the heterogeneous response for different categories of ice cream, we extend equation 1 with an interaction for super-premium ice cream, Superpremium, with ${\rm EntryStor}{\rm e}_s\ast {\rm PostEntr}{\rm y}_t$ to recover heterogeneous responses. We report robust standard errors clustered at the store level for all econometric specifications.

Using Ordinary Least Squares (OLS) regressions with count data as the dependent variable, No. of Varjst can potentially result in biased and inconsistent estimates. To address this concern, we also estimate a Poisson difference-in-differences estimator shown in equation 3, where j indexes ice cream brands, s indexes store, and t indexes month.

The nonlinear nature of the Poisson regression does not allow us to directly interpret the coefficient, β1, as the treatment effect, as this term is not simply the cross difference of the expectation of the observed outcome as in a linear model. The difference-in-differences estimate is the difference of the cross differences of the expectations of the observed and potential outcomes (Puhani Reference Puhani2012). We make this adjustment using equation 4.

To further examine heterogeneous responses across different categories of ice cream and similar to (2), we extend (3) and (4) with an interaction for super-premium ice cream, Superpremium. This model is shown in equation 5, and we perform a similar transformation to recover difference-in-differences estimates, as shown in equation 4. We report robust standard errors clustered at the store level.

Results
We report the results of our OLS estimation using equation 1 in Table 4. In the first column, we employ a basic specification and only include covariates associated with the difference-in-differences identification strategy ${\rm EntryStor}{\rm e}_s\ast {\rm PostEntr}{\rm y}_t, \;{\rm \;EntryStor}{\rm e}_s$ , and PostEntryt. In the second column, we add brand, seasonal fixed effects at the month level, and store fixed effects. The OLS regressions show preliminary evidence that brands increased 0.76 variety offerings, on average, in response to the entry of the new brand, and the estimates are consistent in the first and second columns. In the third column, we further isolate the effects of the new brand's entry on incumbent super-premium and non-super-premium ice cream brands using equation 2. The coefficient on ${\rm Superpremium}\ast {\rm EntryStor}{\rm e}_s\ast {\rm PostEntr}{\rm y}_t$
 is positive and significant and shows that super-premium brands responded to entry with a variety increases of 4.36 additional varieties. However, the coefficient on ${\rm EntryStor}{\rm e}_s \,\ast {\rm PostEntr}{\rm y}_t$
 is not significant and shows no clear evidence that non-super-premium brands responded to the entry of the new brand.
Table 4. OLS main results

Notes: Robust standard errors in parentheses, clustered at the store level. July 2011, when the new brand entered into the first store, is the start of the Entry period. All three columns are OLS difference-in-differences models with stores that introduced the new brand as the treatment group and stores that did not introduce the new brand as the control group. Column (1) uses only the difference-in-differences covariates. Column (2) controls for brand fixed effects, seasonal fixed effects at the month level, and store fixed effects. Column (3) examines heterogeneous effects between super-premium and non-super-premium brands and controls for brand fixed effects, seasonal fixed effects at the month level, and store fixed effects. Dependent variable is the number of varieties offered by each brand for each store each week.
To account for the count data nature of the number of varieties, we estimate the Poisson regression in equations 3 and 4 and report our estimation results in Table 5. We follow the specification progression of Table 4 in the columns moving from left to right. In the first column, we employ a basic specification and only include covariates associated with the difference-in-differences identification strategy of ${\rm EntryStor}{\rm e}_s\ast {\rm PostEntr}{\rm y}_t{\rm , \;\;EntryStor}{\rm e}_s$ , and PostEntryt. In the second column, we add brand, seasonal fixed effects at the month level, and store fixed effects. In Panel A of Table 5, we see the estimated difference-in-differences parameter, β1, in equation 3 is positive and significant, indicating that the number of varieties per brand increased in the treatment stores in response to the entry of the new brand after controlling for differences in the pre- and post-time periods. To interpret results as difference-in-differences estimates, we report the transformed results from equation 4 in Panel B. We see that brands increased 0.85 variety offerings, on average, in response to the entry of the new brand, and the estimates are consistent across both columns and similar to the OLS estimates shown in Table 4. The average number of varieties per brand is 27, and an increase of 0.85 represents a 3 percent increase in the number of varieties. In the third column, we use equation 4 with heterogeneous effects for super-premium brands, indicated by the variable Superpremium, and non-super-premium brands. Similar to the results in the third column of Table 4, the coefficient on ${\rm Superpremium}\ast {\rm EntryStor}{\rm e}_s\ast {\rm PostEntr}{\rm y}_t$
 is positive and significant, but the coefficient on ${\rm EntryStor}{\rm e}_s\ast {\rm PostEntr}{\rm y}_t$
 is not significant. Panel B shows that super-premium brands increased varieties by 2.91. The average number of varieties for super-premium brands is 24.3, and a variety increase of 2.91 represents a 12 percent increase in the number of varieties following the new brand's entry.
Table 5. Main results
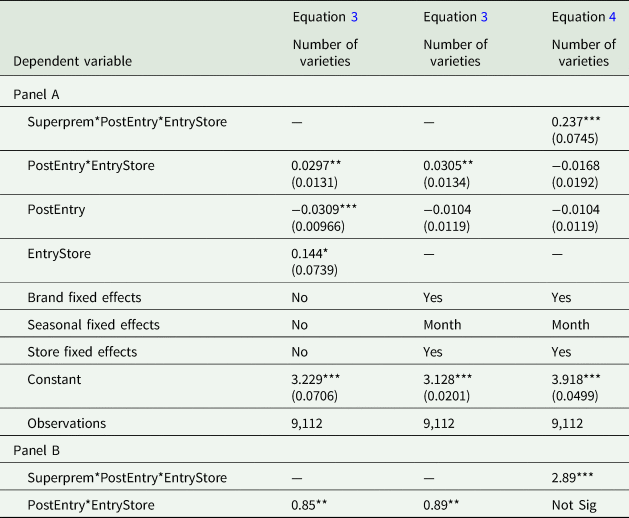
Notes: Robust standard errors in parentheses, clustered at the store level. All three columns use the Poisson regression due to the count nature of the dependent variable. July 2011, when the new brand entered into the first store, is the start of the Entry period. All three columns are difference-in-differences models with stores that introduced the new brand as the treatment group and stores that did not introduce the new brand as the control group. Column (1) uses only the difference-in-differences covariates. Column (2) controls for brand fixed effects, seasonal fixed effects at the month level, and store fixed effects. Column (3) examines heterogeneous effects between super-premium and non-super-premium brands and controls for brand fixed effects, seasonal fixed effects at the month level, and store fixed effects. Dependent variable is the number of varieties offered by each brand for each store each week. Panel A reports the raw estimates from the Poisson regression. Panel B converts the estimates to the expected change in the count of varieties.
*** p < 0.01, **p < 0.05, *p < 0.1.
In Table 6, we replace seasonal fixed effects at the monthly level with weekly time fixed effects to control for any week specific unobservables that are common to all stores. The first column of Table 6 reports the results of the OLS regression, and the second column reports the results of the Poisson regression. The results of both models are similar to the results of Tables 4 and 5.
Table 6. Fixed effect robustness
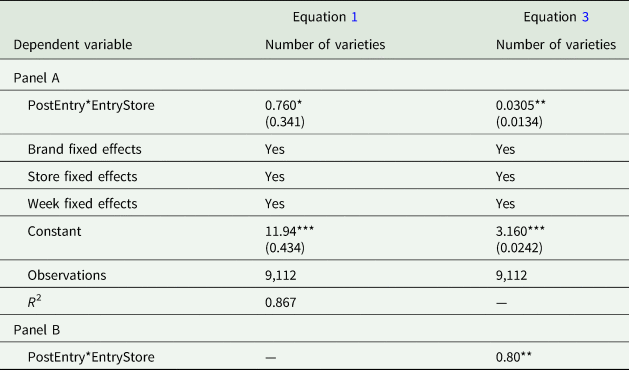
Notes: Robust standard errors in parentheses, clustered at the store level. Column (1) is an OLS difference-in-differences specification that controls for brand fixed effects, week fixed effects, and store fixed effects. Column (2) is a Poisson difference-in-differences specification that controls for brand fixed effects, week fixed effects, and store fixed effects. Dependent variable is the number of varieties offered by each brand for each store each week. Panel A reports the raw estimates from the Poisson regression for column (2). Panel B converts the estimates to the expected change in the count of varieties for column (2).
*** p < 0.01, **p < 0.05, *p < 0.1.
To further evaluate the robustness of our results, we present results from a series of additional specifications in Table 7. In our dataset, 2 of the 10 stores are located in Toledo, Ohio, and not in the Columbus metropolitan area. As both Toledo stores are also in the control group, we perform a robustness test by dropping the Toledo stores to ensure that time-varying attributes specific to the Toledo area are not biasing the results. The results are reported in the first column of Table 6, where we use equation 3 that controls for brand fixed effects, seasonal, and store fixed effects. Panel B shows that brands added 0.94 varieties in response to the entry of the new brand after dropping stores, not in the Columbus metro area. The results are similar to the results of Table 5.
Table 7. Robustness checks
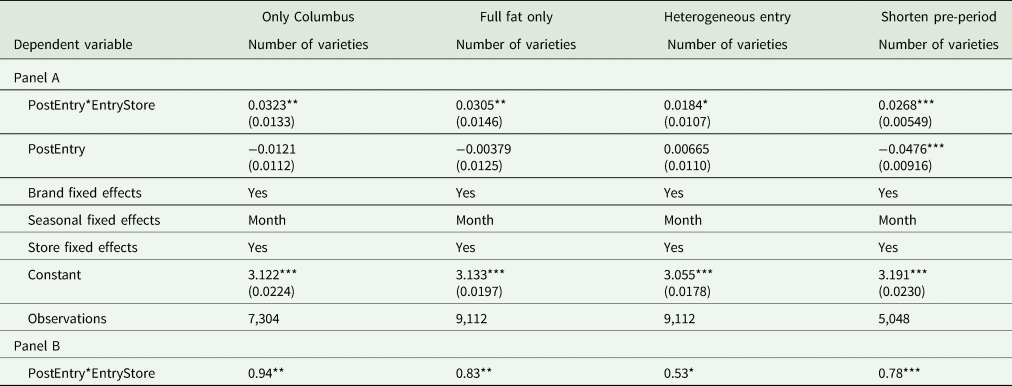
Notes: Robust standard errors in parentheses, clustered at the store level. Column (1) drops all non-Columbus stores (2 stores). Column (2) drops all nonfull fat ice cream options. Column (3) uses heterogeneous entry as the start of the Entry period. July 2011, when the new brand into the first store, is the start of the Entry period for store 4. November 2011 is the start of the Entry period for stores 3, 5, 7, and 8. Column (4) drops all observations before April 2011 to shorten the pretreatment time period. All columns control for brand fixed effects, seasonal fixed effects at the month level, and store fixed effects. Dependent variable is the number of varieties offered by each brand for each store each week. Panel A reports the raw estimates from the Poisson regression. Panel B converts the estimates to the expected change in the count of varieties.
*** p < 0.01, **p < 0.05, *p < 0.1.
For the main results in Table 5, we include all fat-free, half fat, and sugar-free ice cream options. As a robustness check, we drop all fat-free, half fat, and sugar-free ice cream options and re-estimate the difference-in-differences model using equation 3 that controls for brand fixed effects, seasonal, and store fixed effects. The results are shown in the second column of Table 7, and we find that brands increased full-fat varieties by 0.83 on average. Overall, these results indicate that our results are robust to the exclusion of ice cream choices with different fat and sugar types.
As discussed above, the entry of the new brand was not concurrent for all five of the treatment stores in the sample. The new brand was introduced to one store in July 2011 and to four additional stores in November 2011. In our main results, we assume that incumbent brands responded in our five treatment stores after entry in the first store. In the third column of Table 7, we control for the individual time periods that saw the entry of the new brand for each store (July 2011 for store 4 and November for stores 3, 5, 7, and 8). We change the interaction term ${\rm EntryStor}{\rm e}_s\ast {\rm PostEntr}{\rm y}_t$ to be heterogeneous across the five treatment stores depending on the actual entry time of the new brand. The results in the third column of Table 7 show that varieties increased by 0.53 as a response to entry and are qualitatively similar to our main specification in Table 5.
Finally, a long pretreatment time period in the data can potentially bias the results as the parallel trend assumptions might only hold close to the event date, but not in the distant past. In the fourth column of Table 7, we drop all observations before April 2011 and find that the results are qualitatively similar to the main results in Tables 4 and 5.
To examine our quasi-natural experimental setting, we perform a series of pretrend tests, placebo tests, and falsification tests. In Table 8, we test for pretrends of variety increases in the treatment stores before the entry of the new brand by including three additional difference-in-differences terms for the three months before entry to capture any anticipatory responses (Ashenfelter Reference Ashenfelter1978). We extend equation 3 with ${\rm EntryStor}{\rm e}_s\ast {\rm PostEntry}-1_t$ , ${\rm EntryStor}{\rm e}_s\ast {\rm PostEntry}-2_t$
 , and ${\rm EntryStor}{\rm e}_s\ast {\rm PostEntry}-3_t$
 , which captures the change in the number of varieties in the treatment stores after differencing out changes one month, two months, and three months prior to the entry of the new brand. The results in Table 8 show that there were no significant changes or pretrends in the number of varieties before the entry of the new brand.
Table 8. Pretrend results
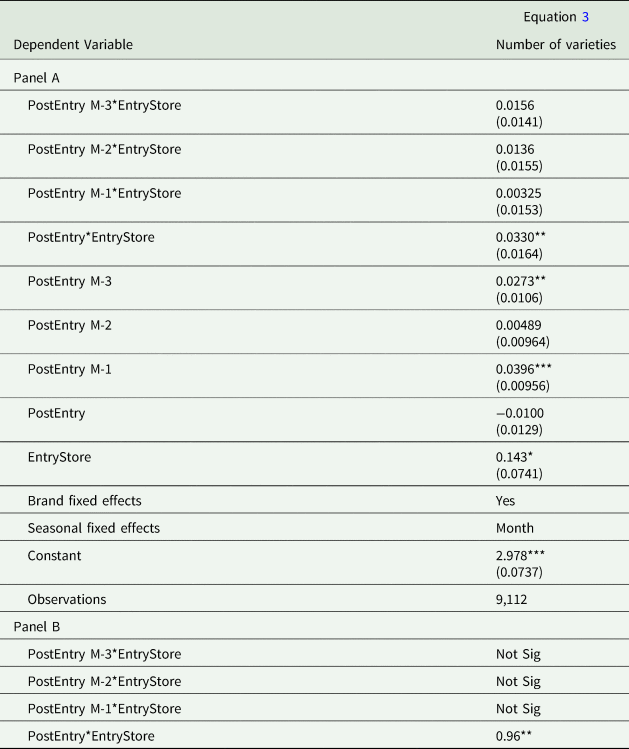
Notes: Robust standard errors in parentheses, clustered at the store level. The regression extends equation 3 with Ashenfelter pretrend effects and controls for brand fixed effects and seasonal fixed effects at the month level. Dependent variable is the number of varieties offered by each brand for each store each week. Panel A reports the raw estimates from the Poisson regression. Panel B converts the estimates to the expected change in the count of varieties.
*** p < 0.01, **p < 0.05, *p < 0.1.
Finally, we conduct placebo and falsification tests in Table 9 to see if false positives are being captured by our primary specification. In the first column of Table 9, we conduct a placebo test by changing the definition of the PostEntry period. We drop all observations after July 2011, and we change the start of the PostEntry period to October 2010, significantly before the entry of the new brand, to see if we can pick up the same significant results on the interaction term ${\rm EntryStor}{\rm e}_s\ast {\rm PostEntr}{\rm y}_t$ . Panel B of Table 9 shows no significance on the interaction term ${\rm EntryStor}{\rm e}_s\ast {\rm PostEntr}{\rm y}_t$
 . In the second to fourth columns of Table 9, we use falsification tests to see if associating entry to stores that did not experience the entry of the new brand yields significant results. We drop all stores that experienced the entry of the new brand and randomly select two stores from the control group to be in the treatment group. For each of the three columns, the different combinations of two stores were selected to be in the treatment group. All three columns using the falsification tests show no significant change in varieties on the interaction variable of interest ${\rm EntryStor}{\rm e}_s\ast {\rm PostEntr}{\rm y}_t$
 . The lack of significance on the ${\rm EntryStor}{\rm e}_s\ast {\rm PostEntr}{\rm y}_t$
 term under placebo and falsification tests provides additional support for the quasi-natural experiment setting and results of our study.
Table 9. Placebo and falsification tests
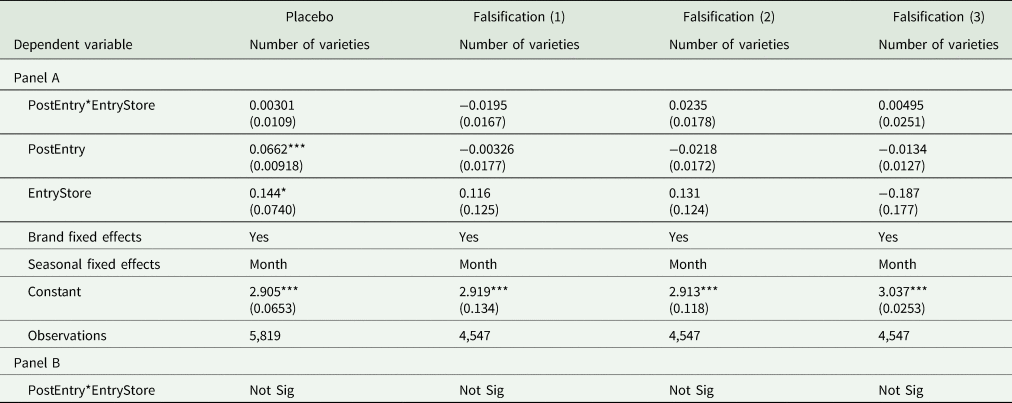
Notes: Robust standard errors in parentheses, clustered at the store level. Column (1) is a placebo test that drops all observations after July 2011 and moves the start of the treatment time period to October 2010. Columns (2) to (4) are falsification tests, where all treatment stores are dropped, and 2 stores out of the control stores are randomly selected to be the treatment stores. Column (2) has stores 9, 6 in the treatment group. Column (3) has stores 2, 6 in the treatment group. Column (4) has stores 1, 2 in the treatment group. All columns include seasonal fixed effects at the month level and brand fixed effects. Dependent variable is the number of varieties offered by each brand for each store each week. Panel A reports the raw estimates from the Poisson regression. Panel B converts the estimates to the expected change in the count of varieties.
*** p < 0.01, **p < 0.05, *p < 0.1.
Conclusion and discussion
Using the introduction of a new ice cream brand as a quasi-natural experiment in a large supermarket chain, we find that incumbent ice cream brands improved brand quality by increasing varieties, on average by 0.9, or 3 percent. This response primarily came from super-premium ice cream brands, close substitutes of the new brand, which increased varieties offered by 2.9 on average (12 percent). These findings are robust to different market definitions as well as inclusion of different types of ice cream in our sample, including reduced fat and sugar-free varieties. Finally, we provide a number of robustness and placebo tests that confirm our primary findings that brands respond to entry through increased product-line length as a form of a nonprice competition.
Our findings contribute to several areas in the industrial organization, food marketing, and retail literatures. First, our results provide additional evidence of nonprice competition in the retail ice cream setting. The variety response we document suggests that variety, as measured in the number of varieties per brand, acts as a positive quality attribute that brands compete on. Second, we further evidence from the theoretical and empirical literature that quality, as measured by the number of varieties, improves after entry and increased competition. Our findings suggest highly localized competition effects operating through nonprice channels, and the findings are consistent with recent literature documenting that retailers typically price uniformly without consideration for differences in local conditions. Finally, we show how manufacturers compete in food sectors with retail pricing constraints but stocking discretion.
Numerous studies have highlighted consumer preference for local foods (Adalja et al. Reference Adalja, Hanson, Towe and Tselepidakis2015) and effective policies for better consumer access and proliferation of local foods (Qi et al. Reference Qi, Rabinowitz, Liu and Campbell2017). For policy makers interested in promoting local foods, this study highlights the potential market impacts of new local brands and the associated increased competition. Previous studies have established the presence of consumer welfare benefits of brand introductions from the “variety effect” of having additional brands to choose from (Hausman and Leonard Reference Hausman and Leonard2002; Petrin Reference Petrin2002; Pofahl and Richards Reference Pofahl and Richards2009). In the food retail market, Arnade, Gopinath, and Pick (Reference Arnade, Gopinath and Pick2011) find net consumer welfare increased from variety effects after new brand introductions in the potato chip market. Our findings that increased competition from a local brand led to more varieties offered by incumbent ice cream brands suggest that consumers not only benefitted from an extra product line to choose from (the new brand), but also that this introduction increased the average quality of other ice cream product lines through additional variety offerings. These results highlight the important and localized role that increased competition can play in potentially yielding an additional channel of nonprice benefits for consumers due to increased variety from incumbent firms. Overall, we show how increased competition in the ice cream market results in nonprice benefits for consumers through increased variety offerings both by the new entrant and by incumbent firms.
Disclaimer
The findings and conclusions in this publication are those of the authors and should not be construed to represent any official USDA or U.S. Government determination or policy.
Acknowledgments
This research was supported in part by the intramural research program of the U.S. Department of Agriculture, Economic Research Service.


 Open access