


Introduction
While there is considerable evidence for past glaciation on sub-Antarctic islands, in many cases the extent and timing of those events is not well known (McGlone et al. Reference McGlone, Wilmshurst and Wiser2000, McGlone Reference McGlone2002, Bentley et al. Reference Bentley, Ó Cofaigh, Anderson, Conway, Davies, Graham, Hillenbrand, Hodgson, Jamieson, Larter, Mackintosh, Smith, Verleyen, Ackert, Bart, Berg, Brunstein, Canals, Colhoun, Crosta, Dickens, Domack, Dowdeswell, Dunbar, Ehrmann, Evans, Favier, Fink, Fogwill, Glasser, Gohl, Golledge, Goodwin, Gore, Greenwood, Hall, Hall, Hedding, Hein, Hocking, Jakobsson, Johnson, Jomelli, Jones, Klages, Kristoffersen, Kuhn, Leventer, Licht, Lilly, Lindow, Livingstone, Massé, McGlone, McKay, Melles, Miura, Mulvaney, Nel, Nitsche, O'Brien, Post, Roberts, Saunders, Selkirk, Simms, Spiegel, Stolldorf, Sugden, van der Putten, van Ommen, Verfaillie, Vyverman, Wagner, White, Witus and Zwartz2014, Dickens et al. Reference Dickens, Graham, Smith, Dowdeswell, Larter, Hillenbrand, Trathan, Arndt and Kuhn2014, Hodgson et al. Reference Hodgson, Graham, Griffiths, Roberts, Cofaigh, Bentley and Evans2014a, Reference Hodgson, Graham, Roberts, Bentley, Cofaigh, Verleyen, Vyverman, Jomelli, Favier, Brunstein, Verfaillie, Colhoun, Saunders, Selkirk, Mackintosh, Hedding, Nel, Hall, McGlone, Van der Putten, Dickens and Smith2014b, Browne et al. Reference Browne, Moy, Riesselman, Neil, Curtin, Gorman and Wilson2017). Because glaciers on these islands are quick to respond to climate change (Hodgson et al. Reference Hodgson, Graham, Griffiths, Roberts, Cofaigh, Bentley and Evans2014a, Reference Hodgson, Graham, Roberts, Bentley, Cofaigh, Verleyen, Vyverman, Jomelli, Favier, Brunstein, Verfaillie, Colhoun, Saunders, Selkirk, Mackintosh, Hedding, Nel, Hall, McGlone, Van der Putten, Dickens and Smith2014b), their history may yield important insights into southern hemisphere climate variability. With this in mind, the relatively unexplored Auckland Islands have been a subject of recent work to develop new paleoclimate records (Browne et al. Reference Browne, Moy, Riesselman, Neil, Curtin, Gorman and Wilson2017). The islands are today in the core of the southern hemisphere westerly wind belt (SHWW) and between the Subtropical Convergence and sub-Antarctic Front (Carter et al. Reference Carter, McCave and Williams2009). Migration and intensification of the SHWW and migration of ocean front locations have significant impacts on primary productivity and air–sea CO2 exchange in the Southern Ocean and should be recorded by climate proxies on the islands (Browne et al. Reference Browne, Moy, Riesselman, Neil, Curtin, Gorman and Wilson2017). While the islands are ice-free today, there is clear terrestrial evidence for past glaciation including cirques and deeply incised fjords (Hodgson et al. Reference Hodgson, Graham, Roberts, Bentley, Cofaigh, Verleyen, Vyverman, Jomelli, Favier, Brunstein, Verfaillie, Colhoun, Saunders, Selkirk, Mackintosh, Hedding, Nel, Hall, McGlone, Van der Putten, Dickens and Smith2014b).
The Auckland Islands are the largest island group of the sub-Antarctic islands of Aotearoa, New Zealand. Located around 51°S166°E, on the western edge of the Campbell Plateau, they are about 400 km south of mainland New Zealand. Due to their isolated location and inhospitable climate, the islands have only been sporadically visited by Polynesian explorers, shipwreck survivors, settlers for a brief period in the mid-1800s, wartime radio operators and scientists (Turbott Reference Turbott2002).
The present work links terrestrial topographical and new marine bathymetric data with the objective of identifying submerged glacial features and further developing the record of glaciation on the islands (McGlone et al. Reference McGlone, Wilmshurst and Wiser2000, McGlone Reference McGlone2002, Hodgson et al. Reference Hodgson, Graham, Griffiths, Roberts, Cofaigh, Bentley and Evans2014a, Reference Hodgson, Graham, Roberts, Bentley, Cofaigh, Verleyen, Vyverman, Jomelli, Favier, Brunstein, Verfaillie, Colhoun, Saunders, Selkirk, Mackintosh, Hedding, Nel, Hall, McGlone, Van der Putten, Dickens and Smith2014b, Browne et al. Reference Browne, Moy, Riesselman, Neil, Curtin, Gorman and Wilson2017). Some sections of the seabed described here had never been mapped before this work. Elsewhere, advances in marine mapping technology mean that known features have been imaged in more detail (as in Dickens et al. Reference Dickens, Graham, Smith, Dowdeswell, Larter, Hillenbrand, Trathan, Arndt and Kuhn2014, Hodgson et al. Reference Hodgson, Graham, Griffiths, Roberts, Cofaigh, Bentley and Evans2014a) and with an accuracy that surpasses the current terrestrial topography (LINZ 2017b).
Setting
The Auckland Islands are surrounded by a wide plateau less than 200 m deep. The plateau extends some 7 km from the island group to the south-west and nearly 90 km to the north-east, and forms part of the larger Campbell Plateau on which the other sub-Antarctic islands of New Zealand are located. To the west and south of the island group, the seabed slopes steeply from a depth of 200 m to an excess of 3000 m within 30 km of the islands’ western cliffs. In contrast, the north-eastern to south-eastern sides of the island have a much gentler gradient, with a portion to the north-east being less than 100 m deep over 30 km from Enderby Island. (Hydrographic Office RNZN 1992).
The islands are comprised of two merged Miocene-age shield volcanoes (see Fig. 1). Carnley Volcano, centred in the southern harbour of the same name, is the older of the two. The younger Ross Volcano is centred off the north-west coast of the main island, most probably near Disappointment Island (Adams Reference Adams1983, Gamble & Adams Reference Gamble and Adams1985, Quilty Reference Quilty2007). The islands have been subject to considerable erosion (Adams Reference Adams1983, Gamble & Adams Reference Gamble and Adams1985, McGlone et al. Reference McGlone, Wilmshurst and Wiser2000, McGlone Reference McGlone2002, Hodgson, et al. Reference Hodgson, Graham, Griffiths, Roberts, Cofaigh, Bentley and Evans2014a, Reference Hodgson, Graham, Roberts, Bentley, Cofaigh, Verleyen, Vyverman, Jomelli, Favier, Brunstein, Verfaillie, Colhoun, Saunders, Selkirk, Mackintosh, Hedding, Nel, Hall, McGlone, Van der Putten, Dickens and Smith2014b). The western side of the main island is now characterized by steep cliffs up to 400 m high, while the eastern side is incised by valleys and fjords that extend radially from the former volcanic centres. Peaks on the main islands reach over 600 m. Hodgson et al. (Reference Hodgson, Graham, Roberts, Bentley, Cofaigh, Verleyen, Vyverman, Jomelli, Favier, Brunstein, Verfaillie, Colhoun, Saunders, Selkirk, Mackintosh, Hedding, Nel, Hall, McGlone, Van der Putten, Dickens and Smith2014b) infer that ice domes covered the centres at Carnley Harbour and Disappointment Island during past glaciations. Enderby Island, the third largest in the group, is relatively low-relief and swampy, with a small peak of 43 m.
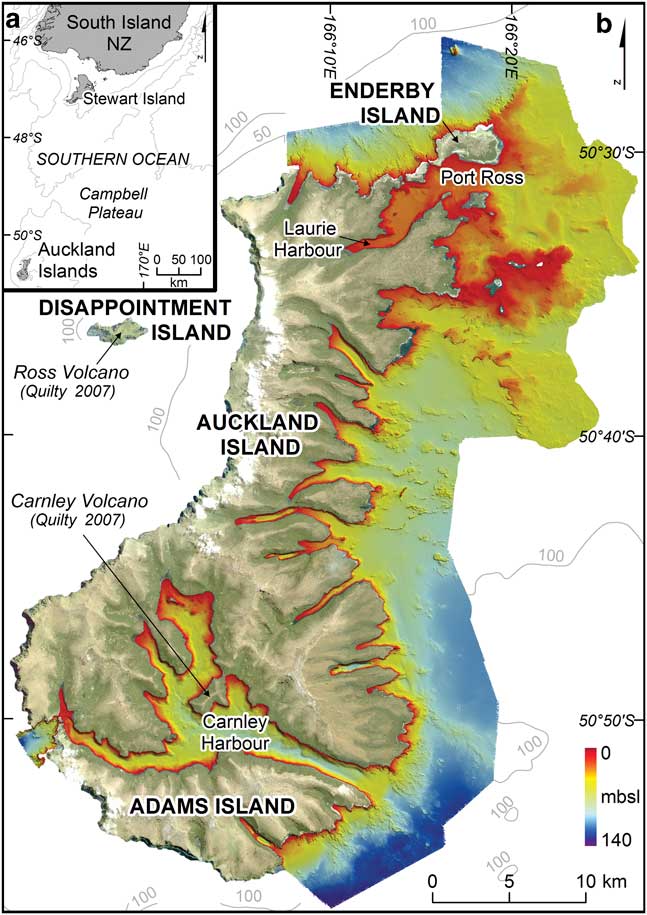
Fig. 1 a. Location of the Auckland Islands in the Southern Ocean. b. Auckland Islands new bathymetric data and sparse contours from LINZ chart NZ286.
Wide U-shaped valleys, lateral moraines, cirques, hanging valleys, and moraine-dammed lakes on the eastern side of the islands indicate that they have been glaciated at various times during the late Cenozoic (Quilty Reference Quilty2007, Hodgson, et al. Reference Hodgson, Graham, Griffiths, Roberts, Cofaigh, Bentley and Evans2014a, Reference Hodgson, Graham, Roberts, Bentley, Cofaigh, Verleyen, Vyverman, Jomelli, Favier, Brunstein, Verfaillie, Colhoun, Saunders, Selkirk, Mackintosh, Hedding, Nel, Hall, McGlone, Van der Putten, Dickens and Smith2014b). Knowledge of the timing and extent of past glaciation is limited due to the islands’ isolated location, challenging terrestrial and marine environments and also to the lack of bathymetric data, with which onshore features can be extended in space and time (Hodgson et al. Reference Hodgson, Graham, Roberts, Bentley, Cofaigh, Verleyen, Vyverman, Jomelli, Favier, Brunstein, Verfaillie, Colhoun, Saunders, Selkirk, Mackintosh, Hedding, Nel, Hall, McGlone, Van der Putten, Dickens and Smith2014b). Evidence for past climate events comes from peat cores in the north-east sector of Ross Volcano (McGlone in Quilty Reference Quilty2007) and piston cores in centrally located Hanfield Inlet (ID22) (Browne et al. Reference Browne, Moy, Riesselman, Neil, Curtin, Gorman and Wilson2017). Endemic animals and plants indicate that the islands were not completely glaciated at the Last Glacial Maximum (LGM) (Hodgson et al. Reference Hodgson, Graham, Roberts, Bentley, Cofaigh, Verleyen, Vyverman, Jomelli, Favier, Brunstein, Verfaillie, Colhoun, Saunders, Selkirk, Mackintosh, Hedding, Nel, Hall, McGlone, Van der Putten, Dickens and Smith2014b).
Deglaciation appears to have begun soon after the global LGM but neither maximum glacial extent nor inundation history across the whole of the islands are well known (McGlone et al. Reference McGlone, Wilmshurst and Wiser2000, McGlone Reference McGlone2002, Hodgson, et al. Reference Hodgson, Graham, Griffiths, Roberts, Cofaigh, Bentley and Evans2014a, Reference Hodgson, Graham, Roberts, Bentley, Cofaigh, Verleyen, Vyverman, Jomelli, Favier, Brunstein, Verfaillie, Colhoun, Saunders, Selkirk, Mackintosh, Hedding, Nel, Hall, McGlone, Van der Putten, Dickens and Smith2014b, Browne et al. Reference Browne, Moy, Riesselman, Neil, Curtin, Gorman and Wilson2017). Radiocarbon dating of the onset of peat deposition around Laurie Harbour, in the north of the islands, indicates glacier retreat began before 15k yr bp (McGlone Reference McGlone2002) and was well up-valley by 12.6–13k yr bp (McGlone et al. Reference McGlone, Wilmshurst and Wiser2000). Quilty (Reference Quilty2007) suggests that the white sand beach and dunes on the south of Enderby Island, which are not present elsewhere in the island group, indicate continental rock erosion, transportation and deposition prior to sea level rise at the end of the LGM. Further dating and geochemical analysis of fjord and lake sediments, together with sub-bottom geophysical surveying, is required to develop our understanding of past glaciations across the archipelago.
The seabed around the Auckland Islands was last surveyed between 1980 and 1991 by the Royal New Zealand Navy (LINZ 2016). At that time, depth sounding was undertaken with a single beam echo sounder, providing bathymetric point data below the vessel, but not the more complete sea floor ensonification achievable with modern acoustic swaths. In 2015 Land Information New Zealand (LINZ) commissioned a multibeam echo sounder (multibeam) survey of the eastern side of the islands (Fig. 1). Contractors collected sea floor bathymetry, seabed samples, geodetic control, photography, tide and current data (IXSURVEY 2015). The official charted source of data on the western side of the islands remains “Unsurveyed, random sounding tracks” (LINZ 2016).
Methods
Data processing
A variety of data were synthesized to create the maps discussed here (Table I). Processed multibeam data from the 2015 Auckland Islands survey were provided by LINZ in CARIS HIPS and SIPS (Hydrographic Information Processing System and Sonar Information Processing System) proprietary CSAR (Caris Spatial Archive) format at 1 m resolution. Along this surface, depth information as well as the standard deviation are stored and can be interrogated and exported. In CARIS HIPS and SIPS 9.0 the multibeam data were shifted vertically to MSL using the values in Table II. The older charted point data were adjusted mathematically in Arc GIS 10.3.1.
Table I Data imported into ArcMap project.

Table II Vertical reference systems and uncertainties of data used.

The topographic and bathymetric datasets were merged into one Triangular irregular network (TIN) using continuous Delaunay triangulation in ArcGIS (Fig. 2e). The process highlights the data density difference between land and sea, with the multibeam data now providing the highest density and thus resolution. This is due to the proximity of the measurement source for each height. ArcGIS spatial tools were used to generate profiles and fjord metrics. Additional data including aerial photography, basemaps, core and volcano locations were added to the project (Table I).
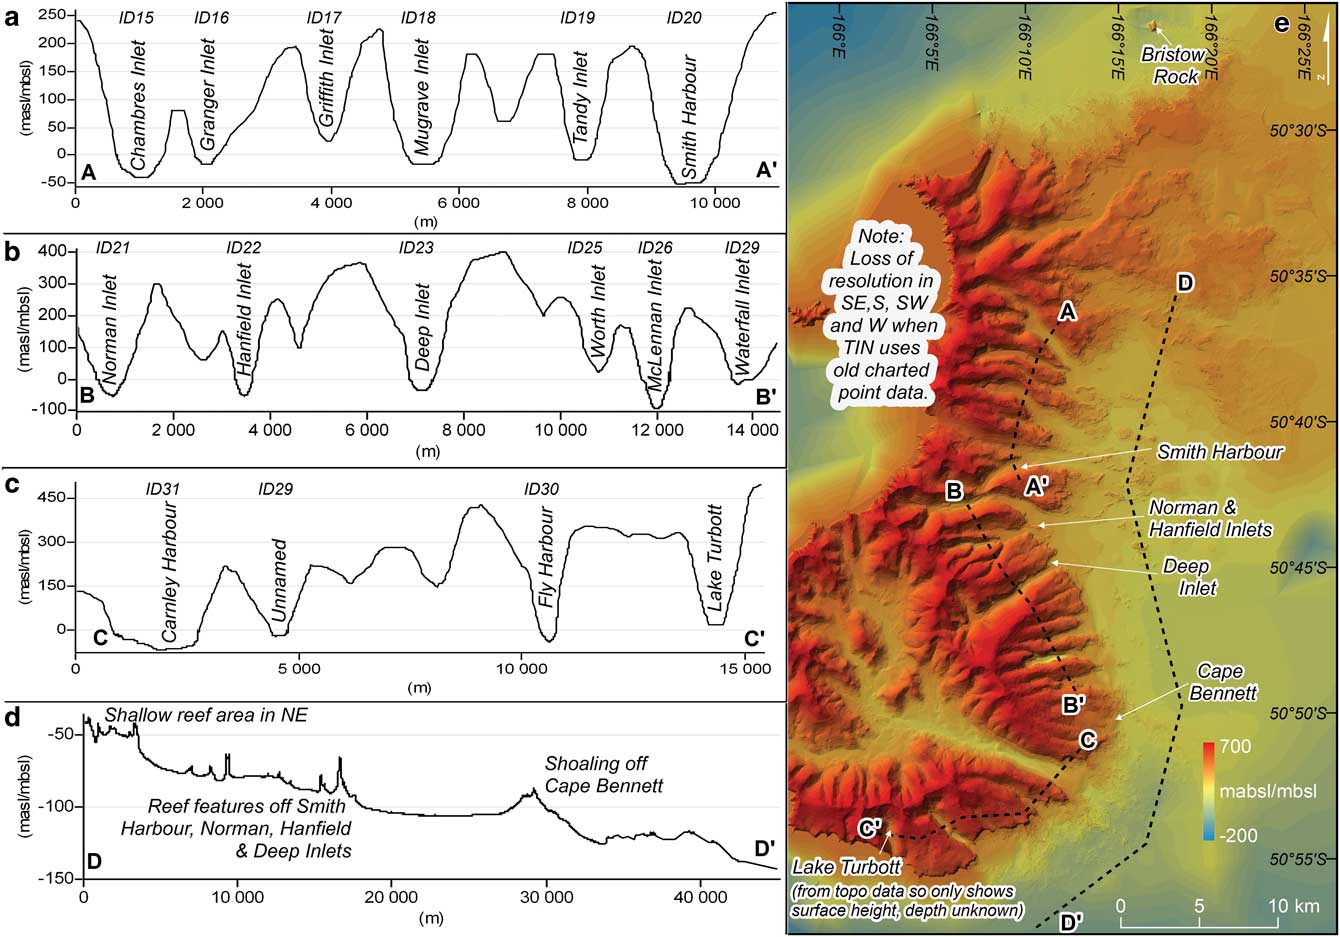
Fig. 2 a.–d. Transects through TIN model. ID numbers link with bay and fjord characteristics in Table 3. There is no clear surface evidence of the fjords in the offshore line D–D’, shoals are visible in the reefs off Smith Harbour, Norman, Hanfield and Deep inlets (ID20, 21, 22 & 23). e. Auckland Islands contiguous topography and bathymetry.
Vertical datums and uncertainties
Marine and terrestrial data collected at different epochs are not necessarily recorded using the same vertical datum. Here, datasets with different vertical reference systems were adjusted to Mean Sea Level (MSL) as defined by Land Information New Zealand (LINZ). Data and associated adjustments are described in Table II. The 2016 multibeam survey used six reference marks to define the depth of sounding datum (SD), to which all reduced depths in the survey relate. MSL for these geodetic marks is reference “HYD1415-HS42 AK Is levelling” in the LINZ Geodetic Database with a calculation date of 1 September 2016. At 5 V order, their height is within 1 m of the MSL datum at 95% confidence level (Cl), and 0.3 m at 95% Cl in relation to other marks (LINZ 2017a). To calculate the offset at each station, the contractor-determined SD value for each was subtracted from the LINZ-derived MSL value. This gave an average SD offset of -1.22 m below MSL, with a range of 0.2 m. Sounding datum for the multibeam data has a 0 offset to chart datum (CD) (A. Price, personal communication 2017), so new and previously charted data were adjusted to MSL by the same amount.
The new multibeam bathymetric data were collected to LINZ MB-1 specifications, indicating positioning uncertainty of better than 5 m±5%d in the horizontal and±1.5√(0.252+(0.0075.d)2) in the vertical (where d represents depth) at 95% Cl for each multibeam data point collected (IXSURVEY 2015). The older charted data have been assigned uncertainties based on international standards for shallow and deep-water surveys. Assuming the vertical errors in each data source are uncorrelated, the depth-dependent uncertainty of the combined depths is calculated from the individual values in Table II as±1.2–4 m at 95% Cl over a 0–135 m depth range. When the topographic data is added, the error is±12 m at 95% Cl over the same depth range. The reported horizontal uncertainty in the topographic data at 1:50 000 is±22 m at 90% (± 26.2 m at 95%). Horizontal uncertainty in the multibeam and single beam positioning is±5–12 m at 95%. Errors in the horizontal mainly affect the join between the two datasets (Fig. 2e).
Interpretation
Regional morphology
Much of the study area was uncharted prior to 2015 and the new bathymetric dataset reveals greater sea floor detail in all eastern fjords, southern Carnley Harbour (ID31) and northern Port Ross (ID09). The new multibeam data covers a depth range from 1.5–135.7 m. The improved seabed definition extends onto the Campbell Plateau 4.5–13.5 km from the islands. Rocky reefs less than 35 m in depth surround the northern islands while the seabed is smoother and deepens more rapidly to the south. Feature definition is improved on some reef systems and other reefs have been recognized for the first time. The new bathymetry improves definition on the inner north-east plateau and on seabed slopes to >135 m off the south-east coast. Details for each fjord and bay are listed in Table III.
Table III Bay and fjord characteristics from multibeam bathymetric data.

The eastern coastline is heavily incised by long, narrow fjords indicative of past glaciation. U-shaped valleys evident in the nearshore seabed profiles do not obviously extend into the offshore bathymetry although reef features can be seen on the northern part of shelf (Fig. 2). This transition probably reflects sediment deposition during times of relatively high sea level (Kluiving et al. Reference Kluiving, Aleid Bosch, Ebbing, Mesdag and Westerhoff2003). The present work focusses on new features mapped within the fjords, sills and sill morphology, which are examined as evidence of past glaciation. Here, the term sill is used to describe the main transverse ridges downstream of deeper basins in the fjord bathymetry.
Local morphology
North-east: North Harbour (ID01) is the only fjord along the northern coast of Auckland Island (Fig. 3a). The fjord is fed by two valleys and has no obvious sill but is distinctive for its relatively large sandy delta (Fig. 1). With the exception of Enderby Island at Sandy Bay (ID08), sandy shorelines are rare. Fine ripples are apparent in the multibeam data, at a depth of 12 m, midway along the length of the fjord. The seabed deepens rapidly, reaching 90 m within 1.5 km of the coast. Elsewhere along this coast, the north to north-east headlands have small bays and rocky reefs extending to the 60 m depth contour and rocky debris was mapped at the head of each bay.

Fig. 3 a. Bathymetry along the north and north-east coasts of the Auckland Islands. b. Complex features in blowouts south of Rose Island in Port Ross. c. Elongated features in Port Ross extending from Erebus and Terror coves.
Port Ross (ID09) is a long, shallow and relatively wide estuary (Fig. 3a). Its upstream reach, Laurie Harbour, is fed by two large U-shaped valleys (Fig. 1). The seabed within Laurie Harbour is relatively smooth with hummocky features. Elongated features, possibly eskers, extend from Terror and Erebus Coves at the end of the harbour (Fig. 3c). As Port Ross (ID09) widens, the seabed becomes very smooth, except where 3 m deep blowouts, caused by the strong current flowing through the channels on either side of Rose Island, expose rougher features (Fig. 3b). These include a 250 m long bank of coarser material, 1–1.5 m in diameter, and sinuous ridges c. 0.5 m in height. Hummocky terrain may indicate potential offshore basins from Enderby Island to the rocky islets in the east of Fig. 3a.
East and south-east: in Fig. 4b most of the eastern coast of the island group is deeply incised by fjords, all of which continue onshore as U-shaped valleys. Several discontinuous reef systems were mapped offshore along the central part of the coast but reefs were less common to the south.

Fig. 4 a. Inland lakes from Granger and Musgrave inlets. b. Bathymetry along the eastern and southern coasts of the Auckland Islands. c. Musgrave Inlet where it widens. d. Carnley Harbour sill at the eastern entrance.
Fjords in the central part of the coast, from Chambres Inlet (ID15) to Smith Harbour (ID20), are all relatively wide (Fig. 4b). The central fjords are characterized by a mainly smooth seabed that gradually fall away offshore with no clear evidence of glacial moraines or sills. The fjords farther south, from Norman Inlet (ID21) to Fly Harbour (ID30), are predominantly long and narrow and have some offshore evidence of past glaciation. Norman, Hanfield, McLennan inlets and Fly and Carnley harbours (ID21, 22, 26, 30 & 31 respectively) have shallow sills that are interpreted as glacial moraines. There are minor sills in Chambres, Granger, Waterfall and Deep inlets (ID15, 16, 27, 23) that appear partially eroded. These fjords are described in detail later. Smith Harbour (ID20) is a narrow, curving fjord. Falla Peninsula may have been cut off in the past by ice from the Smith and Norman (ID20, 21) valleys. Long, relatively straight turbidity channels are apparent in Musgrave Inlet (ID18) and Carnley Harbour (ID31) (Fig. 4c & d) (Lewis Reference Lewis1982, Dowdeswell et al. Reference Dowdeswell, Dowdeswell, Rodrigo and Diaz2016). The channels trend downslope, offshore in the case of Musgrave Inlet (ID18) and inland in Carnley Harbour (ID31).
South: Carnley Harbour is linked to the Southern Ocean to the west and east, forming the southernmost island in the group, Adams Island (Fig. 4b). Passage to the west is through two shallow and narrow gaps around Monumental Island. The seabed is scoured north of the gaps and this creates a sandbank in this western channel. While several of the valleys leading to the harbour begin as cirques and are U-shaped, there are no obvious glacial features in the channel bathymetry. A south-east draining fluvial system has been submerged by post-glacial sea level rise. A broad, smooth sill at the exit of the eastern channel appears to bury the downstream outlet of this system (Fig. 4d). This feature is incised by subtle transverse features, 200 m apart on its northern side (Fig. 4d).
Fjords with seabed glacial features
Shallow sills are clearly visible in five fjords along the south-eastern sides of Auckland and Adams islands. Less pronounced features, which may also be moraines, are evident in four more fjords. The sill depths range from 13.9–59.5 m enclosing basins ranging from 16–99 m deep (Table IV).
Table IV Sill and basin metrics from multibeam bathymetric data for fjords with observable sills. Listed in order of increasing latitude.

a ID number is shown from Fig. 2 onwards.
b Note for Norman and McLennan inlets: depth increases again 1 km upstream of the measured inflection point.
c Approximate distances only - cirque headwall estimated from aerial photography and topographic contours, most central path taken where multiple valleys exist.
The seabed in Chambres Inlet (ID15) consists of relatively smooth basin infill which obscures any potential glacial features (Fig. 5a). A slight shoaling of the seabed downstream of the deepest section of the inlet (Fig. 5c) may be an eroded moraine now obscured by Holocene sedimentation. The upstream profile clearly shows a basin behind the sill (Fig. 5b). Chambres Inlet (ID15) is fed by two large U-shaped valleys which are separated by a 180 m high, narrow ridge at the head of the inlet (Fig. 1).

Fig. 5 a. Chambres and Granger inlets (ID15 & 16). b. Chambres Inlet long section B–B’. c. Chambres Inlet enlargement of sill area. d. Granger Inlet enlargement of sill area. e. Granger Inlet long section E–E’.
The morphology of Granger Inlet (ID16) is similar to Chambres Inlet (ID15), with the same smooth bathymetry and slight shoaling downstream of a basin (Fig. 5a, d & e). Musgrave Inlet (ID18) to the south does not have an intact sill, although minor shoaling at the corners where the inlet widens may also be remnants of a now-eroded moraine (Fig. 4c). The valleys upstream of both Granger and Musgrave inlets (ID17 & 18) are U-shaped and distinctive for the relatively large lakes upstream of topographic ridges (Fig. 4a). The ridges appear to be analogous to the intact sills described in other fjords.
Norman Inlet (ID21) is the longest and northernmost fjord with a well-defined sill that is interpreted as a glacial moraine (Fig. 6a & f). The moraine is located where the fjord turns from the east to an ocean-facing south-west exit. The sill is asymmetric, being steeper on the upstream side (Fig. 6f, Fig. 9a & c). It is breached by a spillway with a hummocky appearance on its northern side, while to the south the morphology indicates a rocky reef (Fig. 9a & c). As elsewhere around the islands, an extensive and dense kelp bed was observed on the reef. Transverse ridges protruding from the fjord walls into the inlet both upstream and downstream of the basin may be the remnants of partially buried recessional moraines (Fig. 6b & c). The ridges are around 4 m high downstream, 1 m high upstream and spaced 175–200 m apart. A second, inner, sill has relatively low relief and is steeper on the downstream side (Fig. 6f). The fjord is fed by two large U-shaped valleys (Fig. 4b).

Fig. 6 a. Norman, Hanfield and Deep inlets (ID21, 22 & 23). b. Norman Inlet enlargement of possible recessional moraines at head of bay. c. Norman Inlet enlargement of possible recessional moraines closer to sill. d. Deep Inlet sill evidence. e. Deep Inlet enlargement of possible recessional moraines. f. Norman Inlet long section F–F’. g. Deep Inlet long section G–G’. h. Hanfield Inlet long section H–H’. i. Deep Inlet long section across possible recessional moraines I–I’.
Handfield Inlet (ID22) features two sills (Fig. 6a). As at Norman Inlet (ID17), the inner sill has relatively low relief and is steeper on the downstream side (Fig. 6h). There is no evidence of fluvial erosion due to the waterfall at the south-west corner immediately down valley of this sill. Large transverse ridges 20–30 m apart cover the seaward side of the outer sill (Fig. 9b & d), some rising more than 2.5 m over their 6 m length. They do not have a geometry consistent with recessional moraines (Dowdeswell et al. Reference Dowdeswell, Dowdeswell, Rodrigo and Diaz2016) and may instead be sand waves deposited over the moraine. The seabed on the inner side of the sill is hummocky. Several blunted ridges around 2 m high and 175–200 m apart protrude into the inlet from the southern side of the fjord. The fjord is the downstream continuation of a U-shaped valley with a very steep northern side (Fig. 4b).
Deep Inlet (ID23) is characterized by a very smooth seabed and a relatively low, broad shoal downstream of the fjord basin (Fig. 6a & g). The shoaling is shallower near the margins and may be a breached and eroded glacial moraine (Fig. 6d). As in several other cases, a series of minor transverse ridges extend part way across the southern side of the inlet upstream of the partial sill (Fig. 6e & i). The ridges do not clearly connect to onshore erosional features such as scarps and debris left by slope failures and it is possible to speculate that the marine features are recessional moraines. They are each less than 1 m higher than upstream seabed, and spaced around 140 m apart upstream and 100 m apart downstream. Deep Inlet (ID23) is the downstream continuation where several U-shaped valleys join (Fig. 4b).
McLennan Inlet (ID26) contains the deepest basin in the survey and has a well-developed sill (Fig. 7a & e, Fig. 9e). While the seabed is relatively smooth, the sill itself is characterized by rocky debris 1–3 m in size (Fig. 9e & g). This contrasts with the much smoother sills to the north. Like the sill in Norman Inlet (Fig. 9a & c), the moraine is asymmetric and breached by a spillway. A series of short turbidity current channels cut the southern, basin-ward side of the sill (Figs 7c & 9e). The inlet ends at a U-shaped hanging valley (Fig. 4b). One blunted ridge extending from the southern fjord wall into the inlet is clearly associated with the debris track of a recent terrestrial slope failure but other smaller, blunted transverse ridges along the margin are not and may be the remnants of retreat moraines (Fig. 7a & c). One can hypothesize that an elongate ridge at the upstream end of this fjord may be a bedrock feature or remnants from a cliff failure on the northern side of the fjord (Fig. 7a & b).

Fig. 7 a. McLennan and Waterfall inlets (ID26 & 27). b. McLennan Inlet enlargement. c. McLennan Inlet inside of sill enlargement. d. Waterfall Inlet enlargement. e. McLennan Inlet long section E–E’. f. Waterfall Inlet long section F–F’.
Waterfall Inlet (ID27) is a small bay with a deposit of relatively large rocks, 2–3 m in size, at its mouth (Fig. 7a & d). This feature is not down-valley from a basin. Instead, it forms the final ramp in a series of down-valley steps (Fig. 7f). The steps may be associated with sediment deposition during times of relatively slow sea level rise in this uniquely shallow, short and relatively embayed inlet. Nevertheless, the valley is U-shaped and the rocky debris may have been deposited at a glacier terminus.
Fly Harbour (ID30) has two well-developed sills and is the only obviously glaciated fjord facing the south-east (Fig. 8a & e, Fig. 9f). The outer sill is asymmetric, steeper upstream, and strewn with rocky debris, c.3 m in size, along the seaward side and close to the sides of the fjord while the central part of the sill is smoother (Fig. 8a & d, Fig. 9f & h). A linear groove in the sill might be an iceberg scour mark (Figs 8d & 9f). As elsewhere, the seabed is smooth within the basin, consistent with Holocene infill. Eroded recessional steps continue upstream from the inner sill creating potential lake basins (Fig. 8b, c & e). The inner sill is smooth, symmetric and relatively rocky on the upstream face. The seabed in the basin upstream of this sill is relatively smooth but cut by three transverse ridges (Fig. 8a, b & c). The first continuous step is around 250 m from the inner sill, followed by a second 8 m higher and another 200 m upstream. A third step extends only part way across the basin, at a height of 1.5 m, a further 150 m upstream.

Fig. 8 a. Fly Harbour (ID30). b. Long section across possible recessional moraines B–B’. c. Enlargement of possible recessional steps/lake basins. d. Enlargement of entrance sill showing potential iceberg scours. e. Fly Harbour long section E–E’.

Fig. 9 Comparison of the four major outer sills; a. Norman Inlet (ID17). b. Hanfield Inlet (ID18). c. Norman Inlet sill long section C–C’. d. Hanfield Inlet sill long section D–D’. e. McLennan Inlet (ID26) and f. Fly Harbour (ID30). g. McLennan Inlet sill long section G–G’. h. Fly Harbour sill long section H–H’.
Discussion
Geomorphology
The new bathymetric data reveal terminal and recessional moraines and deep basins in at least five of the fjords and similar, but less well-preserved features are apparent in several more. Much of the bathymetry is very smooth so it may be the case that sediment transport and deposition has obscured or eroded other glacial features in the fjords and offshore. Ridges in the valleys upstream of Musgrave and Granger inlets (ID 18, 17 in Fig. 4a), which today impound terrestrial lakes, are the subaerial counterparts to the well-developed marine sills and these features will probably appear similar to them once inundated by rising sea level. Where sediment cores have been collected in the fjords, they indicate continuous sedimentation for at least the last 5000 years (Browne et al. Reference Browne, Moy, Riesselman, Neil, Curtin, Gorman and Wilson2017). Thus, while the many terrestrial U-shaped valleys and their associated fjords are not resolved offshore in the present-day bathymetry (Fig. 2), evidence of more extensive glaciation than documented here may yet be discovered. Nevertheless, our data demonstrate greater downstream glacier extents than previously mapped.
Moraine characteristics may be used to infer depositional environment (Powell & Cooper Reference Powell and Cooper2002). The profiles of all clearly defined moraines are asymmetric with steeper slopes in the up-valley direction. These moraines are all paired with basins on the upstream sides that are deeper relative to the downstream. Marine-terminating glaciers are often characterized by asymmetric moraines and overdeepening in their fjords (Hodgson 2014a, Powell & Alley Reference Powell and Alley1997). Alternatively, several moraines (Norman (ID21), McLennan (ID26), perhaps Fly (ID30) in Fig. 9) are characterized by spillways with debris deposited downstream. These may have been formed by breaches of subaerial moraine-dammed lakes (Westoby et al. Reference Westoby, Glasser, Brasington, Hambrey, Quincey and Reynolds2014). A lacustrine to marine transition is interpreted in Hanfield Inlet (ID22) by Browne et al. (Reference Browne, Moy, Riesselman, Neil, Curtin, Gorman and Wilson2017). The moraines in Hanfield and Norman Inlets (ID21, 22 in Fig. 9) have smoother surfaces than the other two. This suggests that either the depositional environment did not support winnowing or that the morphology has been modified by more recent sediment transport.
Fjord width may be related to moraine formation and preservation. The four fjords with well-defined moraines are narrower than those with less distinct features. This may have led to more focussed deposition of glacial till and thus larger moraines, less likely to be obscured by post-deposition processes. The ratio of sill depth to basin depth is also highest for these four, ranging from 3.9–2.9 for Hanfield, Fly, Norman and McLennan (ID22, 30, 21, 26). The ratio range for Carnley, Granger, Deep, Chambres and Waterfall (ID31, 16, 23, 15 & 27) is much smaller at 1.7–0.8. There is no obvious relationship between moraine preservation and latitude, or distance to either inland cirque or the open ocean (Table IV).
Small ridges extending into the basins along the sides of five fjords may represent recessional moraines. Similar features are seen in other sub-Antarctic fjords such as Royal Bay and Cumberland Bay, South Georgia (Hodgson et al. Reference Hodgson, Graham, Griffiths, Roberts, Cofaigh, Bentley and Evans2014a). The ridges are most clear in Fly Harbour (ID30), while truncated features were mapped in Norman, Hanfield, Deep, and McLennan inlets (ID21, 22, 23, 26). The truncated ridges may be due to sediment deposition in proglacial basins obscuring the recessional moraines (Powell & Cooper Reference Powell and Cooper2002). The distance between these moraine features, which are all between 100–250 m apart, may be related to the rate of glacier retreat.
The seabed in the basins upstream of the major sills is very smooth. This is typical of sediment deposition in calm lacustrine or marine conditions, as associated with the Holocene sediment infill sampled in sediment cores from Hanfield and Norman Inlets and imaged in seismic line 14PL001-25 (Browne et al. Reference Browne, Moy, Riesselman, Neil, Curtin, Gorman and Wilson2017). In general, the seabed is shallower to the north so fjords there would have been flooded by the sea later than fjords to the south. Without knowing when the glacial maximum occurred on the islands it is not possible to infer anything more about the moraine and basin depositional environments. The record will be improved via acoustic sub-bed imaging and by additional coring.
Regional significance
The new data present the farthest-north record of terrestrial and submarine evidence of past glaciation, relative to the position of the modern sub-Antarctic and Polar Front. Hodgson, et al. (Reference Hodgson, Graham, Roberts, Bentley, Cofaigh, Verleyen, Vyverman, Jomelli, Favier, Brunstein, Verfaillie, Colhoun, Saunders, Selkirk, Mackintosh, Hedding, Nel, Hall, McGlone, Van der Putten, Dickens and Smith2014b) define six classes of Maritime Antarctic and sub-Antarctic islands depending on evidence for LGM glaciation. They classify the Auckland Islands as “Type V Islands north of the Antarctic Polar Front with terrestrial evidence of LGM ice expansion” but note that lack of bathymetric data is partially the reason for this classification - as opposed to Type IV “Islands on shallow shelves with both terrestrial and submarine evidence of LGM (and/or earlier) ice expansion”, into which the volcanic origin of the Auckland Islands would also fit. The Auckland Island group should now be classified as Type IV and viewed as an important location for paleoclimate studies.
Conclusion
Well-developed cirques, hanging valleys, U-shaped valleys and steep fjord walls are all terrestrial evidence of extensive past glaciation on the Auckland Islands. The ultimate extent of those glaciers, as well as the timing of glacier advance and retreat, have been hard to establish. This study has linked together terrestrial topography with fjord and near-offshore bathymetry to gain new insight into those attributes of island glaciation. Past work in the Auckland Islands examines glaciation through terrestrial peat coring, limited marine coring and topographical features such as cirques and U-shaped valleys. The new high-resolution multibeam bathymetry along the eastern side of the islands develops this narrative by revealing multiple submerged glacial features for the first time. While bathymetric evidence of past glacial processes is sparse relative to fjords on some other sub-Antarctic islands it does exist, in the form of end moraines, retreat features and associated upstream basins. The glaciation was pervasive and extensive, filling all of the eastern fjords with ice. However, details of the depositional environment and timing of these events is still unknown.
Further refinement and dating of the glacial history require sediment coring in the fjords and perhaps also in the terrestrial lakes and offshore basins. Here too our work can contribute, by indicating which fjords may yield the most valuable records. Combination of the present data with acoustic sub-bed imaging will provide a more comprehensive view of landscape evolution and should be a priority for future data collection. Once in hand, these data will provide constraints on computational models of Auckland Island glaciation.
Acknowledgments
The authors thank A. Price and Land Information New Zealand (LINZ) for assistance with the bathymetric data, Dr A. Campbell for his just-in-time reviewing of our manuscript, Dr Sarah Greenwood and two anonymous reviewers. Bathymetric and topographic analysis were undertaken using academic licences for CARIS HIPS&SIPS 9.0 and Arc GIS 10.3.1. Figures created must not be used for navigation. Bathymetric data in this paper are held by Land Information New Zealand (LINZ), and are licensed for reuse under CC BY 4.0 (contact: customersupport@linz.govt.nz). This research did not receive any specific grant from funding agencies in the public, commercial, or not-for-profit sectors.
Author contribution
E. Tidey developed the idea, processed the data, analysed the results and prepared the manuscript including all figures and tables. C. Hulbe advised on the approach and analysis and co-wrote the manuscript.


