Introduction
In woodlands, where tree canopies touch or overlap, birds routinely travel from tree to tree (e.g. Rabøl Reference Rabøl1987). Woodland birds normally avoid crossing open areas, although the gap-tolerance threshold differs between sexes and species (with smaller birds being more gap-sensitive) and also varies seasonally (Desrochers and Hannon Reference Desrochers and Hannon1997, St Clair et al. Reference St Clair, Bélisle, Desrochers and Hannon1998, Bélisle and Desrochers Reference Bélisle and Desrochers2002, Harris and Reed Reference Harris and Reed2002, Norris et al. Reference Norris, Stuchbury and Thompson2002, Shirley Reference Shirley2006, Lee and Peres Reference Lee and Peres2009, Robertson and Radford Reference Robertson and Radford2009, Gillies et al. 2010, Dolman Reference Dolman and Fuller2012). Several ideas have been proposed to explain why woodland birds tend to remain within tree canopies, notably relating to safety and energetics. It is dangerous to leave the cover provided by vegetation when avian predators are present (Lima Reference Lima1993, Suhonen Reference Suhonen1993, Rodríguez et al. Reference Rodríguez, Andrén and Jansson2001, Walther and Gosler Reference Walther and Gosler2001, Carrascal and Alonso Reference Carrascal and Alonso2006). Moreover, when trees are widely scattered, travel time between patches increases at the expense of foraging time (Hinsley Reference Hinsley2000).
For the reasons mentioned above, we would expect a declining number of birds in solitary trees with increasing between-tree distance until a lower threshold is reached where birds are absent (A in Figure 1). When woody cover is above threshold B (in Figure 1), we expect bird numbers to be directly proportional to woody cover (no impact of gaps in woody cover). We also expect thresholds to differ between bird species, depending on habitat use in the breeding quarters, with woodland birds probably being more selective than arboreal bird species inhabiting scrubland.
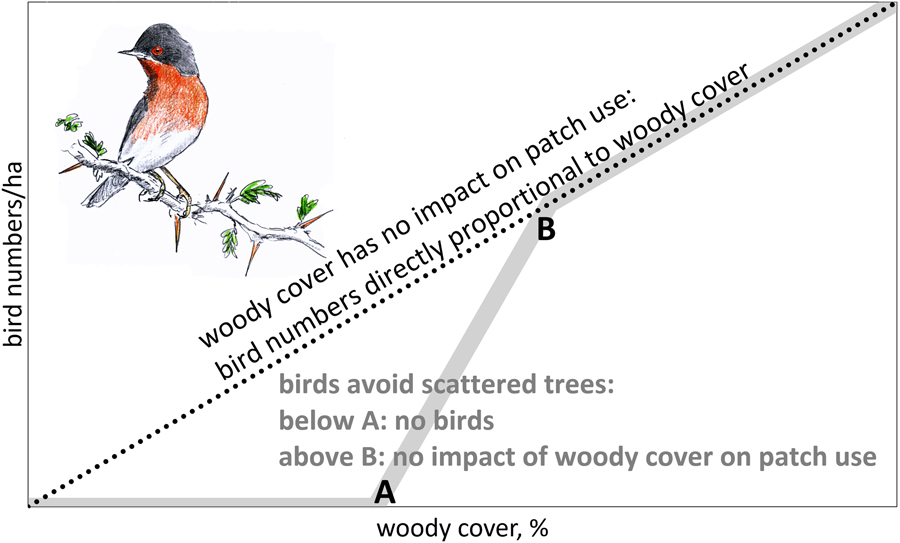
Figure 1. Theoretical relationship between number of birds foraging in trees and woody cover. When woody cover has no impact on patch use, bird numbers should be directly proportional to woody cover (dotted line). However, when birds avoid scattered trees, we expect an S-curve (grey line): below threshold A tree density is too low to sustain arboreal birds. Between thresholds A and B bird numbers are expected to disproportionately increase with woody cover.
Empirical data on the relation between bird numbers and woody cover are needed to differentiate between proportional impact on bird numbers by habitat loss and the additional impact of habitat fragmentation (Fahrig Reference Fahrig2003). When woody cover has no impact on tree use, scattered trees should be as attractive to arboreal birds as clumped trees. Under such conditions, tree loss would translate into a proportional loss in bird numbers (dotted line in Figure 1). However, when birds avoid scattered trees, the impact of thinning depends on whether woody cover is (1) already below threshold A (no birds, hence no impact), (2) between thresholds A and B (over-proportional loss, because trees become too isolated to be used) or (3) above threshold B (proportional loss). In other words, we assume that thinning of trees means habitat loss above threshold A with an additional, negative impact of fragmentation between threshold A and B.
This paper attempts to answer the question whether scattered trees in West Africa are less attractive to birds than trees in more densely vegetated parts. We restrict the analysis to bird species foraging in woody vegetation for which trees and shrubs are the only suitable patches in otherwise inhospitable habitat. All data were collected in the southern Sahara Desert, adjacent Sahelian savanna and agricultural parkland, i.e. open landscapes with scattered trees (Figure 2). From our own work in West Africa (Zwarts et al. Reference Zwarts, Bijlsma, van der Kamp, Sikkema and Wymenga2015) we know that the spatial distribution of trees is only one of the possible variables determining the suitability of individual trees as feeding patch. The density of arboreal birds varies between woody species and the overwhelming majority of tree species are ignored. Even among preferred tree species, foraging birds are highly selective and avoid most trees (probably related to food supply, insects mostly but also berries or nectar). Hence, to understand whether the spatial distribution of trees and their woody cover have an impact on habitat use of arboreal birds, other factors determining tree selection should also be taken into account.

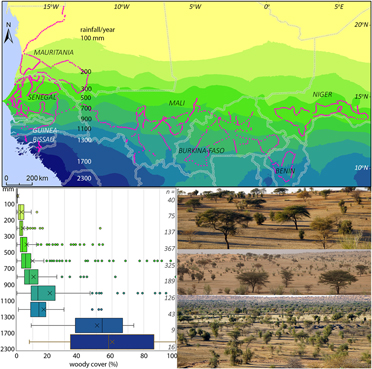
Figure 2. Map with study sites and annual rainfall in West Africa; rainfall averaged for 1960–1990 (Hijmans et al. 2005). The box and whisker graph give the woody cover in the study sites in 10 rainfall zones; boxes: 25th, 50th and 75th percentiles, whiskers: 12.5th (min.) and 87.5th (max.) percentiles, circles: outliers (<12.5th and >87.5th percentiles), X = average; n = number of sites per rainfall zone. The three photos show the open landscape with scattered trees being characteristic of the 800-km wide zone with an annual rainfall of 100–1,300 mm.
The question whether spatial distribution of trees has an impact on habitat use of arboreal birds is not just of theoretical interest. Hundreds of millions of Palearctic birds, many breeding in wood- and shrublands with more or less continuous cover, spend half their lives in sub-Saharan habitats where tree growth is scattered by nature. Many of these migratory bird species have shown a large decline during at least the last 50 years (e.g. Zwarts et al. Reference Zwarts, Bijlsma, van der Kamp and Wymenga2009, Vickery et al. Reference Vickery, Ewing, Smith, Pain, Bairlein, Škorpilová and Gregory2014), especially in the 1970s and 1980s when the rainfall in the Sahel was exceptionally low and many savanna trees died (e.g. Gonzalez Reference Gonzalez2001, Trichon et al. Reference Trichon, Hiernaux, Walcker and Mougin2018, Zwarts et al. Reference Zwarts, Bijlsma and van der Kamp2018). We view the decline of the migratory arboreal birds in the perspective of the decline and fragmentation of woody cover in the wintering area.
Methods
Sites and trees
Data were collected in 1,327 sites in West Africa (Figure 2) during 11 years, 2007–2017. In each site, we counted all trees and birds usually along three transects (50 x 300 m each) in a triangular configuration (4.5 ha in total; Zwarts et al. Reference Zwarts, Bijlsma and van der Kamp2018). We followed a stratified sampling regime by selecting study sites at latitudes intersecting tracks and roads at 16.000°N, 16.050°N and so on (between-site distances of at least 5.5 km), alternately to the left and right side of the track. We also counted birds and trees in 342 sites which were not randomly chosen.
Within the sites, we identified 553,000 individual trees and shrubs ≥ 1 m high (234 species) and measured height and canopy width. Canopy width of each woody plant was used to calculate canopy surface in a horizontal plane, assuming circular crowns. For many large trees, we counted the number of flowers (if present) and classified the opacity of the crown in five categories (Zwarts and Bijlsma Reference Zwarts and Bijlsma2015).
Birds
All data were collected during the dry season (47 sites visited in late October, 24 in November, 243 in December, 592 in January, 380 in February and 41 in early March) in sub-Saharan West Africa, when migrants from North Africa, Europe and Asia are largely sedentary (Sauvage et al. Reference Sauvage, Rumsey and Rodwell1998, King and Hutchinson Reference King and Hutchinson2001, Blackburn and Cresswell Reference Blackburn and Cresswell2016) and co-occur with African residents. Neither migrants (by definition) nor residents were involved in activities related to breeding.
For the present analysis, we disregard bird species using trees only as a roost (e.g. doves and sparrows), or as a perch to take prey from the ground or the air (shrikes, flycatchers, Common Redstart Phoenicurus phoenicurus). We identified and counted all birds present in trees within the sites. This took 16 min/ha on average, varying between 1 and 205 min/ha, depending on woody cover and birds present. The methods are extensively described in Zwarts and Bijlsma (Reference Zwarts and Bijlsma2015). All individual trees were watched with two or three observers for as long as necessary to detect all birds present, varying between some seconds for a small woody plant to 50 minutes for a tall tree. Counting all birds present, separately per tree, was reliable for several reasons: (1) most trees were standing apart; (2) trees were not large (88% < 5 m high and 1% > 10 m); (3) most data were collected in the dry season when the foliage was not dense (see photos in Figures 2, 3 and 6) or even absent; (4) no data were collected during the hottest part of the winter (i.e. late March and April, when temperatures soar and birds have inactive periods during the day), and (5) all bird species actively foraged throughout the daylight period during the northern winter; non-foraging covered only a few percent of the time and hardly varied during the daylight period (Figure 10 in Zwarts and Bijlsma Reference Zwarts and Bijlsma2015). Hence we used all daylight hours to do bird counts. We tested the validity of our claim of being able to count absolute bird numbers and found them reliable (Zwarts and Bijlsma Reference Zwarts and Bijlsma2015).
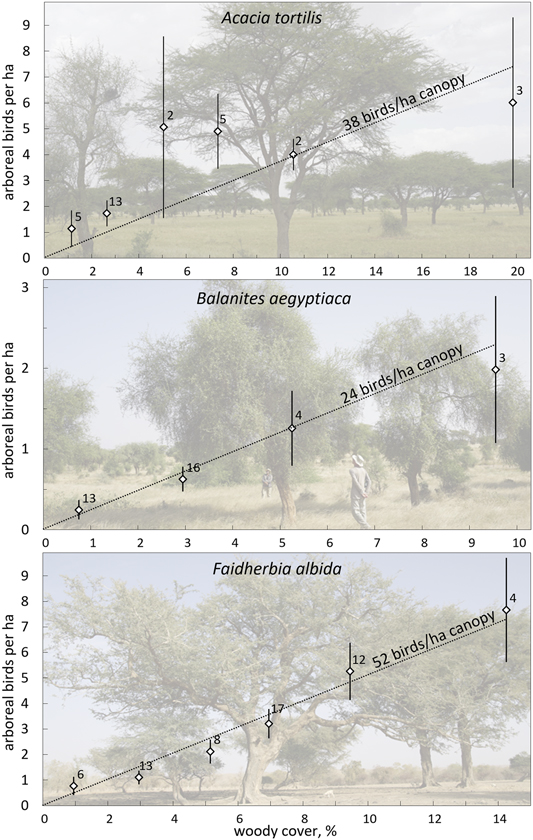
Figure 3. Average number of arboreal birds per ha (± SE) as a function of the woody cover in 4.5-ha sites dominated by one of the preferred tree species (> 70% of the total woody cover): A. tortilis (top), Balanites (middle), Faidherbia (bottom). Number of sites given. Averages are calculated per category of woody cover (< 2%, 2–4%, 4–6%, etc.), but the few sites with the highest woody cover are taken together (A. tortilis (8–14%; 14–28%, Balanites: 6–14%, Faidherbia: 8–12, 12–18%;). The lines show the expected relationship if bird density would be directly proportional to the woody cover, with a similar density per ha canopy independent of woody cover. χ2-tests confirmed that observed and expected average values did not differ (A. tortilis: χ2 = 9.04, df = 5, P > 0.10; Balanites: χ2 = 0.07, df = 3, P > 0.99; Faidherbia: χ2 = 0.50, df = 5, P > 0.99).
Bird names used are according to del Hoyo et al. (Reference del Hoyo, Elliott, Sargatal, Christie and de Juana2017). Isabelline and Olivaceous Warbler Iduna opaca and I. pallida (until recently known as Western and Eastern Olivaceous Warbler) were not always distinguished, and therefore lumped as ‘Olivaceous’ Warbler; Common and Iberian Chiffchaff Phylloscopus collybita and P. ibericus were, for the same reason, lumped as (Iberian) Chiffchaff; see also Table S2 in the online supplementary material.
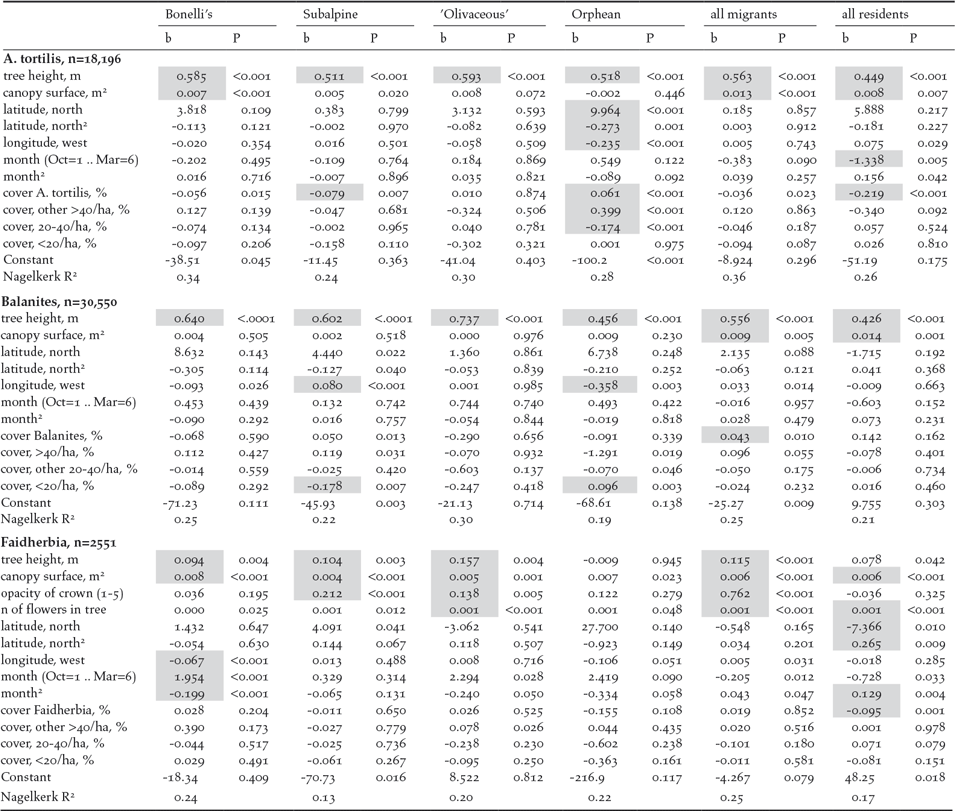
In the three species of tree selected for this study we recorded 5,287 arboreal birds, among which 3,899 migrants (17 species) and 1,388 residents (40 species). The four most common migratory bird species were Western Bonelli’s Warbler Phylloscopus bonelli (32% of all birds seen), Subalpine Warbler Sylvia cantillans (21%), ‘Olivaceous’ Warbler (7%) and Western Orphean Warbler Sylvia hortensis (4%). Table S2 gives a list of bird species with total numbers.
Analysis
We use three definitions for bird numbers in relation to woody cover: (1) Total woody cover is defined as the sum of the canopy surface of all woody plants, expressed as percent of the surveyed area (usually varying between 1 and 20% excluding the humid sites in Guinea-Bissau; Figure 2). Since all individual trees were measured separately, the woody cover is also known per woody species. (2) Bird density per ha is based on the number of birds counted in sites with known surface. (3) Bird density per ha canopy is number of birds per ha canopy (the latter measured in a horizontal plane), excluding all open areas in-between. Thus, with a density of 2 birds/ha in sites with a woody cover of 1 and 5%, the bird density per ha canopy arrives at 200 and 40 birds/ha canopy, respectively. Since we noted all birds per individual tree, we are also able to calculate the bird density per ha canopy for each woody species.
For our analysis it is important to distinguish between birds per ha and birds per ha canopy. If bird densities per ha were directly proportional to woody cover (the dotted line in Figure 1), this would equate to similar bird densities per ha canopy, but if birds avoid sites with few trees, we expect a stronger decline in bird density than expected from the decline in tree density.
Three analyses were carried out to link bird density to woody cover:
1. Bird density related to woody cover
As the density of arboreal birds is tree specific (Zwarts et al. Reference Zwarts, Bijlsma, van der Kamp, Sikkema and Wymenga2015), we selected homogeneous sites where Balanites aegyptiaca, Faidherbia albida or Acacia tortilis were dominant, i.e. contributed to > 70% of total woody cover. The total woody cover in these sites varied between 0.03% and 12.3% in the selected individual Balanites sites, between 0.39% and 17.0% in Faidherbia sites and between 0.19% and 28.6% in A. tortilis sites. We performed multiple regression analyses to find out whether bird density per ha canopy was dependent on (1) percent woody cover in the 4.5-ha sites , (2) percent woody cover of Balanites, Faidherbia or A. tortilis relative to total woody cover, (3) percent woody cover of other woody species where bird density was > 40 birds per ha canopy relative to the entire woody cover (= 100%) (Table S1), (4) percent of woody cover taller than 10 m, (5) longitude, (6) latitude and (7) season (Oct = 1 to March = 6). For latitude and season, we added a quadratic function to account for a curvilinear relationship. The analyses were done in three steps: only woody cover (1), woody cover plus variables related to the surrounding woody vegetation (1 – 4), and all variables, thus including geographical and seasonal variation. Bird density per ha canopy was separately analysed for Balanites, Faidherbia and A. tortilis, for all migrants, for all birds and for each of the four most common bird species, in total 20 analyses.
2. Birds in very isolated trees
Over the years, we came across five large, very isolated Faidherbia trees, i.e. without any trees within 100 m and very few other trees within 250 m (total woody cover 0.1–0.5%). Numbers of birds in these trees was compared to bird numbers in 81 Faidherbia trees of similar size (10–16 m high; 16–25 m wide), latitude (14.6–18.0°N) and longitude (3–15°W) in our counting sites with a total woody cover of 3.6–9.9%. For the comparison of bird numbers in the more and less isolated trees, we did seven one-way analyses of variance, for the four most common species, for migrants, all residents and all birds combined.
3. Presence of birds in trees related to woody cover
We opted for the use of logistic regression analyses based on presence/absence of birds in an A. tortilis, Balanites or Faidherbia tree, because birds were absent in 93% of the individual trees of these three woody species. If present, 90–93% of Subalpine, ‘Olivaceous’ and Orphean Warblers and 53% of Bonelli’s Warblers were foraging singly (Table S3B). The presence of bird species in individual trees has been shown to depend on the condition of the tree: height, canopy surface, opacity of the crown and number of flowers and berries (Zwarts and Bijlsma Reference Zwarts and Bijlsma2015, Zwarts et al. Reference Zwarts, Bijlsma, van der Kamp, Sikkema and Wymenga2015). To include the possible impact of nearby trees, we calculated woody cover per study site for trees belonging to the same species, and for other tree species with varying attraction to birds (i.e. with densities of > 40, 20–40 and < 20 birds/ha canopy). This allows for analyses of woody cover impact independent of quality and diversity of the surrounding woody vegetation. The preferred woody species (average foraging density > 20 birds/ha canopy) are given in Table S1. We added month (October-March) and month2 to account for possible seasonal variation in bird density, and latitude, latitude2 and longitude to account for possible geographical variation. To test which variables had a significant effect on the presence of birds in a tree, we performed 18 logistic regression analyses, separately for Balanites, Faidherbia and A. tortilis, for the four most common bird species, for the total number of migrants and for the total of all birds.
Results
Fifty-eight percent of the arboreal birds in our sites were concentrated in three woody species: Acacia tortilis (in our sample: 19,361 trees covering a total tree canopy of 198,580 m2), Faidherbia albida (7,474 trees and 450,777 m2) and Balanites aegyptiaca (31,231 trees and 208,169 m2), in total 9.9% of the summed canopies of all woody plants in our sample (Zwarts et al. Reference Zwarts, Bijlsma, van der Kamp, Sikkema and Wymenga2015; Table S1). We focus our attention on these three species which occur in overlapping latitudinal bands: A. tortilis at, on average ± SD, 16.0 ± 1.1°N (297 ± 107 mm rain per year), Balanites at 15.4 ± 1.3°N (379 ± 154 mm rain) and Faidherbia 14.1 ± 1.0°N (596 ± 281 mm rain). For our first analyses, we selected sites where these tree species contributed more than 70% to the total woody cover: 30 sites for A. tortilis, 36 sites for Balanites and 60 sites for Faidherbia.
Higher tree densities showed more arboreal birds in sites dominated by A. tortilis, Balanites and Faidherbia (Figure 3). The average numbers of birds observed in sites with variable woody cover did not deviate from the expectation of direct proportionality. Bird density averaged 38 birds/ha canopy in sites dominated by A. tortilis, 24 birds/ha canopy in sites with Balanites and 52 birds/ha canopy in sites with Faidherbia and it was clearly not less than these averages when the woody cover was very low (Figure 3). Bird density per ha canopy was, on average, independent of woody cover. This was true for all migrants and for all bird species combined, as well as separately for the four most common bird species (Table S4: step I). The relationship between bird density per ha canopy and woody cover remained non-significant in all 20 multiple regression analyses when variables related to the surrounding woody vegetation were entered into the equation (Table S4: step II). Addition of other variables did not change the non-significant relationship between woody cover and bird density (Table S4: step III: month, month2, north, north2, west). Evidently, birds in our study sites used trees in proportion to abundance with a woody cover as low as between 0.5 and 20%, i.e. a woody cover still exceeding threshold B (Figure 1).
Trees occurring at a lower woody cover than 0.5% were exceedingly rare. However, five isolated Faidherbia trees (no other trees within 100 m) translated into a woody cover of 0.1–0.5%. These isolated trees were used by more birds, though not significantly so, than 81 less isolated Faidherbia trees occurring at a woody cover of 4–10% (Table S5). This suggest that single trees have to stand even farther apart than available in our large sample before they may become less attractive to arboreal birds in West Africa.
We found no evidence that the likelihood of a bird using an individual tree depended on the woody cover in its surrounding. Eighteen logistic regression analyses (for different bird and tree species) revealed that woody cover nearby had no systematic positive impact on the presence of a bird in a tree. The presence of birds in a tree was a function of properties of the tree (tree height, canopy surface) and not, or much less so, of longitude, latitude and season (Table 1). The woody cover of surrounding trees belonging to the same species had eight times a positive (2x significant), but 10 times a negative impact (1x significant). For other, preferred, woody species, the impact of woody cover was 11 times positive (1x significant), but seven times negative. The woody cover of less preferred species had mostly a negative impact (only nine times positive of which 1x significant) and 27 times negative (2x significant). These opposite trends cannot be attributed to tree or bird species (details in Table 1). It should be noted that samples are very large. As a result, very weak, and in practice trivial, effects become statistically significant. In conclusion: the presence of birds in a tree depends on the properties of the tree but not on woody cover nor on tree composition in the surrounding. This conclusion holds for arboreal bird species of scrubland (‘Olivaceous’ Warbler, Subalpine Warbler, Western Orphean Warbler), but also for Bonelli’s Warbler, in its breeding quarters a typical woodland bird.
Table 1. Eighteen logistic regression analyses to test whether the presence of birds in a tree is a function of 11 (A. tortilis, Balanites) or 13 (Faidherbia) variables, done separately for the four most common species, for all migrants and all residents together. b = unstandardized coefficient, P = significance; grey cells refer to significant variables (P <0.01). Note that tree size and tree condition are nearly always significant, but season, latitude and longitude mostly not. Only 9 of the 72 variables measuring the woody cover in the surrounding are significant, of which 4 positive. Sample size is smaller than in Table S3A, because Table S3 is based on all investigated trees, while this Table only uses trees from 4.5-ha sites where woody cover was measured. The sample size of Faidherbia is further reduced because opacity and flowers were only noted for larger trees.
Discussion
Bird density in trees (expressed as birds per ha canopy) in the Sahel and Sudanian zone were not influenced by the local woody cover (Figure 3; Table S4), nor were very isolated trees avoided (Table S5). Also, the presence of birds in individual trees was not influenced by percentage of woody cover, nor by height and species composition of the woody vegetation in the vicinity (Table 1). It might be that the woody cover has to be still lower than found in our West African sites before isolated trees are used less and even be still lower before they are avoided (Figure 1).
Why not fewer birds in scattered trees?
We expected fewer arboreal birds in scattered trees for two reasons. First, an increase in travel time between trees far apart enhances exposure and hence predation risk. The predation risk from bird-hunting raptors can be substantial, especially where prey concentrations attract avian predators (e.g. Lindström Reference Lindström1989, Götmark and Post Reference Götmark and Post1996, Cimprich et al. Reference Cimprich, Woodrey and Moore2005). However, in West Africa bird-hunting raptors are rare in the almost treeless north (Figure 4), and even more so during the dry season when most species move to the south (Thiollay Reference Thiollay1978). Avian predators progressively increased in numbers farther south in the Sudanian and Guinean zones during the dry season (Figure 4). The scarcity of bird-hunting raptors in the open landscapes of deserts and savannas during the dry season, not just nowadays (Anadón et al. Reference Anadón, Sánchez, Carrete, Donázar and Hiraldo2010) but also before raptors started to decline (Thiollay Reference Thiollay1978, Reference Thiollay2006), reduces the vulnerability of passerines. In fact, several raptor species used in Figure 4 have a diverse diet with a high proportion of lizards and insects on top of birds (Shikra Accipiter badius, Dark Chanting Goshawk Melierax metabates), whereas the other species to a large extent prey on ground-feeding birds such as doves, pigeons and granivorous passerines (Brown et al. Reference Brown, Urban and Newman1982). Of 32 avian plucks collected during our surveys, 25 were of ground-feeding birds (of which 10 were doves and pigeons and only two passerines, i.e. Speckle-fronted Weaver Sporopipes frontalis and Chestnut-bellied Starling Lamprotornis pulcher) (R. Bijlsma, unpubl.). Even considering biased sampling (larger, light-coloured prey remains easier to detect than small dull-coloured passerines) concords with our field observations of avian predators hunting for open-land-birds rather than arboreal birds. Predation risk for arboreal passerines in open landscapes in West Africa must therefore be very low, especially during the dry season, though not completely absent.
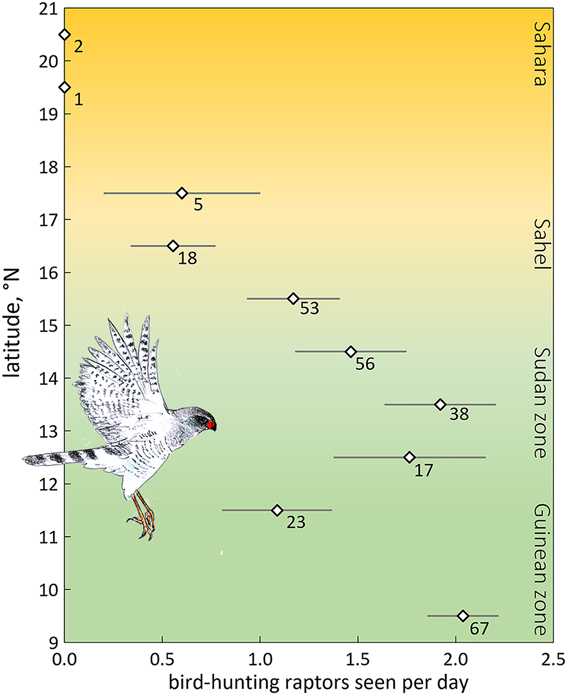
Figure 4. Average number of bird-hunting raptors seen per day (± SE) by one and the same observer during the dry season, 2004–2017 (48 days in November, 58 in December, 77 in January, 69 in February, 28 in March; in total 280 days and ∼3,000 observation hours) as a function of latitude in West Africa (16.9°W–7.8°E). A selection is made for birds detected within 100 m. Number of field days is given. Data for the Guinean vegetation zone (5.6–11°N) were lumped. Of the 50 raptor species observed, nine were considered potential predators of arboreal passerines: Shikra Accipiter badius (in total 77 birds seen), Black Sparrowhawk A. melanoleucus (n = 3), Ovambo Sparrowhawk A. ovampensis (n = 6), Lanner Falcon Falco biarmicus (n = 136), Red-necked Falcon F. chicquera (n = 71), African Hobby F. cuvierii (n = 20), Peregrine Falcon F. peregrinus (n = 3), Dark Chanting Goshawk Melierax metabates (n = 166) and Gabar Goshawk Micronisus gabar (n = 82). Data of R.G Bijlsma (unpubl.).
Many studies have shown that birds tend to forage in flocks when predation risk is high (e.g. Myers Reference Myers1980a, Reference Myers1980b, Suhonen Reference Suhonen1993, Thiollay Reference Thiollay1999). About 51% of all arboreal insectivorous migrants in our study were recorded as solitary foragers (Table S3B), especially in Balanites and Acacia tortilis. Phylloscopus species were more inclined to forage in (small) flocks than Sylvia and Hippolais warblers (Salewski et al. Reference Salewski, Bairlein and Leisler2002, Zwarts and Bijlsma Reference Zwarts and Bijlsma2015, Willemoes et al. Reference Willemoes, Tøttrup, Lerche-Jørgersen, Jacobsen, Reeve and Thorup2017). If predation risk had been a decisive factor in behavioural decisions, a higher proportion of flocking would have occurred, especially in the Sudanian and Guinean zones where avian predators were more commonly encountered. Our data are insufficient to detect a possible latitudinal trend in flocking behaviour, because of the scarcity of Palearctic migrants in the southern section of our study area.
Another reason to expect fewer birds in single trees is that travelling between trees goes at the expense of foraging time. Total daily travel time, however, not only depends on the distance between trees, but also on the frequency with which birds have to cross open areas to fly from one tree to another. Theoretically, the negative impact of travel time on time budget and energy budget should diminish with increasing staging time per tree. We have no quantitative data on time budgets, but ample evidence (from watching large trees uninterruptedly for usually 10–20 min) suggests that many birds stayed in large trees for prolonged periods of time. The frequency of flights may increase when trees are smaller or without leaves, flowers or berries; food is then often absent or quickly depleted, necessitating a flight towards another tree. In fruit-bearing Salvadora persica shrubs, for example, the few ripening berries were constantly being depleted by patrolling birds (Zwarts and Bijlsma Reference Zwarts and Bijlsma2015, see also Price et al. Reference Price, Woinarski and Robinson1999). In the Sahara, Sahel and Sudanian zone of West Africa, where most insectivorous birds forage in the larger trees (Zwarts et al. Reference Zwarts, Bijlsma, van der Kamp, Sikkema and Wymenga2015), total daily travel time between trees is likely to be insignificant.
Why not more birds in scattered trees?
Using an S-curve to describe the theoretical relationship between bird numbers and woody cover (grey line in Figure 1) is too simplistic, because it overlooks the possibility that lower woody cover may attract more birds, instead of less. In fact, fewer trees in an area may lead to bird concentrations. This may especially be the case during migration when single trees in otherwise inhospitable habitats may attract more birds than the same tree would when growing in wooded savanna. However, our study (October–March, but mostly November–February) coincided with the stationary period of migrants and many defended a feeding territory (Zwarts and Bijlsma Reference Zwarts and Bijlsma2015), precluding any concentration of birds.
Secondly, although open landscapes with fewer trees may force birds to spend more time flying between trees, the cost in terms of predation risk may be lower than in more densely wooded areas given the scarcity of bird-hunting raptors (Figure 4; see also Niethammer Reference Niethammer1959) in combination with the lack of cover for avian predators and the increased difficulty of ambushing prey.
Thirdly, arboreal birds in West Africa show much interaction when close together (Salewski et al. Reference Salewski, Almasi, Heuman, Thoma and Schlageter2007, Zwarts and Bijlsma Reference Zwarts and Bijlsma2015), including agonistic behaviour like chases and bill-rattling, likely affecting the distribution of individual birds. Most ‘Olivaceous’, Orphean and Subalpine Warblers were recorded as singles in trees, even in large Faidherbia (Table S3B), chasing away intruding congeners, but also smaller species (Zwarts and Bijlsma Reference Zwarts and Bijlsma2015). Detecting and repelling other birds is energetically most costly when trees within a feeding territory stand far apart (Figure 5), probably reducing interference competition. With scattered feeding patches, subdominant birds will have more opportunities to feed unmolested within the home range of dominant birds. As a consequence, scattered trees may attract more birds. In fact, interference allows for widely distributed food items to be more extensively used. For example, on intertidal mussel beds more Herring Gulls Larus argentatus, Common Gulls L. canus and Oystercatchers Haemantopus ostralegus were feeding than on nearby loose mussel clumps, but when calculated for the area covered by mussels feeding density was extremely high on loose clumps. The predation rate was much higher when the same food items were more widely spaced (Zwarts and Drent Reference Zwarts, Drent, Jones and Wolff1981). Denslov (1987) also found that, due to competition among frugivores, relatively more fruit was eaten from isolated bushes than from aggregated plants. In contrast, a higher predation rate in plots with more fruit was found by Sargent (Reference Sargent1990), but in her experiment birds were foraging in flocks, negating the dispersive impact of interference.
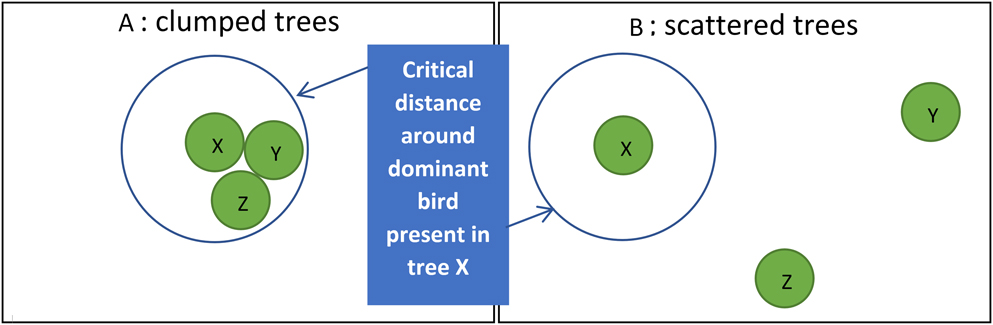
Figure 5. When a dominant bird lives in a home range with three trees close together (X, Y and Z), other birds are chased away (A), but when trees are more widely scattered (B), other birds may forage in a tree as long as the dominant bird is absent here.
Implications
Arboreal migratory birds in West African deserts and savannas do not avoid scattered trees. Tree selection in West Africa is not governed by the spatial distribution of trees but rather by tree species and properties of the tree itself (Zwarts et al. Reference Zwarts, Bijlsma, van der Kamp, Sikkema and Wymenga2015). However, it is important to note that we studied foraging, non-breeding birds in a landscape with a very low predation risk. Our conclusion should not be generalised to settings where birds run a higher predation risk, nor to breeding birds for which dispersion depends on so many other variables (e.g. Robinson et al. Reference Robinson, Thompson, Donovan, Whitehead and Faaborg1995, Pulido and Díaz Reference Pulido and Díaz1997, Hinsley Reference Hinsley2000, Norris et al. Reference Norris, Stuchbury and Thompson2002).
In the deserts and savannas of West Africa, the density of birds per ha is proportional to woody cover because bird density per ha canopy does not vary with woody cover (Figure 3). This implies that (1) scattered, and even very isolated, trees are as attractive to foraging arboreal birds as trees in a more densely wooded habitat, and (2) habitat loss due to a decline of woody cover is concomitant to a similar decline in arboreal bird numbers without an additional, negative effect of fragmentation itself (sensu Fahrig Reference Fahrig2003).
Open landscape with scattered trees (desert, savanna, rangeland, cropland) is relatively rare in Europe but widely distributed across the world, especially in the subtropics, covering in Africa 14 million km2 or nearly half of the continent (Loveland et al. Reference Loveland, Reed, Brown, Ohlen, Zhu, Yang and Merchant2000, Mayaux et al. Reference Mayaux, Bartholomé, Fritz and Belward2004).
Scattered trees have a disproportionately large ecological function worldwide (reviewed by Manning et al. Reference Manning, Fischer and Lindenmayer2006). Thinning trees in an already very open landscape may have large impacts on breeding and ground-feeding birds (e.g. Seymour and Simmons Reference Seymour and Simmons2008). Isolated trees are also important for migratory woodland birds. We estimate, using our own unpublished data on distribution and abundance of migratory birds in West Africa, that more than 500 million Eurasian arboreal migrants spend the northern winter in open landscapes in Africa south of the Sahara, where trees stand apart, and continuous woodland – often the typical habitat in the breeding quarters – is rare or absent (Figure 2). Most woody species attractive to arboreal birds in this section of West Africa (Table S1) are found in these open drylands (Figure 6). This explains why so many migrants spend the northern winter in the southern Sahara Desert and Sahelian savanna (dominated by woody species attractive to birds: several Acacia species and Balanites) and, more to the south, in human-modified open landscapes, of which cropland with scattered Faidherbia trees (Figure 6) stands out with a very high density of woodland birds (Zwarts et al. Reference Zwarts, Bijlsma, van der Kamp, Sikkema and Wymenga2015).

Figure 6. Farmland with harvested millet and scattered Faidherbia. This type of landscape, intensively used by man, is widespread in the Sahel and harbours many arboreal birds, mainly migrants. Photo taken in Niger at 13.899°N, 7.596°E on 12 December 2016.
The impact of herders and farmers in West Africa on the open landscape with scattered trees has increased during the last few centuries. Birds depending on this type of habitat are particularly vulnerable, since a small change in land use (e.g. a further increase of grazing pressure by livestock preventing regenerating of the woody vegetation, or a shift of Faidherbia agricultural parkland (Figure 6) into other types of cropland) may have negative repercussions for large numbers of migratory arboreal birds.
Supplementary Material
To view supplementary material for this article, please visit https://doi.org/10.1017/S0959270918000217
Acknowledgements
We thank Christiaan Both, Bernd de Bruijn, Ralph Buij, Eddy Wymenga and two anonymous referees for support and/or helpful comments on the manuscript, and Marten Sikkema and other colleagues from A&W who helped to collect the field data. Jos Zwarts kindly provided bird drawings. The field work in Africa was financed from the 2013 Nature Conservation Award to Rob Bijlsma by the Edgar Doncker Fund and by Vogelbescherming Nederland, partner of BirdLife International.