Moderator (Mr P. Murphy): Hello everyone and thank you for joining us for this presentation on insurers’ hidden risk from reinsurance recaptures.
Mudi (Ugono) and Jamie (Funnell) are going to be talking about the risks that come from reinsurance recapture. Mudi has spent a lot of time at the Prudential Regulation Authority (PRA) where he gained extensive experience as a policymaker, insurance supervisor, and in more traditional actuarial roles. He currently leads the PRA insurance division’s counterparty risk specialism, and he is a member of the IFoA Life Board and the Life Standards and Consultation Committee. Mudi was the driving force behind the working party that developed this report, working from his initial development of the idea.
Jamie is a qualified actuary in the longevity risk management division at PIC with a responsibility for the reinsurance of longevity risk. He joined PIC in 2018, having previously worked at the PRU and at Barnett Waddingham. He spent his career analysing and interpreting longevity risk. Jamie is chair of the Continuous Mortality Investigations Annuity Committee, ensuring that the CMI continues to produce informative analysis of the annuity market for its subscribers.
Mr M. Ugono, F.I.A.: A full discussion on what is presented here can be found in our corresponding report.
Fundamentally, within Solvency II, writing annuities is fairly well recognised as being somewhat capital intensive. Often, the risk margin is an area of discussion. We have observed increased activity amongst annuity writers to offload some of their longevity risk. Part of the focus of the working party was looking at what some of the consequences of such activity were and we refer to this as hidden risk. One way to think about the hidden risk is through the lens of it not being obvious. There are, as a result, micro and macro risks that arise as a result and, perhaps unsurprisingly, this has increased the interest amongst stakeholders, including regulators. About a year or 18 months ago, there was limited information available in this area. There is a lack of publicly available information on risk margin, INTP and on matching adjustment.
The two main objectives of the working party are:
-
(1) to raise risk awareness consistent with my earlier point around lack of publicly available information in this area;
-
(2) to support market practitioners.
We see a lot of benchmark reports by a range of consultancies looking at various aspects of the internal model and we thought that any information in the space of benchmarking, and giving a little bit of a flavour of what different firms are doing, would be helpful to market practitioners.
So, we essentially set out to come up with a methodology and approach to help in understanding market practice in this area. In order to try to ensure that the questions we were answering were the most impactful, we adopted a hypothesis type approach to help frame the problem and focus our queries. There were seven themes identified, which were subsequently mapped into sixteen hypotheses, which then helped to drive the types of questions that we asked (58 questions in total) (Table 1).
Table 1. Working party themes and hypotheses
Confidentiality of data was really important. We ensured that throughout the entire process confidentiality was maintained and preserved.
The survey participants in summarized form are as below:Footnote
1
-
Total number of survey respondents: 6 (5 of the 8 currently active pension risk transfer writers (buy-outs and buy-ins) were represented).
-
Total value of transactions (buy-outs and buy-ins) conducted by survey respondents between 2009 and H1 2020: £110bn or c.75% of the UK market.
-
Total number of transactions (buy-outs and buy-ins) completed between 2009 and H1 2020: 1670 or c.95% of the UK market.
-
Market share of active annuity writers (buy-outs and buy-ins) between H2 2019 and H1 2020: £22bn or c.55% of the UK market.
-
Likelihood of respondents providing a quote for buy-in or buy-outs: Full range represented, from transactions of less than £50m to more than £2bn, including deferred lives.
We had a good cross-section of respondents represented in the survey. A wide range of outcomes was quoted by the survey participants – volumes or values as low as £50 million up to an excess of £2 billion were included in responses based on both pensions and deferred lives.
“Reinsurance recapture” is the term that we use for the purpose of this report, but there are other terms, such as “recollateralisation risk” or “risks in the event of pre-reinsured risk returning onto the balance sheet” that have the same meaning. Often when we talk about recapture, our instinct would be to talk in terms of the provisions within the actual reinsurance treaty terms, and that is a fairly natural starting point. However, there is another consideration. Within the report we refer to it as “synthetic reinsurance recapture”, but essentially it is the event where, for some reason, the reinsurance arrangement ceases to be recognised for regulatory reporting purposes and has been recognised for capital relief. Certainly, that possibility does not always come through quite as clearly as recapture events that you may think exist as per the contractual wording, but it is one to be mindful of.
We asked survey respondents what would occur in the event of their material reinsurance recapturing and what the impact on the loss of solvency coverage would be as a consequence. The responses were as below (Figures 1, 2):
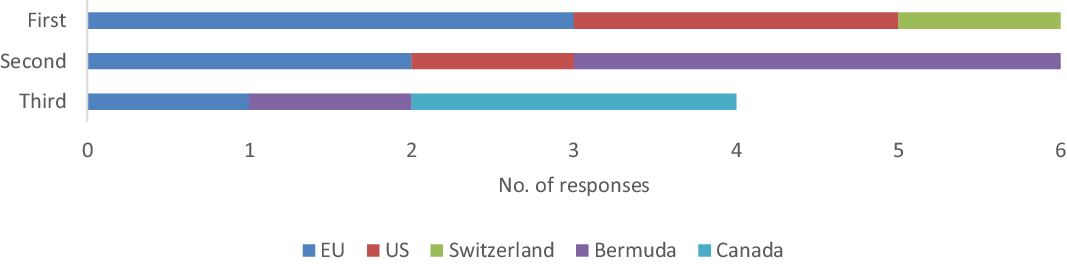
Figure 1. Top 3 reinsurance destinations for UK annuity risk(s).
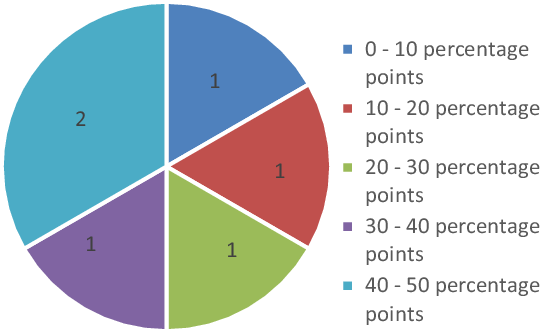
Figure 2. Loss of solvency coverage that would be incurred if all business to survey participants’ most material reinsurance counterparty was recaptured before management actions.
40 to 50 percentage points was the most frequently recorded impact on solvency coverage in the event of a material reinsurer defaulting. A useful comparison would be against the amount of SCR for counterparty risk that survey respondents were holding on average, which observation suggests is about 1%. Essentially, the impact of a recapture event is up to 50 times greater than this, which is quite a big impact for the amount being held for reinsurance counterparty capital. One point that is probably worth flagging is the nature of the reinsurance arrangements that these reinsurers are entering into. Perhaps unsurprisingly, longevity swaps and longevity reinsurance are the most widely held contracts. It is probably useful to absorb that in the context of what we have been seeing in recent years, with many annuity writers enhancing their credit capabilities. So, it appears that entering into longevity swaps or longevity reinsurance contracts is quite a complementary path.
Survey respondents said their top reinsurance destinations for UK annuity risk transfers were:
Bermuda is often a jurisdiction mentioned in the context of offshoring of risk and the expectation was that this was where some of the annuity risk transfers were heading. Interestingly, the top answer was the EU. About half of the respondents ranked the EU as the top reinsurance destination, which was certainly surprising given that at the moment the calibration and the risk margin are identical in the EU and the UK. There were conversations among the working party that highlighted, for example, some of the longevity stress calibrations and other areas that are quite judgmental, where different regulators may take different views.
Another point probably worth flagging is the attitudes different regulators might have towards seeing offshoring outside of the Solvency II regime. The headline message here is that, contrary to some of the conversations where the issues with the capital intensity of writing annuity business often get framed in the context of risk margin, there might also be other factors to bear in mind (Figure 3; Table 2).
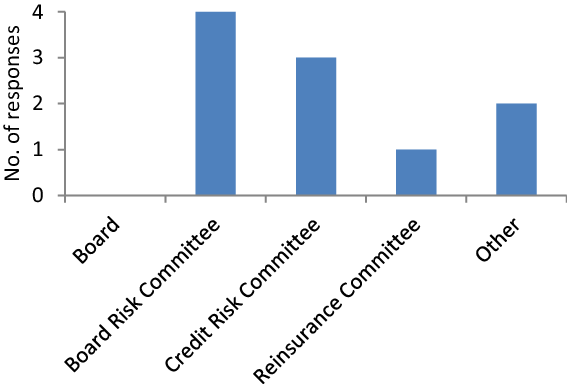
Figure 3. Key committees responsible for reinsurance counterparty exposure.
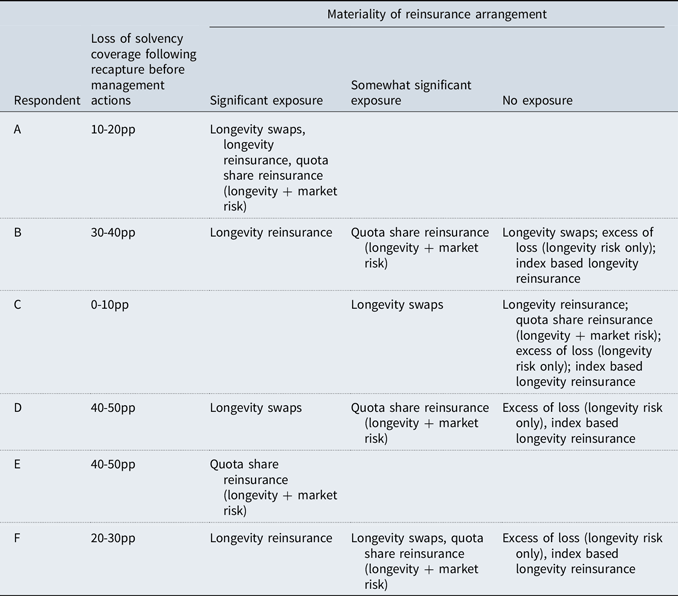
Table 2. Relationship between the loss of solvency coverage and the relative materiality of different reinsurance arrangements
Mr J. Funnell, F.I.A.: Firstly, we are going to look at what insurers do to best understand this risk that is difficult to analyse. We look at who is responsible for understanding the reinsurance counterparty exposures and what sort of information gets shared with them. Then we look at the modelling that is done to improve our understanding and to get a handle on the potential magnitude and impact on the business.
We asked a series of questions regarding who gets what information. Respondents generally told us that responsibility for reinsurance counterparty exposures gets delegated, generally below board level. We saw responses involving board risk committees, credit risk committees, and in one case, on a specific reinsurance committee.
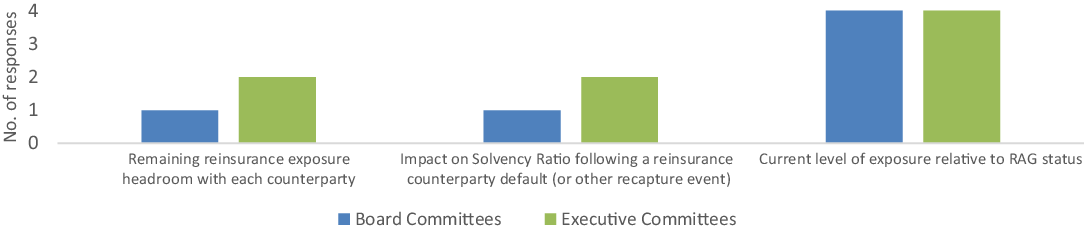
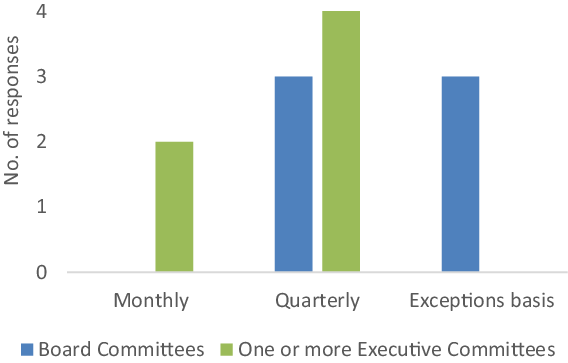
The form of communication that generally gets shared at the highest level is just a form of simple Red-Amber-Green (RAG) status against the internal risk limits. The timing of that communication generally aligns with the timings of those committee meetings. The most frequent instance was on a quarterly basis. We did see that some executive committees received more detailed information, such as remaining headroom with some counterparties, impact on solvency ratio in the case of a default, and some of that was reported more frequently than quarterly, such as monthly.
Generally, we have added some comments to say that, obviously, by delegating what could be quite a technical topic to fully understand, it gives the board more time to focus on other issues. The RAG status is a fairly simple metric for understanding how the situation stands, relative to your internal risk units (Figures 4, 5).
Figure 4. Information provided to Board and Executive Committees.
Figure 5. Frequency of reporting to Board and Executive Committees.
Next, we talk about capital modelling and the methodology and approach for that process. Much as we expected, all respondents modelled reinsurance counterparty risk within an internal model. We have seen earlier that this amounted to roughly 1% of reported year-end SCR, which is a relatively small proportion. We also considered the management actions assumed within this capital modelling process and asked questions on that topic as a key focus (Figure 6).
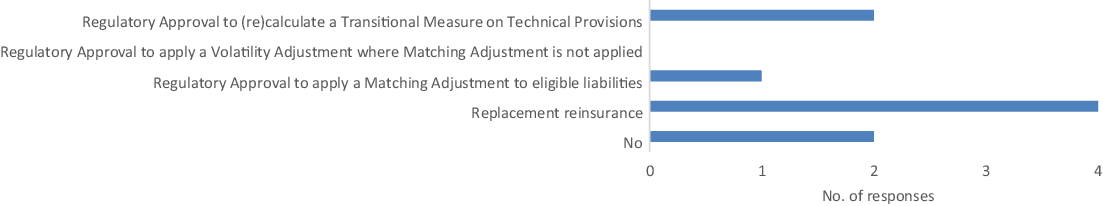
Figure 6. Assumed management actions.
We saw that replacement reinsurance was the most frequently assumed management action. Following that, we also saw assumptions to apply a TMTP in the case of default. In a couple of cases, we saw no management actions assumed. There was generally little difference in the approach between SCRs and ORSA capital and the views therein. We expected that, since internal models are meant to reflect the risk profile of the insurer. They were well aligned.
It can be assumed that replacement reinsurance will slightly simplify the capital modelling and eligibility, the MA eligibility criteria, and the stress testing. There is a question of whether it is dilutive to matching adjustments because you are not allowed to apply a fundamental spread to the reinsurance recoverable, but it is prevalent and it does materially simplify matters.
We posed this as a question to respondents: if you apply for a TMTP, you have to prove that there has been a material and a sustained change in risk profile. We go further in the report and say it is likely that a reinsured default would meet this test. We assessed seven areas to compare the SCR and also capital. Five out of six respondents said there was no difference in any of those seven areas (Table 3).
Table 3. Internal model SCR vs ORSA – Is there a difference?
For one respondent, there were differences across five of the areas (Figure 7).
Figure 7. Approach to modelling reinsurance counterparty risk (or other recapture event) within the ORSA (including SST).
The ORSA is a key management tool for insurers, alongside their stress and scenario testing, to help understand possible what-if scenarios. Obviously, in this case, we are interested in scenarios with stresses carried out to consider a reinsurance recapture event. We found that the majority of respondents take a fairly simple approach and consider a single-factor stress only, although some did consider wider scenarios as part of the ORSA. Confidentiality was a key concern with the survey responses. We could not follow up to understand the rationale for any of these decisions so we can only speculate as to why this may have been the most common response. There is certainly likely to be virtue in the simplicity of a single-factor stress to avoid causing confusion. Some may ultimately consider a wider stress to not be a plausible scenario for the ORSA (Figure 8).
Figure 8. Number of stresses and scenarios considered.
This leads to the question of whether a single-factor stress is sufficient to understand the true risk exposure. Does it convey enough information for the decision makers to make sensible decisions? We also asked about terms assumed, specifically terms for replacement reinsurance, as this was the most commonly assumed management action. We can see from the graph that some issues in the business could not be reinsured. Not everyone considered these to be reinsurable, although they have done under their SCR modelling. Two of the respondents assumed that they could reinsure it, but on less favourable terms, which suggests a prolonged period of reinsurance market stress. The other category is a combination of the first two and is dependent on the scenario that was being considered (Figure 9).
Figure 9. Assumed terms for replacement reinsurance.
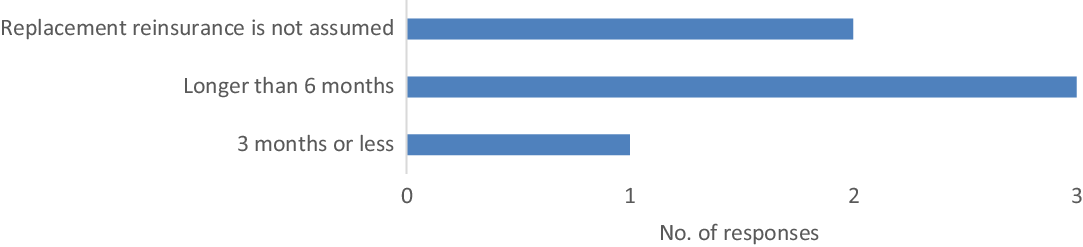
We also asked about the timing of reinsurance. The majority assumed that it would take longer than 6 months to attain although one respondent suggested that they could reinsure all of the recaptured business in less than 3 months, which seemed to be quite fast (Figure 10).
Figure 10. When replacement reinsurance is assumed to be obtained.
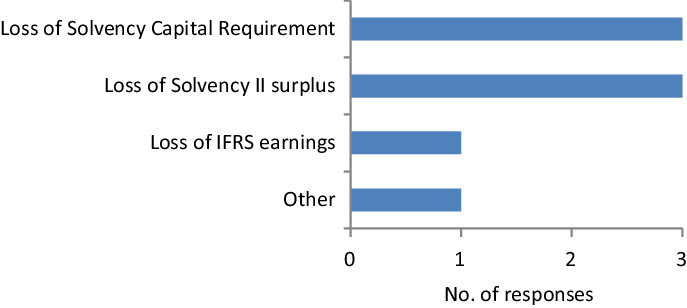
There were two questions about reverse stress testing. If there was a scenario severe enough to call into question the business as a going concern, what was the recovery plan for reinsurers to extract themselves from the scenario and again become compliant with their SCR? We found that all respondents did consider a reinsurance counterparty default or recapture of their reinsured business as part of this reverse stress test.
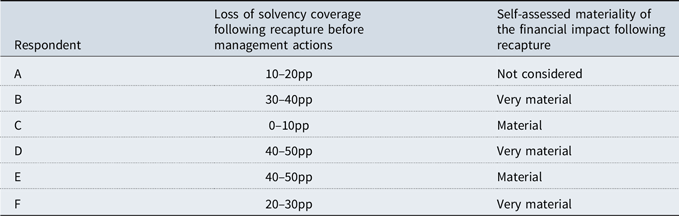
This is certainly a credible approach, given the impact on solvency is so large for such an event. The majority of respondents did identify the management actions to rectify the SCR breach that might occur on such a default. Although many did reference the longest identified management action, we do not necessarily know what the longest identified management action was, and we need to be careful how much we read into this. Some management actions would take longer than 9 months to implement. Normally, you only have six months to rectify non-compliance with your SCR. This can be extended by three months, at the supervisor’s discretion. Firms should try to understand what is likely to help the PRA come to a decision on granting the additional 3 months. Essentially there is no discretion beyond 9 months. Anything that takes longer than 9 months is not going to help rectify that SCR breach, although that is not to say it would not be useful in general (Table 4).
Table 4. Comparison of respondents’ self-assessments of the materiality of the financial impact following recapture and the consequent loss of solvency coverage before management actions
We have seen that the capital held against a reinsurance recapture risk is small relative to the potential impact that we see on the balance sheet. We will take a look at what else can be done to help manage this risk and we explore three areas: (1) the setting of risk limits and risk appetites for these exposures; (2) the use of collateral in reinsurance contracts; and (3) the existence of any provisions in the reinsurance treaties themselves to recapture this business.
-
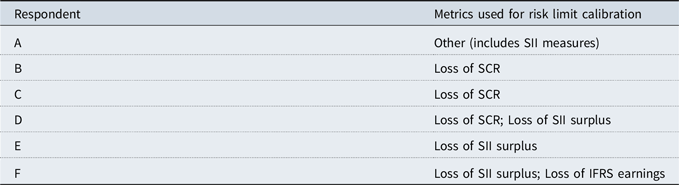
(1) Risk limits – generally set relative to a certain level of loss given default. For all respondents, for their risk limits, they assumed that reinsurers defaulted instantly, and half assumed there would be no ensuing management actions. Replacement reinsurance was the predominant management action assumed by those that did assume a management action following default (Table 5).
Table 5. Figure 11 breakdown by respondent
The only commentary we have is that instantaneous default and no subsequent management action is the most conservative approach. Another question that emerges for insurers is if it is reasonable to assume that replacement reinsurance can be arranged in 6–12 months.
In terms of risk appetite, everyone set their risk appetite at a counterparty level. A couple of insurers also set their appetite at an aggregate level, on top of that. One interpretation is that this is a more conservative approach. We also see that the assumption for correlation between reinsurers in the SCR is only 0–25% across all respondents. However, if the appetite is set on an aggregate level, simply adding the exposures then implies a perfect correlation and that is clearly more conservative than the actual capital modelling that is carried out.
-
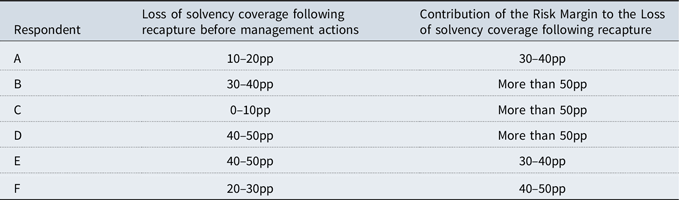
(2) Use of collateral – everyone is aware that collateral is used in contracts, and we saw that all respondents had at least one collateralised annuity-related reinsurance treaty. It is probably fair to say that many have more than one. We included Table 6 just to show the contribution of the risk margin to the loss of the solvency coverage, which we have seen earlier.
Table 6. Demonstrating that at least 30% of the loss of solvency coverage on recapture is attributed to the RM
Collateral has a purpose in reducing exposure to reinsurance counterparty risk, but it only provides partial protection in the event that you have to recapture that business, because you have to then find the risk margin and net change in SCR, exchanging counterparty risk back for longevity risk. Collateral does nothing to provide that large sum of capital required, but it will generally cover the change, considering longevity reinsurance contracts. As mentioned earlier, there are obviously asset-intensive insurances, or quota-share arrangements, where the pre-collateral counterparty exposure generally covers the whole best estimate liability and not the net exposure. The net exposure is the present value of the fixed leg minus the present value of the floating leg. The focus on collateral for those sorts of arrangements is clearly going to be far more important.
That brings us to the observation that the majority of respondents identified basic risks from the collateral from a number of areas. There is obviously a question of how big that basic risk is and what all of those collateral assets look like on a reinsurer default.
-
(3) Treaty recapture provisions – these are essentially clauses in the reinsurance contracts that allow termination of that contract and take the business back on to the balance sheet.
We can see from Figure 12 that there generally are quite a few of these in use across the industry, but the rarest among them is the synthetic recapture event that we referred to earlier, which is that the reinsurance ceased to qualify as a risk mitigation technique for some reason. It may not be related to the reinsurer being in financial difficulty and breaching their SCR, for example, where generally insurers do have a provision to recapture the business on that basis. I think that could lead to a run on the reinsurers if they are to breach their solvency and the whole industry is essentially able to recapture all their business. There could be a run on that reinsurer and there is the potential for liquidity issues for the reinsurer, and that could hasten the problems for them and produce macroeconomic consequences.
Figure 11. Metrics used for risk limit calibration.
Figure 12. Main recapture provisions contained within two or more longevity and quota share reinsurance treaties.
Mr Ugono: Thank you Jamie, that was really helpful. Let’s summarise what we’ve seen so far.
Firstly, we have seen that the impact of a default or other recapture event can be material. We have shown that it could be up to 50 points on solvency coverage for a couple of the insurers’ pre-management actions. For any kind of impact on material areas, it is important that everyone, including the Board, understand it and the levers that are available to manage it. There were a number of areas of convergence that we observed among the responses to the survey. These included the observation that the Board do tend to delegate responsibility for the management of the insurance exposures to committees. As touched upon, all respondents, for the purpose of their risk limits, assume an instantaneous default and the use of collateral. There were some areas where it could be worth considering and potentially refining this assumption, such as the fact that around half of respondents could adopt a single-factor stress approach. Does it oversimplify some of the real-world dynamics and could that be an impediment to decision makers being able to answer questions and really understand the vulnerabilities, if any, of this risk on the bad issue? In relation to collateral, there were a number of areas where there was the basis for other risks. There may be some need, in a recapture scenario, where the collateral reverts, to be able to get it into a form that meets the nature and duration of the liabilities.
On the treaty recapture provisions, it was quite noticeable that four of the six respondents did not include any provision to be able to recapture the arrangement were it to cease being recognised at litigation. So, that is quite an important area because you could find yourself being stuck in a contract that does not do what it is supposed to, with no easy way out.
Finally, the impact that a reinsurer in breach of its solvency coverage could have could leads to a potential disorderly recapture event, which could have quite major macroeconomic implications. A lot of insurance companies may be entering into insurance arrangements with the same or similar reinsurer providers, and there could be an amplified domino effect. For macroeconomic instability risk in particular this is likely to be an area of interest to regulators both in the UK and across the world.
Moderator: Thank you very much to Mudi and Jamie for that interesting presentation and we’re now going to move on to questions.
R. Bugg: Given that competitive reinsurance pricing is so central to winning competitive BPA business whilst achieving acceptable shareholder returns, are risk limits simply there to be breached if the cheapest reinsurer is also the one with the largest exposure? Did you consider ways in which placing reinsurance with counterparties who are not the cheapest can be incentivised if it helps to diversify counterparty exposures?
Mr Funnell: I think that with any risk limits you can always ask yourself that question. Arguably, nobody at the front end who is heavily involved in the business wants to necessarily be subject to a risk limit if they can make more money on it. I think these risk limits are there for a reason. I do not think they are there to be breached, as suggested, but we certainly did not consider incentives. We were not necessarily trying to break ground with this report in the sense that we are not trying to come up with lots of new ways of doing things like incentivising people to diversify their counterparty exposures. Moreso we are benchmarking what is currently done and asking questions about it. Perhaps this is a question you could ask about it, but I do not think it felt particularly central to our objectives.
Moderator: Just on that, did you look at whether there is a sort of concentration at the point where all this reinsurance ends? In other words, if you start to look across the range of reinsurers, whether there is a point where lots of this reinsurance is ending up with single entities?
Mr Ugono: That’s a really good question. I think part of the challenge is that, because of some of the issues around confidentiality, we took the view that it might have been difficult to have gotten respondents to set out their main counterparties. We tried to do it more at the aggregate level by looking at jurisdiction. Where is the reinsurance landing? It is an issue that would be good or would have been good to have probed a little bit more. Because then it can help to crystallise our comments around the reinsurers and this point about concentrations. Being able to see the counterparties themselves is critical to being able to form a view on that.
Mr Funnell: I will just add that we obviously only have the insurer-to-reinsurer relationship described here. We have no information about retrocession or where that risk is, or if that risk is getting passed on again. That is just a limitation of the questions we can ask an insurer because they may not know the answer themselves either.
Moderator: Do you have any feeling as to whether that retrocession point might impact on the conclusions you came up with about where the reinsurance is ending up? And whether that retrocession might lead to some of the places where the EU is the primary reinsurer, meaning that risk ultimately ends up outside of Solvency II?
Mr Ugono: I do not necessarily think it would have any impact on the conclusion, but I do think it raises the question around how fragile the system is. What I actually suspect is that in the UK you have a lot of branches that belong to EU parents. I suspect a lot of the activity is actually being done between cedents and branches. In the report itself, we were quite clear that, where there is a transaction where the contractual entity is with a branch, the jurisdiction should be recorded with the parent. I suspect that is what is driving the EU point in terms of the risk going to the EU. But the problem is that the process has become very opaque and it is difficult to know who the weakest link is. You might have a particular reinsurer failing and you think you have no exposure. Suddenly, you realise that they were actually holding quite a lot of retroceded risk and suddenly you get that domino effect, which I think is part of the reason why there is some concern around this kind of offshoring of risk.
Moderator: Given that the working party’s approach of considering the movement in insolvency ratio, hence fundamentally making allowance for capital, did it also consider how the insurer would be exposed if it had not reinsured, as a comparator? There is a danger here that we are ignoring the protection provided from the reinsurer’s net assets in the very scenarios that the reinsurer has defaulted, to which the insurer would have been exposed had it not reinsured.
Mr Funnell: I think the short answer is probably no. Are we saying that, on a reinsurer default, there may be wider consequences for the value of the assets? I assume that is what we are driving at but, no, we did not consider that.
Moderator: What event could lead to the reinsurance being derecognised as risk mitigation for regulatory purposes?
Mr Ugono: I think there is one example around a decision from a judge that calls into question items where you thought the meaning was that you were covered as part of the contract but in fact you weren’t. I think a really good example of this actually is COVID and business interruption cover. That was more of an issue on the GI side, but we know that the FCA test case found that actually the insurance companies were on the hook for events that the insurance companies thought were not within the scope of the contract.
Moderator: Given the UK regulatory freedom post-Brexit, can you talk about the merits of situations where you might specify what the IMSCR is?
Mr Ugono: Fundamentally, formulae that apply across the industry feel more consistent with what you might find in a standard formula. By definition, an internal model is for firms to decide an approach that best meets their risk profile. I am sure you could also consider many other formulae.
Moderator: Are there specific amendments or at least strong steer you can give around how you might toughen the IMSCR measure? The internal model IMSCR in this area might be interesting to consider. I wonder whether you think that, actually, the current process where people end up with lots of diversification benefits around this might be valid; as opposed to explicitly doing something that might make it slightly more onerous to prove the IMSCR.
Mr Ugono: No, and I do think that there may be a question around whether or not I think 1% of the SCR, a figure that we calculated, is the appropriate amount of capital. Historically, it does feel as though much collateral is heavily relied upon as well as the PD factor within the modelling. Is this right, given the number of reinsurance players in the marketplace? I do think there is a question on this point, more broadly speaking. It is difficult for me to comment further, but I can certainly see the merits of looking at it a little bit more closely.
Moderator: Jamie, do you have any different perspectives on that?
Mr Funnell: No, I think it almost comes back to Mudi’s point about the probability of these events actually happening, how it generally is assumed to be so small, is down to modelling. I am not sure this would necessarily make a massive difference to the quantum of capital we are seeing held against reinsurance counterparty default in any case. Mudi said already that there may be some arguments for it, but I don’t think it’s necessarily going to have the material result change either way.
Moderator: Yes, just because the probabilities end up being so low that, even if you had a fully reinsured broker and you were bringing the whole SCR back on in that first part of the calculation, you would then be multiplying it by less than a fraction of 1%.
Moderator: Did you observe a difference in management actions assumed on the capture of asset intensive reinsurance and longevity reinsurance?
Mr Funnell: I think the answer is no, in the sense that we weren’t able to distinguish generally for the majority of the questions between asset and longevity reinsurance because we wanted to ask around 58 questions and not 116 questions. It was a necessary simplification, but I think it would be interesting to know. There would be some different answers across the two, but that is a limitation of our survey.
Moderator: I would just like to end by saying thank you very much to everyone attending and thank you very much to Jamie and Mudi for all of the hard work that has gone into preparing the presentation today and the accompanying report.


 This is an Open Access article, distributed under the terms of the Creative Commons Attribution licence (https://creativecommons.org/licenses/by/4.0/), which permits unrestricted re-use, distribution, and reproduction in any medium, provided the original work is properly cited.
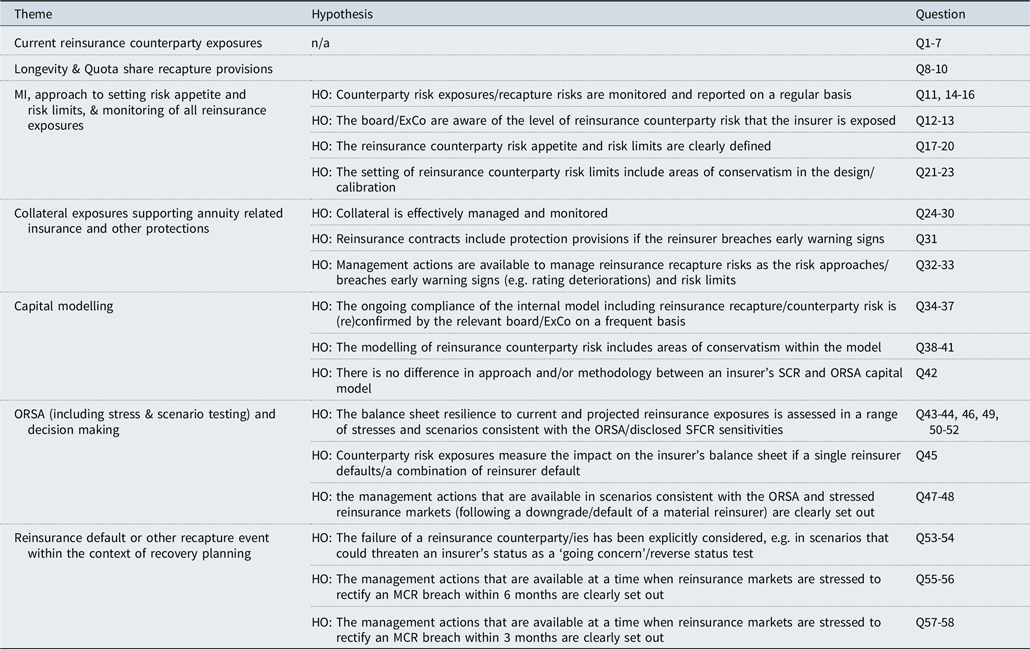
 You have
Access
You have
Access
 Open access
Moderator (Mr P. Murphy): Hello everyone and thank you for joining us for this presentation on insurers’ hidden risk from reinsurance recaptures.
Mudi (Ugono) and Jamie (Funnell) are going to be talking about the risks that come from reinsurance recapture. Mudi has spent a lot of time at the Prudential Regulation Authority (PRA) where he gained extensive experience as a policymaker, insurance supervisor, and in more traditional actuarial roles. He currently leads the PRA insurance division’s counterparty risk specialism, and he is a member of the IFoA Life Board and the Life Standards and Consultation Committee. Mudi was the driving force behind the working party that developed this report, working from his initial development of the idea.
Jamie is a qualified actuary in the longevity risk management division at PIC with a responsibility for the reinsurance of longevity risk. He joined PIC in 2018, having previously worked at the PRU and at Barnett Waddingham. He spent his career analysing and interpreting longevity risk. Jamie is chair of the Continuous Mortality Investigations Annuity Committee, ensuring that the CMI continues to produce informative analysis of the annuity market for its subscribers.
Mr M. Ugono, F.I.A.: A full discussion on what is presented here can be found in our corresponding report.
Fundamentally, within Solvency II, writing annuities is fairly well recognised as being somewhat capital intensive. Often, the risk margin is an area of discussion. We have observed increased activity amongst annuity writers to offload some of their longevity risk. Part of the focus of the working party was looking at what some of the consequences of such activity were and we refer to this as hidden risk. One way to think about the hidden risk is through the lens of it not being obvious. There are, as a result, micro and macro risks that arise as a result and, perhaps unsurprisingly, this has increased the interest amongst stakeholders, including regulators. About a year or 18 months ago, there was limited information available in this area. There is a lack of publicly available information on risk margin, INTP and on matching adjustment.
The two main objectives of the working party are:
(1) to raise risk awareness consistent with my earlier point around lack of publicly available information in this area;
(2) to support market practitioners.
We see a lot of benchmark reports by a range of consultancies looking at various aspects of the internal model and we thought that any information in the space of benchmarking, and giving a little bit of a flavour of what different firms are doing, would be helpful to market practitioners.
So, we essentially set out to come up with a methodology and approach to help in understanding market practice in this area. In order to try to ensure that the questions we were answering were the most impactful, we adopted a hypothesis type approach to help frame the problem and focus our queries. There were seven themes identified, which were subsequently mapped into sixteen hypotheses, which then helped to drive the types of questions that we asked (58 questions in total) (Table 1).
Table 1. Working party themes and hypotheses
Confidentiality of data was really important. We ensured that throughout the entire process confidentiality was maintained and preserved.
The survey participants in summarized form are as below:Footnote 1
Total number of survey respondents: 6 (5 of the 8 currently active pension risk transfer writers (buy-outs and buy-ins) were represented).
Total value of transactions (buy-outs and buy-ins) conducted by survey respondents between 2009 and H1 2020: £110bn or c.75% of the UK market.
Total number of transactions (buy-outs and buy-ins) completed between 2009 and H1 2020: 1670 or c.95% of the UK market.
Market share of active annuity writers (buy-outs and buy-ins) between H2 2019 and H1 2020: £22bn or c.55% of the UK market.
Likelihood of respondents providing a quote for buy-in or buy-outs: Full range represented, from transactions of less than £50m to more than £2bn, including deferred lives.
We had a good cross-section of respondents represented in the survey. A wide range of outcomes was quoted by the survey participants – volumes or values as low as £50 million up to an excess of £2 billion were included in responses based on both pensions and deferred lives.
“Reinsurance recapture” is the term that we use for the purpose of this report, but there are other terms, such as “recollateralisation risk” or “risks in the event of pre-reinsured risk returning onto the balance sheet” that have the same meaning. Often when we talk about recapture, our instinct would be to talk in terms of the provisions within the actual reinsurance treaty terms, and that is a fairly natural starting point. However, there is another consideration. Within the report we refer to it as “synthetic reinsurance recapture”, but essentially it is the event where, for some reason, the reinsurance arrangement ceases to be recognised for regulatory reporting purposes and has been recognised for capital relief. Certainly, that possibility does not always come through quite as clearly as recapture events that you may think exist as per the contractual wording, but it is one to be mindful of.
We asked survey respondents what would occur in the event of their material reinsurance recapturing and what the impact on the loss of solvency coverage would be as a consequence. The responses were as below (Figures 1, 2):
Figure 1. Top 3 reinsurance destinations for UK annuity risk(s).
Figure 2. Loss of solvency coverage that would be incurred if all business to survey participants’ most material reinsurance counterparty was recaptured before management actions.
40 to 50 percentage points was the most frequently recorded impact on solvency coverage in the event of a material reinsurer defaulting. A useful comparison would be against the amount of SCR for counterparty risk that survey respondents were holding on average, which observation suggests is about 1%. Essentially, the impact of a recapture event is up to 50 times greater than this, which is quite a big impact for the amount being held for reinsurance counterparty capital. One point that is probably worth flagging is the nature of the reinsurance arrangements that these reinsurers are entering into. Perhaps unsurprisingly, longevity swaps and longevity reinsurance are the most widely held contracts. It is probably useful to absorb that in the context of what we have been seeing in recent years, with many annuity writers enhancing their credit capabilities. So, it appears that entering into longevity swaps or longevity reinsurance contracts is quite a complementary path.
Survey respondents said their top reinsurance destinations for UK annuity risk transfers were:
Bermuda is often a jurisdiction mentioned in the context of offshoring of risk and the expectation was that this was where some of the annuity risk transfers were heading. Interestingly, the top answer was the EU. About half of the respondents ranked the EU as the top reinsurance destination, which was certainly surprising given that at the moment the calibration and the risk margin are identical in the EU and the UK. There were conversations among the working party that highlighted, for example, some of the longevity stress calibrations and other areas that are quite judgmental, where different regulators may take different views.
Another point probably worth flagging is the attitudes different regulators might have towards seeing offshoring outside of the Solvency II regime. The headline message here is that, contrary to some of the conversations where the issues with the capital intensity of writing annuity business often get framed in the context of risk margin, there might also be other factors to bear in mind (Figure 3; Table 2).
Figure 3. Key committees responsible for reinsurance counterparty exposure.
Table 2. Relationship between the loss of solvency coverage and the relative materiality of different reinsurance arrangements
Mr J. Funnell, F.I.A.: Firstly, we are going to look at what insurers do to best understand this risk that is difficult to analyse. We look at who is responsible for understanding the reinsurance counterparty exposures and what sort of information gets shared with them. Then we look at the modelling that is done to improve our understanding and to get a handle on the potential magnitude and impact on the business.
We asked a series of questions regarding who gets what information. Respondents generally told us that responsibility for reinsurance counterparty exposures gets delegated, generally below board level. We saw responses involving board risk committees, credit risk committees, and in one case, on a specific reinsurance committee.
The form of communication that generally gets shared at the highest level is just a form of simple Red-Amber-Green (RAG) status against the internal risk limits. The timing of that communication generally aligns with the timings of those committee meetings. The most frequent instance was on a quarterly basis. We did see that some executive committees received more detailed information, such as remaining headroom with some counterparties, impact on solvency ratio in the case of a default, and some of that was reported more frequently than quarterly, such as monthly.
Generally, we have added some comments to say that, obviously, by delegating what could be quite a technical topic to fully understand, it gives the board more time to focus on other issues. The RAG status is a fairly simple metric for understanding how the situation stands, relative to your internal risk units (Figures 4, 5).
Figure 4. Information provided to Board and Executive Committees.
Figure 5. Frequency of reporting to Board and Executive Committees.
Next, we talk about capital modelling and the methodology and approach for that process. Much as we expected, all respondents modelled reinsurance counterparty risk within an internal model. We have seen earlier that this amounted to roughly 1% of reported year-end SCR, which is a relatively small proportion. We also considered the management actions assumed within this capital modelling process and asked questions on that topic as a key focus (Figure 6).
Figure 6. Assumed management actions.
We saw that replacement reinsurance was the most frequently assumed management action. Following that, we also saw assumptions to apply a TMTP in the case of default. In a couple of cases, we saw no management actions assumed. There was generally little difference in the approach between SCRs and ORSA capital and the views therein. We expected that, since internal models are meant to reflect the risk profile of the insurer. They were well aligned.
It can be assumed that replacement reinsurance will slightly simplify the capital modelling and eligibility, the MA eligibility criteria, and the stress testing. There is a question of whether it is dilutive to matching adjustments because you are not allowed to apply a fundamental spread to the reinsurance recoverable, but it is prevalent and it does materially simplify matters.
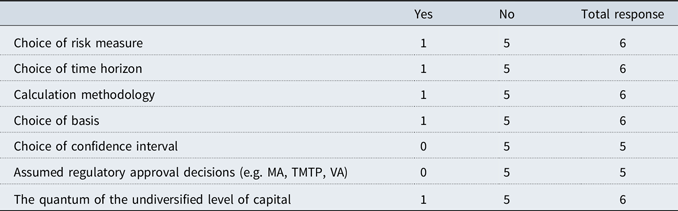
We posed this as a question to respondents: if you apply for a TMTP, you have to prove that there has been a material and a sustained change in risk profile. We go further in the report and say it is likely that a reinsured default would meet this test. We assessed seven areas to compare the SCR and also capital. Five out of six respondents said there was no difference in any of those seven areas (Table 3).
Table 3. Internal model SCR vs ORSA – Is there a difference?
For one respondent, there were differences across five of the areas (Figure 7).
Figure 7. Approach to modelling reinsurance counterparty risk (or other recapture event) within the ORSA (including SST).
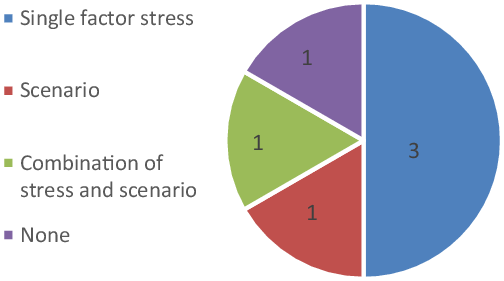
The ORSA is a key management tool for insurers, alongside their stress and scenario testing, to help understand possible what-if scenarios. Obviously, in this case, we are interested in scenarios with stresses carried out to consider a reinsurance recapture event. We found that the majority of respondents take a fairly simple approach and consider a single-factor stress only, although some did consider wider scenarios as part of the ORSA. Confidentiality was a key concern with the survey responses. We could not follow up to understand the rationale for any of these decisions so we can only speculate as to why this may have been the most common response. There is certainly likely to be virtue in the simplicity of a single-factor stress to avoid causing confusion. Some may ultimately consider a wider stress to not be a plausible scenario for the ORSA (Figure 8).
Figure 8. Number of stresses and scenarios considered.
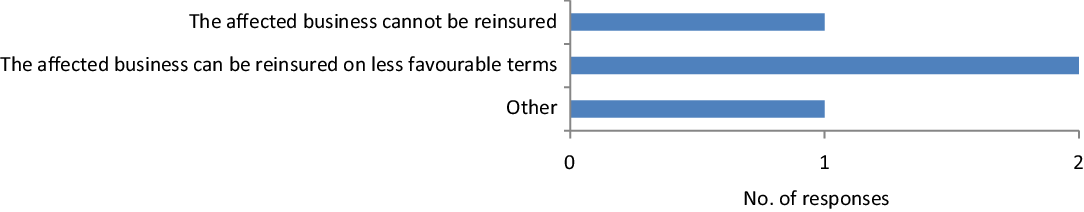
This leads to the question of whether a single-factor stress is sufficient to understand the true risk exposure. Does it convey enough information for the decision makers to make sensible decisions? We also asked about terms assumed, specifically terms for replacement reinsurance, as this was the most commonly assumed management action. We can see from the graph that some issues in the business could not be reinsured. Not everyone considered these to be reinsurable, although they have done under their SCR modelling. Two of the respondents assumed that they could reinsure it, but on less favourable terms, which suggests a prolonged period of reinsurance market stress. The other category is a combination of the first two and is dependent on the scenario that was being considered (Figure 9).
Figure 9. Assumed terms for replacement reinsurance.
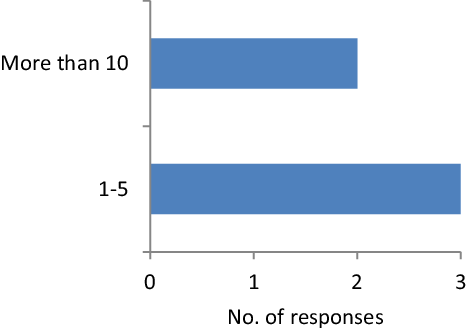
We also asked about the timing of reinsurance. The majority assumed that it would take longer than 6 months to attain although one respondent suggested that they could reinsure all of the recaptured business in less than 3 months, which seemed to be quite fast (Figure 10).
Figure 10. When replacement reinsurance is assumed to be obtained.
There were two questions about reverse stress testing. If there was a scenario severe enough to call into question the business as a going concern, what was the recovery plan for reinsurers to extract themselves from the scenario and again become compliant with their SCR? We found that all respondents did consider a reinsurance counterparty default or recapture of their reinsured business as part of this reverse stress test.
This is certainly a credible approach, given the impact on solvency is so large for such an event. The majority of respondents did identify the management actions to rectify the SCR breach that might occur on such a default. Although many did reference the longest identified management action, we do not necessarily know what the longest identified management action was, and we need to be careful how much we read into this. Some management actions would take longer than 9 months to implement. Normally, you only have six months to rectify non-compliance with your SCR. This can be extended by three months, at the supervisor’s discretion. Firms should try to understand what is likely to help the PRA come to a decision on granting the additional 3 months. Essentially there is no discretion beyond 9 months. Anything that takes longer than 9 months is not going to help rectify that SCR breach, although that is not to say it would not be useful in general (Table 4).
Table 4. Comparison of respondents’ self-assessments of the materiality of the financial impact following recapture and the consequent loss of solvency coverage before management actions
We have seen that the capital held against a reinsurance recapture risk is small relative to the potential impact that we see on the balance sheet. We will take a look at what else can be done to help manage this risk and we explore three areas: (1) the setting of risk limits and risk appetites for these exposures; (2) the use of collateral in reinsurance contracts; and (3) the existence of any provisions in the reinsurance treaties themselves to recapture this business.
(1) Risk limits – generally set relative to a certain level of loss given default. For all respondents, for their risk limits, they assumed that reinsurers defaulted instantly, and half assumed there would be no ensuing management actions. Replacement reinsurance was the predominant management action assumed by those that did assume a management action following default (Table 5).
Table 5. Figure 11 breakdown by respondent
The only commentary we have is that instantaneous default and no subsequent management action is the most conservative approach. Another question that emerges for insurers is if it is reasonable to assume that replacement reinsurance can be arranged in 6–12 months.
In terms of risk appetite, everyone set their risk appetite at a counterparty level. A couple of insurers also set their appetite at an aggregate level, on top of that. One interpretation is that this is a more conservative approach. We also see that the assumption for correlation between reinsurers in the SCR is only 0–25% across all respondents. However, if the appetite is set on an aggregate level, simply adding the exposures then implies a perfect correlation and that is clearly more conservative than the actual capital modelling that is carried out.
(2) Use of collateral – everyone is aware that collateral is used in contracts, and we saw that all respondents had at least one collateralised annuity-related reinsurance treaty. It is probably fair to say that many have more than one. We included Table 6 just to show the contribution of the risk margin to the loss of the solvency coverage, which we have seen earlier.
Table 6. Demonstrating that at least 30% of the loss of solvency coverage on recapture is attributed to the RM
Collateral has a purpose in reducing exposure to reinsurance counterparty risk, but it only provides partial protection in the event that you have to recapture that business, because you have to then find the risk margin and net change in SCR, exchanging counterparty risk back for longevity risk. Collateral does nothing to provide that large sum of capital required, but it will generally cover the change, considering longevity reinsurance contracts. As mentioned earlier, there are obviously asset-intensive insurances, or quota-share arrangements, where the pre-collateral counterparty exposure generally covers the whole best estimate liability and not the net exposure. The net exposure is the present value of the fixed leg minus the present value of the floating leg. The focus on collateral for those sorts of arrangements is clearly going to be far more important.
That brings us to the observation that the majority of respondents identified basic risks from the collateral from a number of areas. There is obviously a question of how big that basic risk is and what all of those collateral assets look like on a reinsurer default.
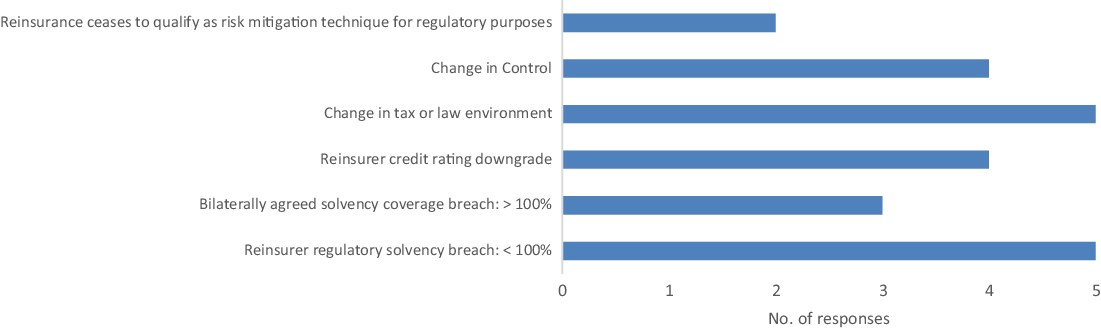
(3) Treaty recapture provisions – these are essentially clauses in the reinsurance contracts that allow termination of that contract and take the business back on to the balance sheet.
We can see from Figure 12 that there generally are quite a few of these in use across the industry, but the rarest among them is the synthetic recapture event that we referred to earlier, which is that the reinsurance ceased to qualify as a risk mitigation technique for some reason. It may not be related to the reinsurer being in financial difficulty and breaching their SCR, for example, where generally insurers do have a provision to recapture the business on that basis. I think that could lead to a run on the reinsurers if they are to breach their solvency and the whole industry is essentially able to recapture all their business. There could be a run on that reinsurer and there is the potential for liquidity issues for the reinsurer, and that could hasten the problems for them and produce macroeconomic consequences.
Figure 11. Metrics used for risk limit calibration.
Figure 12. Main recapture provisions contained within two or more longevity and quota share reinsurance treaties.
Mr Ugono: Thank you Jamie, that was really helpful. Let’s summarise what we’ve seen so far.
Firstly, we have seen that the impact of a default or other recapture event can be material. We have shown that it could be up to 50 points on solvency coverage for a couple of the insurers’ pre-management actions. For any kind of impact on material areas, it is important that everyone, including the Board, understand it and the levers that are available to manage it. There were a number of areas of convergence that we observed among the responses to the survey. These included the observation that the Board do tend to delegate responsibility for the management of the insurance exposures to committees. As touched upon, all respondents, for the purpose of their risk limits, assume an instantaneous default and the use of collateral. There were some areas where it could be worth considering and potentially refining this assumption, such as the fact that around half of respondents could adopt a single-factor stress approach. Does it oversimplify some of the real-world dynamics and could that be an impediment to decision makers being able to answer questions and really understand the vulnerabilities, if any, of this risk on the bad issue? In relation to collateral, there were a number of areas where there was the basis for other risks. There may be some need, in a recapture scenario, where the collateral reverts, to be able to get it into a form that meets the nature and duration of the liabilities.
On the treaty recapture provisions, it was quite noticeable that four of the six respondents did not include any provision to be able to recapture the arrangement were it to cease being recognised at litigation. So, that is quite an important area because you could find yourself being stuck in a contract that does not do what it is supposed to, with no easy way out.
Finally, the impact that a reinsurer in breach of its solvency coverage could have could leads to a potential disorderly recapture event, which could have quite major macroeconomic implications. A lot of insurance companies may be entering into insurance arrangements with the same or similar reinsurer providers, and there could be an amplified domino effect. For macroeconomic instability risk in particular this is likely to be an area of interest to regulators both in the UK and across the world.
Moderator: Thank you very much to Mudi and Jamie for that interesting presentation and we’re now going to move on to questions.
R. Bugg: Given that competitive reinsurance pricing is so central to winning competitive BPA business whilst achieving acceptable shareholder returns, are risk limits simply there to be breached if the cheapest reinsurer is also the one with the largest exposure? Did you consider ways in which placing reinsurance with counterparties who are not the cheapest can be incentivised if it helps to diversify counterparty exposures?
Mr Funnell: I think that with any risk limits you can always ask yourself that question. Arguably, nobody at the front end who is heavily involved in the business wants to necessarily be subject to a risk limit if they can make more money on it. I think these risk limits are there for a reason. I do not think they are there to be breached, as suggested, but we certainly did not consider incentives. We were not necessarily trying to break ground with this report in the sense that we are not trying to come up with lots of new ways of doing things like incentivising people to diversify their counterparty exposures. Moreso we are benchmarking what is currently done and asking questions about it. Perhaps this is a question you could ask about it, but I do not think it felt particularly central to our objectives.
Moderator: Just on that, did you look at whether there is a sort of concentration at the point where all this reinsurance ends? In other words, if you start to look across the range of reinsurers, whether there is a point where lots of this reinsurance is ending up with single entities?
Mr Ugono: That’s a really good question. I think part of the challenge is that, because of some of the issues around confidentiality, we took the view that it might have been difficult to have gotten respondents to set out their main counterparties. We tried to do it more at the aggregate level by looking at jurisdiction. Where is the reinsurance landing? It is an issue that would be good or would have been good to have probed a little bit more. Because then it can help to crystallise our comments around the reinsurers and this point about concentrations. Being able to see the counterparties themselves is critical to being able to form a view on that.
Mr Funnell: I will just add that we obviously only have the insurer-to-reinsurer relationship described here. We have no information about retrocession or where that risk is, or if that risk is getting passed on again. That is just a limitation of the questions we can ask an insurer because they may not know the answer themselves either.
Moderator: Do you have any feeling as to whether that retrocession point might impact on the conclusions you came up with about where the reinsurance is ending up? And whether that retrocession might lead to some of the places where the EU is the primary reinsurer, meaning that risk ultimately ends up outside of Solvency II?
Mr Ugono: I do not necessarily think it would have any impact on the conclusion, but I do think it raises the question around how fragile the system is. What I actually suspect is that in the UK you have a lot of branches that belong to EU parents. I suspect a lot of the activity is actually being done between cedents and branches. In the report itself, we were quite clear that, where there is a transaction where the contractual entity is with a branch, the jurisdiction should be recorded with the parent. I suspect that is what is driving the EU point in terms of the risk going to the EU. But the problem is that the process has become very opaque and it is difficult to know who the weakest link is. You might have a particular reinsurer failing and you think you have no exposure. Suddenly, you realise that they were actually holding quite a lot of retroceded risk and suddenly you get that domino effect, which I think is part of the reason why there is some concern around this kind of offshoring of risk.
Moderator: Given that the working party’s approach of considering the movement in insolvency ratio, hence fundamentally making allowance for capital, did it also consider how the insurer would be exposed if it had not reinsured, as a comparator? There is a danger here that we are ignoring the protection provided from the reinsurer’s net assets in the very scenarios that the reinsurer has defaulted, to which the insurer would have been exposed had it not reinsured.
Mr Funnell: I think the short answer is probably no. Are we saying that, on a reinsurer default, there may be wider consequences for the value of the assets? I assume that is what we are driving at but, no, we did not consider that.
Moderator: What event could lead to the reinsurance being derecognised as risk mitigation for regulatory purposes?
Mr Ugono: I think there is one example around a decision from a judge that calls into question items where you thought the meaning was that you were covered as part of the contract but in fact you weren’t. I think a really good example of this actually is COVID and business interruption cover. That was more of an issue on the GI side, but we know that the FCA test case found that actually the insurance companies were on the hook for events that the insurance companies thought were not within the scope of the contract.
Moderator: Given the UK regulatory freedom post-Brexit, can you talk about the merits of situations where you might specify what the IMSCR is?
Mr Ugono: Fundamentally, formulae that apply across the industry feel more consistent with what you might find in a standard formula. By definition, an internal model is for firms to decide an approach that best meets their risk profile. I am sure you could also consider many other formulae.
Moderator: Are there specific amendments or at least strong steer you can give around how you might toughen the IMSCR measure? The internal model IMSCR in this area might be interesting to consider. I wonder whether you think that, actually, the current process where people end up with lots of diversification benefits around this might be valid; as opposed to explicitly doing something that might make it slightly more onerous to prove the IMSCR.
Mr Ugono: No, and I do think that there may be a question around whether or not I think 1% of the SCR, a figure that we calculated, is the appropriate amount of capital. Historically, it does feel as though much collateral is heavily relied upon as well as the PD factor within the modelling. Is this right, given the number of reinsurance players in the marketplace? I do think there is a question on this point, more broadly speaking. It is difficult for me to comment further, but I can certainly see the merits of looking at it a little bit more closely.
Moderator: Jamie, do you have any different perspectives on that?
Mr Funnell: No, I think it almost comes back to Mudi’s point about the probability of these events actually happening, how it generally is assumed to be so small, is down to modelling. I am not sure this would necessarily make a massive difference to the quantum of capital we are seeing held against reinsurance counterparty default in any case. Mudi said already that there may be some arguments for it, but I don’t think it’s necessarily going to have the material result change either way.
Moderator: Yes, just because the probabilities end up being so low that, even if you had a fully reinsured broker and you were bringing the whole SCR back on in that first part of the calculation, you would then be multiplying it by less than a fraction of 1%.
Moderator: Did you observe a difference in management actions assumed on the capture of asset intensive reinsurance and longevity reinsurance?
Mr Funnell: I think the answer is no, in the sense that we weren’t able to distinguish generally for the majority of the questions between asset and longevity reinsurance because we wanted to ask around 58 questions and not 116 questions. It was a necessary simplification, but I think it would be interesting to know. There would be some different answers across the two, but that is a limitation of our survey.
Moderator: I would just like to end by saying thank you very much to everyone attending and thank you very much to Jamie and Mudi for all of the hard work that has gone into preparing the presentation today and the accompanying report.