


Background
Shigella are Gram-negative enterobacteria that are important etiological agents of diarrhoea and dysentery. Shigellosis is endemic worldwide and is hyperendemic in developing countries. The Shigella genus includes four major species: S. dysenteriae, S. flexneri, S. boydii and S. sonnei (groups A, B, C and D, respectively). It may also appear as epidemics causing morbidity and mortality in both developed and developing countries, studies show that the species S. dysenteriae, S. flexneri, S. boydii are common in developing countries while S. sonnei is common in developed countries, including Israel [Reference Yang1, 2]
Shigellosis is highly contagious. Transmission occurs via the fecal–oral route, usually by intake of contaminated food or water, or by personal contact [Reference Ansaruzzaman3]. Severe cases of Shigellosis may require hospitalisation and may result in death.
The World Health Organization (WHO) estimates that Shigellosis causes more than 165 million cases of bloody diarrhoea and one million deaths each year worldwide. The majority of Shigellosis cases (~70%) and of deaths (~60%), occur among children <5 years old [4]. In 2013, the average annual incidence of shigellosis in the USA was 4.82 cases per 100 000 individuals [Reference Iwamoto5]. Hospitalisation due to Shigellosis is in cases of severe symptoms, a prolonged illness or in case of patients with increased risk of death [4].
Despite the improved standard of living in Israel, Israel has remained highly endemic for shigellosis, with incidence rates that are about 20 times higher than the USA. Since 1969, there has been an increase in the incidence of Shigellosis, mostly due to an increase in S. sonnei infections, while the infection rates caused by S. flexneri remained relatively constant. Earlier research indicates that two populations in Israel are at increased risk of developing shigellosis: children aged 0–4 years and soldiers serving in field units [Reference Block6]. A previous work based on sentinel, laboratory-based surveillance for the period of 1998–2012 showed that the culture-proven average annual incidence of shigellosis was 97 per 100 000. However, there are profound gaps in surveillance steps, and therefore the actual Shigella morbidity in 1998–2012 was estimated to 2425 per 100 000 (per year) [Reference Bassal7]. Several studies have used statistical and machine learning algorithms to better understand factors associated with diarrhoea [8, Reference Strina9], to develop dose–response models [Reference Smith10], or to identify immune correlates of protection [Reference Arevalillo11]. However, we are not aware of tools or previous research to determine the Shigella species in a given patient, nor his/her risk of hospitalisation.
The population in Israel is particularly diverse and is composed of a variety of ethnic groups. This study focuses on the four major groups: Jews (comprising approximately 75% of the population), Muslims (17.7%), Christians (0.2%) and Druze (0.16%) [12, 13]. In this study, we use national notifiable disease reporting data for the years 2002–2015 and focus on the incidence of different Shigella species among the various ethnic groups in Israel. We trained machine learning tools based on the demographic and clinical data, and built models for predicting infections by Shigella species. We further developed models predicting whether the patient would or would not be hospitalised due to the disease.
Methods
Data collection
Shigellosis is a notifiable disease in Israel. Physicians and laboratories diagnosing Shigella are required by law to report them to the Ministry of Health (MoH). We used national Shigella data as collated by the MoH Division of Epidemiology for the years 2002–2015. Denominators for rates were based on the mid-year population of Israel, as supplied by the Central Bureau of Statistics [14]. Of note, the available Shigellosis data collected by the MoH is limited and does not include relevant components such as the comorbidities, nutrition, socioeconomic status, food consumption or other epidemiological components (Fig. 1).
Data processing
For each case we obtained individual information on age, gender, ethnic group, health district of residence, and year and month of disease onset. Only Israeli citizens were included in analysis. The four major Shigella species (S. sonnei, S. flexneri, S. boydii and S. dysenteriae) were included in analysis.
Due to relatively small numbers of Shigella cases in two sub-districts, for the machine learning analysis only, the Afula sub-district and the Nazareth sub-district – which are in close proximity and share a district border – were merged and referred to as a single entity.
Statistical analysis
Statistical analysis was performed using MATLAB (MathWorks, Natick, MA, USA, Version R2016a). We used χ 2 tests to compare hospitalisation rates or Shigellosis species rates between different categories (such as ethnicity or age groups).
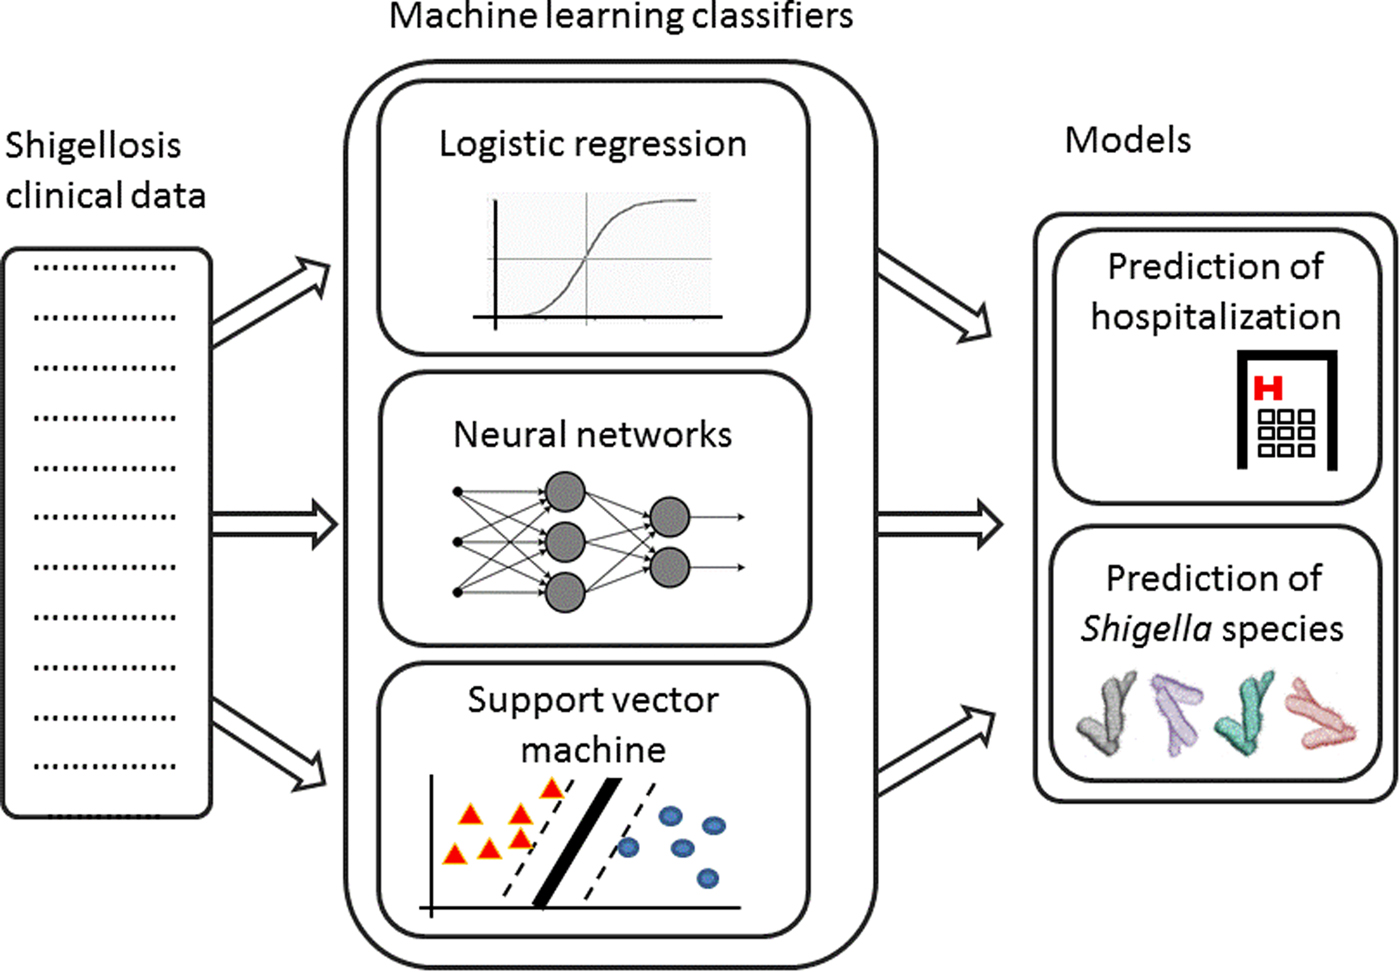
Fig. 1. Analysis pipeline – Shigellosis clinical data are collected. Machine learning classifiers are trained on this data to create two models: prediction of hospitalisation and prediction of Shigella species.
Machine learning algorithms
Machine learning algorithms were performed using MATLAB's Machine Learning Toolbox. We used three algorithms: Logistic Regression (LR), Neural Network (NN), and Support Vector Machines (SVM), in order to build a model predicting whether a patient will be hospitalised or not and a model predicting the Shigella species. All models were based on six predictive variables (features): the patient's age, ethnicity, sex, residence (sub-district), the disease onset month and the disease onset year.
Logistic Regression
LR models reflect the relationship between a multi-class series of features (such as demographic and clinical features) and categorical output variables (such as the disease outcome) and are used to classify new samples to two or more categorical classifications. LR modelling was used to assess the relative contribution of each of the features to the classification (i.e. which feature is more important to the prediction), using the classification coefficient matrix (a matrix with the relative weights for each feature).
NN classifiers
NNs are statistical models with a unique mathematical structure that simulates the learning dynamics of the neural cells in the brain [Reference Harrison and Kennedy15]. NNs are based on a hierarchical node structure that receives multiple inputs, assigns each input a weight and outputs a decision based on the summation of these weighted data. NN is usually composed of at least three layers: the input layer receives the input data, the hidden layers synthesise this data, and the output layer receives the hidden layers input and generates a decision to the research question. In order to find the optimal number of the network's nodes, we ran the algorithm on the test set using five to 40 nodes (10 times for each number of nodes) and chose the number of nodes that maximised the performance. Due to the stochastic nature of the model, we ran the algorithms 100 times and calculated the average performances.
Support Vector Machine
The SVM algorithm is a classification algorithm. Given a set of tagged training samples (each sample is assigned to a specific class), the algorithm finds a hyperplane that separates the sample space into different classes [Reference Noble16]. This hyperplane can be used to predict the class of an unseen sample. Special functions (called Kernels) can be used for SVM classification in order to achieve non-linear classifications (radial, polynomial, etc). We used four different Kernel functions (linear, Gaussian, polynomial and radial).
Using machine learning tools to predict Shigellosis species
LR, NN and SVM algorithms were applied to classify every case into one of the four major Shigellosis species (S. sonnei, S. flexneri, S. boydii and S. dysenteriae. For the NN algorithm, we used ‘Pattern Recognition Neural Network’ with two layers and 16 nodes and ‘Scaled conjugate gradient backpropagation’ as the training function.
Using machine learning tools to predict hospitalisation due to Shigella
LR, NN and SVM algorithms were used to classify whether a given patient with Shigella will be hospitalised. For the NN algorithm, we used ‘Pattern Recognition Neural Network’ with two layers and 19 nodes, and ‘Scaled conjugate gradient backpropagation’ as the training function.
Model evaluation
Data were randomly split into a training set (70% of the data) and a test set (30%), for calculating the algorithms’ accuracy. Same training and test sets were used for all algorithms. For the hospitalisation prediction (which is binary), we also calculated additional performance metrics: accuracy ((True positive + True negative)/All population), error rate (1-accuracy), precision (True positive/(True positive + False positive)), recall (True positive/(True positive + False negative)) and F1 score ((2*Precision*Recall)/(Precision + Recall)).
Results
The initial data included 67 256 entries (Shigellosis patients). Including only Israeli citizens reduced the data to 98.6% of the original data (n = 66 314). About one-third of the entries lacked the Shigella species and there were also entries of extremely rare Shigella species. Including only samples of one of the four major Shigella species reduced the data to 43 972 entries. Two patients died due to Shigellosis, a 75 years old patient with S. sonnei and a 41 years old patient with unknown Shigella species.
Shigellosis characteristic, incidence and trends in Israel in 2002–2015
There are significant differences in the rates of each of the four Shigella species in the initial database: 38 774 (88.2%) of the cases were S. sonnei, 3506 (8%) were S. flexneri and only 608 (1.4%) and 1084 (2.5%) were S. boydii and S. dysenteriae, respectively. There are also significant differences in the hospitalisation rates for each of the different species: 11.6% of the S. flexneri cases were hospitalised, 8% of the S. boydii, 5.7% of the S. sonnei and only 3.2% of the S. dysenteriae were hospitalised.
We found that Shigellosis rates in children and infants were higher than in other age groups: 63.5% of the reported cases in Israel in 2000–2015 occurred in children under 5 years of age (comprises about 10% of the Israeli population), followed by the 5–15-year-old age group (22.3% of Shigellosis). There was a decrease in the morbidity in the 15–20-year-old group (1.3%) and an increase again at ages 20–30 (4.6%) (Fig. 2a). Similar morbidity rates were found among males and females (Supplementary Fig. S1). However, hospitalisation data shows a different trend: hospitalisation rates increased among the elderly (>65 years old): on average, 5.5% of the reported Shigellosis cases were hospitalised, 13.2% of reported Shigellosis cases among the elderly were hospitalised, while only 4.5% of the children under the age of 5 years were hospitalised (Fig. 2b). The incidence rates of shigellosis in the Israeli population followed a cyclic pattern between 2002 and 2015, ranging between 18 and 120 cases per 100 000 (Fig. 2c). Of note, sub-districts which showed high incidence rates followed this cyclic pattern, while sub-districts with Shigella rates below 50 per 100 000 did not (data not presented).
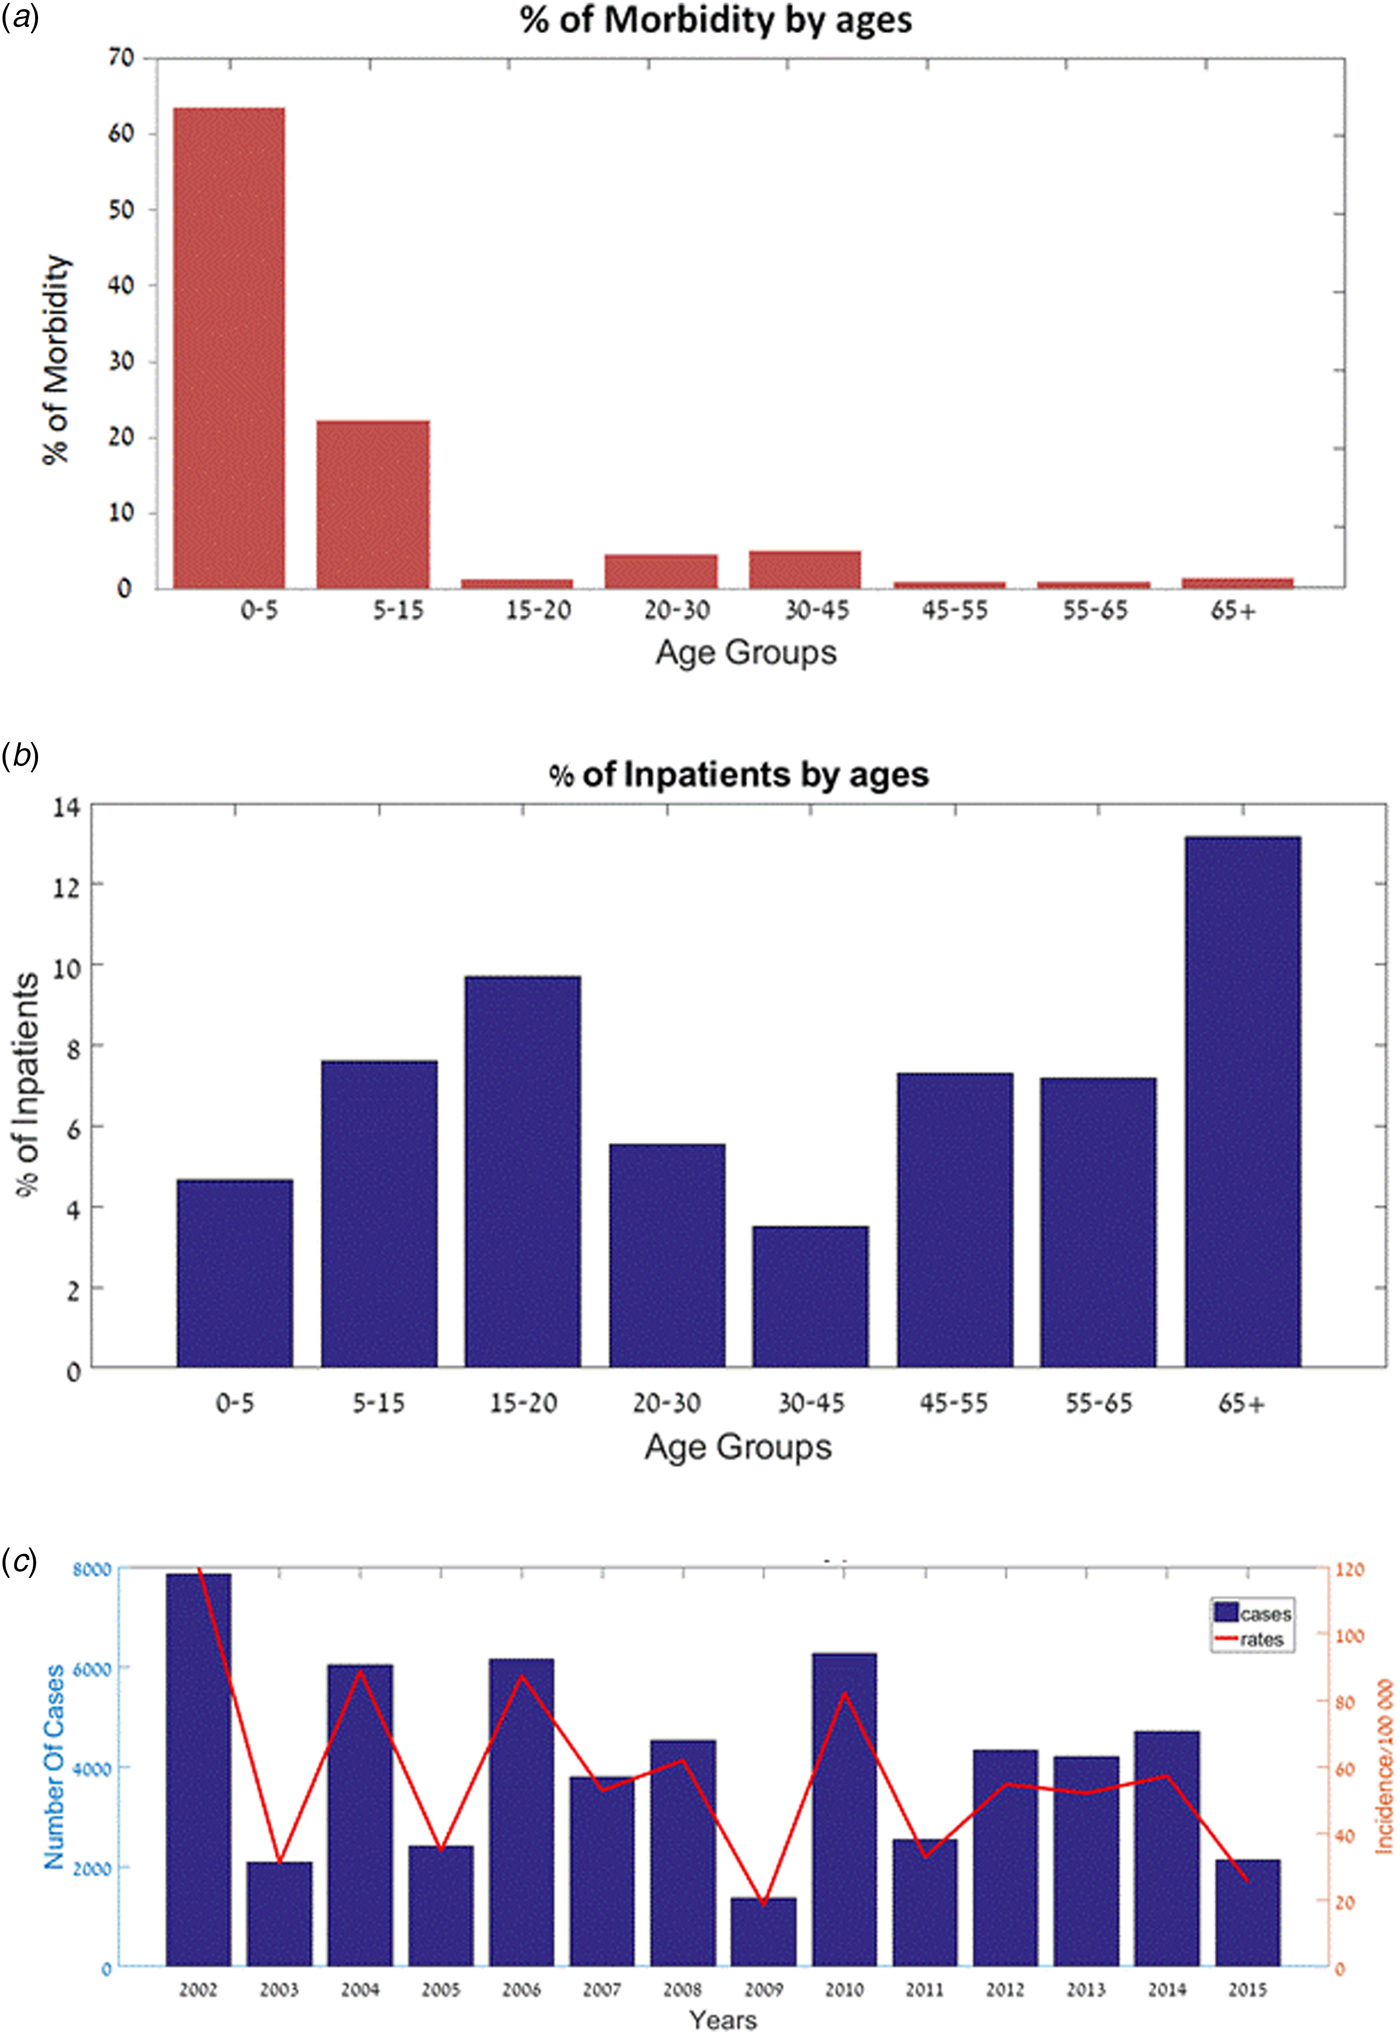
Fig. 2. Shigellosis morbidity and hospitalisation in Israel – 2002–2015. (a) Percentage of patients (out of all Shigella cases) by age groups. (b) Percentage of hospitalised patients (out of all Shigella cases) by age groups. (c) Number of cases and incidence rates of Shigellosis (2002–2015).
Analysis of the species incidence in Israel in 2002–2015 showed that the most abundant Shigella species is S. sonnei (88%), while the others were much rarer: S. flexneri (8%), S. boydii (1%) and S. dysenteriae (2%). We analysed the Shigella cases according to the four ethnic groups in Israel: Jews, Muslims, Druze and Christians. 90.1% of the reported cases are from the Jewish population, while reports from the Muslim, Christian and Druze populations are 8.3, 0.13, 0.08%, respectively. The reported Shigella rates in the Jewish population, relative to their proportion in the general population was significantly high, in comparison to other populations: the ratio of Shigella rates within a population, divided by the population percentage in the general population, was much higher for Jews (1.26) in comparison with Christians (0.65), Muslims (0.48) and Druze (0.5).
Among the Jewish population, 88% of the Shigella cases were identified as S. sonnei, while 8, 3 and 1% were identified as S. flexneri, S. dysenteriae and S. boydii, respectively. Similar rates were reported in the Druze population (89, 7, 4% of S. sonnei, S. flexneri and S. boydii, respectively) and in the Christian population (80, 13, 4, 2% of S. sonnei, S. flexneri, S. boydii and S. dysenteriae, respectively). By contrast, S. flexneri and S. boydii rates in the Muslim population were much higher (44 and 9%, respectively) (Fig. 3). These results are statistically significant (P < 0.005).
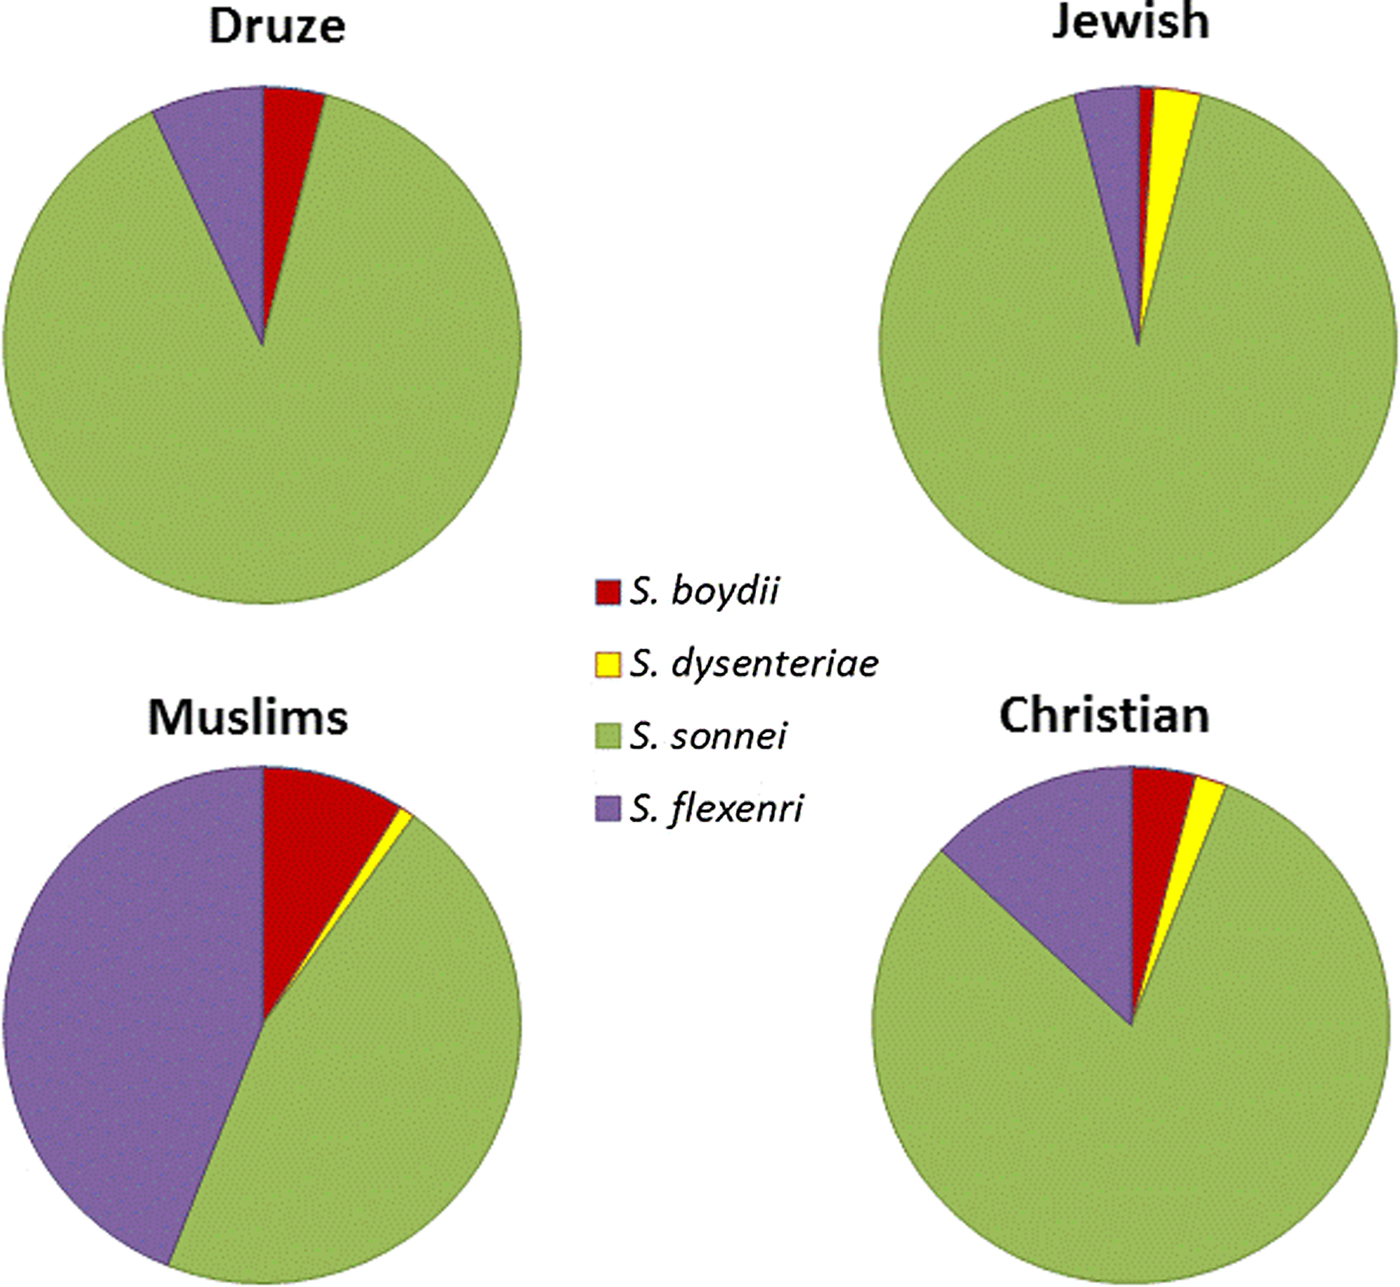
Fig. 3. Distribution of Shigella species in Israel, 2002–2015 in the four major ethnic groups in Israel.
Summing the total number of Shigellosis cases per month (in the years 2002–2015) shows that the incidence of Shigellosis is relatively low in the winter months, rising to peaks in spring and again in summer (Fig. 4).

Fig. 4. Total cases of Shigellosis morbidity sorted by month (2002–2015).
Using machine learning tools to predict Shigella species
There is a significant imbalance in Shigella species cases in Israel, in which over 96% of the cases were S. sonnei and S. flexneri and <4% of the cases were S. boydii and S. dysenteriae. Therefore, we decided to exclude the rare species from the species analysis and concentrate on the more abundant species (S. sonnei and S. flexneri). The three algorithms yielded similar performances in the species prediction; the NN performance was slightly better than the other algorithms, with an accuracy rate of 93.2% (Table 1).
Table 1. Performance of machine learning algorithms to predict the Shigella species and hospitalisation due to Shigellosis: average % of the test sets
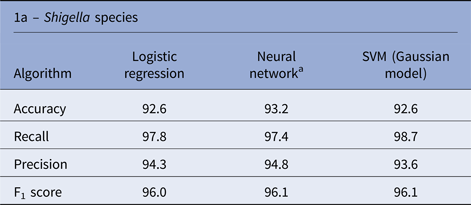
a Average performances (over 100 runs).
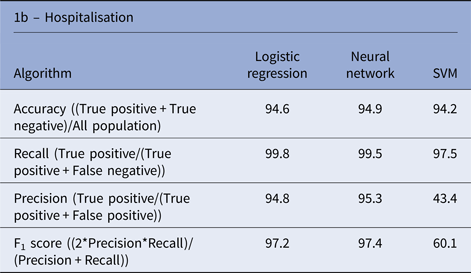
Using machine learning tools to predict hospitalisation due to Shigellosis
Similar performances were achieved by the three algorithms; the NN algorithm yielded slightly better performance with an accuracy rate of 94.9% (Table 1). Analysis of the LR classification coefficient matrix revealed that month of onset was the best predictor of hospitalisation. Cases in August, September and October were the most prone to be hospitalised (P < 0.001, see also Supplementary Fig. S2). An additional feature that was found to contribute to the classification was the patient's ethnicity: members of the Druze community are more likely to be hospitalised, followed by Christians, Muslims and Jews (P < 0.001). Patient's age was an additional contributing factor. Older age was associated with a higher risk of hospitalisation (P < 0.001). Following these findings, we compared the hospitalisation incidence of Jews and Muslims in the different age groups. The results, shown in Figure 5, were statistically significant (P = 0.008).
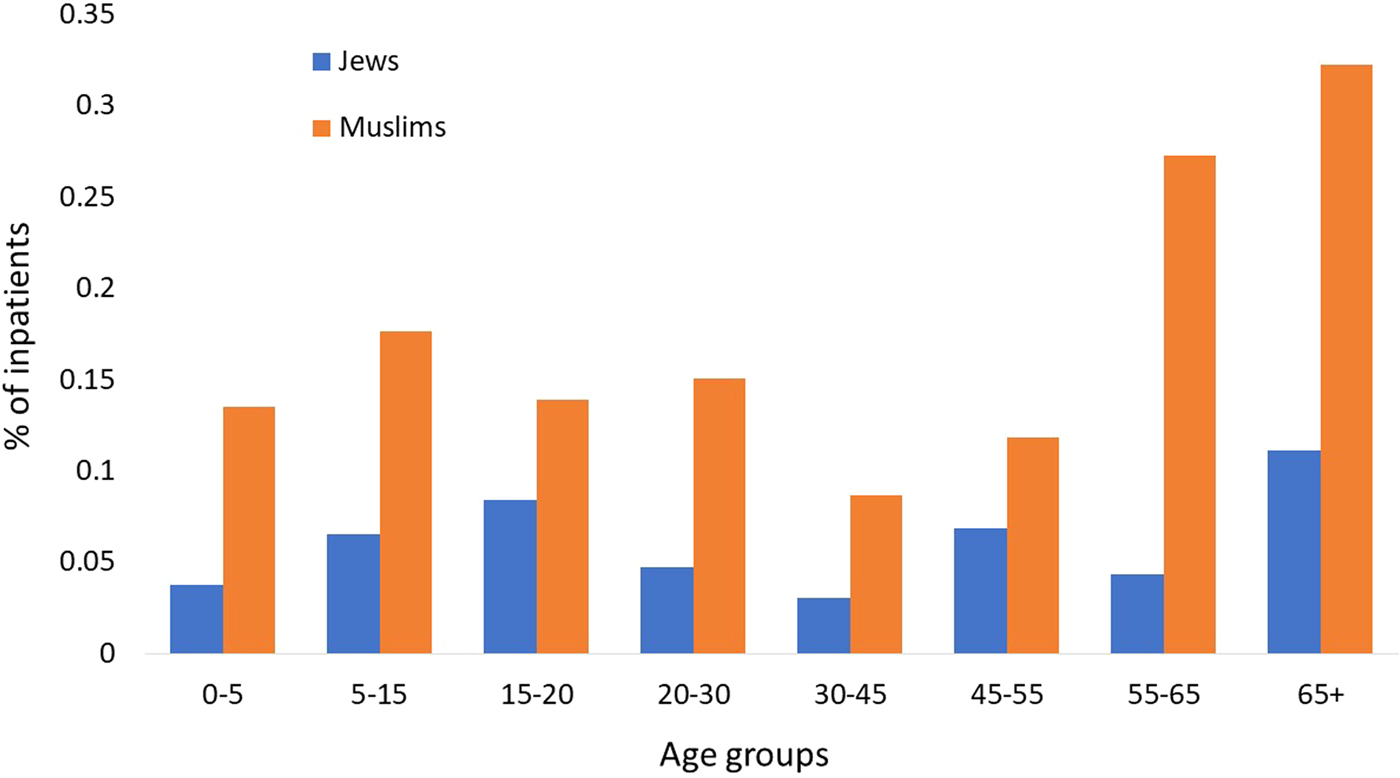
Fig. 5. Percentage of Jewish and Muslim hospitalised patients by age groups (2002–2015).
Discussion and conclusions
Shigella causes morbidity and mortality worldwide, mostly affecting infants and young children. We focused on the years 2002–2015 and showed that the S. sonnei in the most prominent species in Israel, albeit with ethnic variability, with statistically significantly higher rates of S. flexenri among Muslims, in comparison with Jews, Druze and Christians. This observation has been found in other developed countries [Reference Polyak17]. These profound differences between the different species incidence were also found in previous works [Reference Bassal7]. This pattern may be related to lower socioeconomic status and poorer environmental infrastructures of many Muslim communities in Israel [Reference Bassal7].
The higher proportion of reported Shigella cases within the Jewish population, in comparison with the other populations, may stem from the higher awareness, and also from the higher availability of health care providers for this population. The higher awareness and the higher accessibility for health care among the Jewish population may also explain our findings regarding the significant contribution of the ethnicity feature as a predictor for hospitalisation, according to which, Jews are less likely to be hospitalised (comparing with other populations). Furthermore, many mild cases in the Muslim population may not be reported to the MoH, with reporting of only the more severe cases. Of note, this information may not fully representative because many cases of Shigellosis in Israel are not reported.
Shigella morbidity is much higher among infants and young children in comparison with their rates in the population. However, we find higher rates of hospitalisation among elderly people. This could be due to the higher vulnerability of the elderly which leads physicians to be more careful and prefer to hospitalise Shigellosis sick elderly, rather than just monitoring their health.
The cyclic pattern of Shigellosis, ranging between 18 and 120 cases per 100 000 (between 2002 and 2015) is in accord with data generated by the sentinel surveillance system in Israel [18]. The low incidence of Shigellosis in the winter and the increased morbidity trend until July is also in accord with the previous results collected by the sentinel surveillance system [Reference Bassal7]. A major reason for hospitalisation due to Shigellosis is the concern of dehydration and the need for fluids. This is consistent with the higher incidence of hospitalisation in August and September, which are hot and dry months in Israel. Of note, unlike the previous study of Shigellosis in Israel, based on sentinel laboratory-based surveillance network, here we used national notifiable disease reporting data, as nearly as possible representing the dimensions of Shigella morbidity and mortality in Israel.
In this paper, we used machine learning algorithms to predict the Shigella species and whether a patient with Shigellosis is likely to be hospitalised. Current clinical and epidemiological approaches enable species identification within days up to one week. Three popular classification algorithms (LR, NN and SVM) predicted Shigealla species with high accuracy within seconds. The findings were corroborated by several different machine learning algorithms that reached similar performances, strengthening the reliability and robustness of the predictions. These computational tools may help the physician in making informed decisions regarding the patient's hospitalisation in real time, based on a broad dataset, in contrast to current practice of decision making based on intuition and limited information. Patients at higher risk of hospitalisation could be treated aggressively early on. Ostensibly, there is no clinical significance for predicting the Shigella species, since today the medical treatment is the same as for various species of Shigella. However, according to our findings, the hospitalisation rate of S. flexneri patients is much higher than the hospitalisation rates of patients of other species, implying that predicting the species will assist the physicians in making better decisions. In addition, it is possible that in the future various treatments will be developed for different types of Shigella. Further, Identification of species or subspecies may have implications for epidemiological investigation and disease prevention.
The models presented in this work enable focusing on vulnerable populations that are more prone to hospitalisation or to specific Shigella species infections, in specific months. This information may be helpful for policy makers to focus their efforts on these populations in specific seasons, for example: focused campaigns for raising awareness during the summer months, investments in education of vulnerable populations, focused financial investments in hygiene improvements, etc.
There are several advantages to using computational models in addition to classic epidemiological approaches. These models can identify complex, non-linear associations that cannot easily be detected by other approaches. Consequently, the performance of these algorithms is better and more precise. The algorithms presented in this work are dynamic and can be easily updated to include new data, without the need for comprehensive recoding.
While the research is based on Israeli data and its outcomes are relevant to the Israeli population, the approach and tools in this study can easily be adapted to the study of Shigellosis and its clinical outcomes in other countries, where the population composition, healthcare systems and climate may be very different.
Supplementary material
The supplementary material for this article can be found at https://doi.org/10.1017/S0950268818001498
Acknowledgements
We thank Dr Analia Ezernitchi from the Government Central Laboratories, Ministry of Health, Jerusalem Israel. We also thank Dr Tommy Kaplan for his insightful comments.
Financial support
This research received no specific grant from any funding agency, commercial or not-for-profit sectors.
Conflict of interests
None.


