


Media summary: Fertility decisions of Armenian, Georgian and Azeri parents living in Soviet-era Russia reveal strong son bias.
I. Introduction
A seemingly innocuous hypothesis is that social learning and cultural transmission can produce and maintain variation between groups in ongoing contact with each other (Boyd & Richerson, Reference Boyd and Richerson1985; Soltis et al., Reference Soltis, Boyd and Richerson1995; Richerson & Boyd, Reference Richerson and Boyd2008; Henrich, Reference Henrich2017; Laland, Reference Laland2017). The hypothesis seems innocuous if understood to mean simply that cultures should vary. In reality, however, the idea is not necessarily innocuous. If cultures vary specifically because of cultural evolutionary processes, genes and culture can combine to generate evolutionary dynamics that would not otherwise be possible. Of particular interest, cultural group selection becomes a possibility (Boyd et al., Reference Boyd, Richerson and Henrich2011; Richerson et al., Reference Richerson, Baldini, Bell, Demps, Frost, Hillis and Zefferman2016; Francois et al., Reference Francois, Fujiwara and Van Ypersele2018; Henrich & Muthukrishna, Reference Henrich and Muthukrishna2021).
For present purposes, by cultural group selection we mean that two or more groups exhibit systematically different, socially learned behaviours that lead to systematic, group-level variation in fitness values for the individuals who comprise the groups. Here we do not demonstrate or even test for cultural group selection of this sort. Indeed, our analyses highlight just how challenging such an exercise would be, especially in terms of drawing sound inferences about the causal role of culture. We do, however, take a step in the direction of testing for this kind of cultural group selection in two ways. First, we do not simply assume that observed differences in behaviour between groups constitute cultural variation just because it seems like they probably should be cultural variation. Rather, we work with data that attenuate, even if they cannot eliminate, the role of confounding sources of variation. Second, we do not examine behavioural variation in decision-making domains that have a vague relationship to fitness. Rather, we examine family planning, specifically sex-biased fertility choices, and in this sense we focus on a domain that should have a relatively direct link to realised fitness values.
A necessary but not sufficient condition for cultural group selection is that groups are different from each other specifically because of cultural evolutionary processes. This is easy to say but hard to pin down in terms of what it might actually mean for the working empiricist (Lonati et al., Reference Lonati, Lalive and Efferson2024). Groups can be different for all sorts of reasons. Isolating the cultural component can be challenging because cultural variation often correlates strongly with other forms of group-level variation. For example, if the people in one country behave differently from the people in another country (Hofstede, Reference Hofstede2001; Henrich et al., Reference Henrich, Boyd, Bowles, Camerer, Fehr, Gintis and Tracer2005; Bell et al., Reference Bell, Richerson and McElreath2009; Muthukrishna et al., Reference Muthukrishna, Bell, Henrich, Curtin, Gedranovich, McInerney and Thue2020), some or all of this group-level variation may be cultural, but some or all of it may simply reflect facultative responses to environmental variation (Lamba & Mace, Reference Lamba and Mace2011).
One straightforward work-around is what is sometimes called the ‘epidemiological’ approach to identifying cultural variation (Fernández, Reference Fernández2011; Lonati et al., Reference Lonati, Lalive and Efferson2024). The basic idea is to compare people who have different cultural backgrounds but live in one place under a common set of institutions and economic conditions. By holding the institutional and economic setting constant, one hopes to eliminate or at least attenuate the effects of environmental variation as a confound, and recent research provides a number of examples in different decision-making domains (Antecol, Reference Antecol2000; Fernandez, Reference Fernandez2007; Fernández & Fogli, 2009; Alesina & Giuliano, Reference Alesina and Giuliano2010; Luttmer & Singhal, Reference Luttmer and Singhal2011; Enke, Reference Enke2019; Almond et al., Reference Almond, Edlund and Milligan2013; Galor & Özak, Reference Galor and Ö zak2016; Lowes et al., Reference Lowes, Nunn, Robinson and Weigel2017; Giuliano & Nunn, Reference Giuliano and Nunn2021).
Of course, some domains are more interesting than others in evolutionary terms. To illustrate, imagine a study showing that children born in London to Spanish parents sometimes say ‘la calle’ but almost never ‘die Straße’, while children born in London to German parents sometimes say ‘die Straße’ but almost never ‘la calle’. Such a study would provide a clear example of the epidemiological approach, and it might easily convince us that the observed group-level variation is cultural. However, assuming that la calle and die Straße work equally well when speaking to Spanish speakers and German speakers, respectively, and assuming that they work equally poorly when speaking to others, we might also assume the observed variation is selectively neutral in gene–culture coevolutionary terms. In particular, it would not and could not feed back to affect survival and reproduction, the basic components of individual fitness.
Cultural variation in reproductive choices is at the opposite end of the spectrum, and this is our starting point in the present paper. We use census data to examine possible cultural variation in choices related to fertility, family planning and parental investment. Specifically, we use archival data from the final Soviet census of 1989 to study son bias or daughter bias among different ethnic groups within the Soviet Union. To attenuate environmental confounds, we limit attention to people who were all living in Soviet-era Russia and thus shared a common economic and institutional setting. This allows us to identify cultural differences in son bias across ethnic groups living in Russia, foreshadowing the differential evolution of sex ratios in their ethnic homelands. Thanks to the pioneering work of Guilmoto (Reference Guilmoto2013), Guilmoto and Duthé (Reference Guilmoto and Duthé2013) and Duthé et al. (Reference Duthé, Meslé, Vallin, Badurashvili and Kuyumjyan2012), we know that, shortly after the dissolution of the Soviet Union, sex ratios at birth (the number of boys born for every 100 girls) started to rise in some successor states due to sex-selective abortion. The increase was strongest in Armenia and its neighbouring countries in the Caucasus, and Armenia now has one of the most distorted sex ratios in the world (Schief et al., Reference Schief, Vogt and Efferson2021). Such distortions suggest the possibility that some families may not be optimising investment in sons vs. daughters (Fisher, Reference Fisher1999). In other parts of the former Soviet Union, with the Baltics a clear example, the sex ratios at birth remain undistorted (United Nations, Department of Economic and Social Affairs, Population Division, 2022).
What explains the observed rise in the sex ratio at birth in the Caucasus following the end of the Soviet Union? An intriguing possibility is that heightened sex ratios in the contemporary Caucasus reflect a deeply rooted cultural preference for sons that was already in place before families started selectively aborting females. To investigate this possibility we need to go further back to Soviet-era Russia and look for alternative signatures of a culturally evolved son bias. One candidate signature, especially appropriate for census data, is differential stopping rules. A differential stopping rule would mean, for example, that parents with two daughters and no sons are more likely to continue having children than parents with two children, at least one of which is a son. A culturally evolved son bias that manifests itself in this way is intriguing because it has the potential, like sex-selective abortion, to impose a fitness cost. In particular, stopping rules imply that some families may not optimise the quantity–quality tradeoff, a classic topic in behavioural ecology (Lack et al., Reference Lack1954; Stearns, Reference Stearns1992; Roff, Reference Roff1993; Mulder, Reference Mulder2000; Walker et al., Reference Walker, Gurven, Burger and Hamilton2008; Lawson & Mace, Reference Lawson and Mace2011; Lawson & Borgerhoff Mulder, Reference Lawson and Borgerhoff Mulder2016), specifically because of their son-biased culture.
An alternative hypothesis is that the rise in sex ratios was driven by the emergence of son bias, a recent cultural shift that for some reason occurred in the Caucasus, but not elsewhere. Contemporary sex-selective abortion may still be dysfunctional, but the son-biased culture in question would not be deep-rooted and would have evolved under different circumstances. Finally, perhaps the people of the Caucasus did not have and do not have a culturally evolved preference for sons at all. Instead, rapidly changing economic and institutional conditions in the early 1990s may have simply created new incentives favouring sons in the Caucasus but not, for example, in the Baltics. Sex allocation is another classic topic in behavioural ecology, and in general we are quite happy to think about differential investment in male vs. female offspring without recourse to the cultural evolution of preferences for one sex over another (Fisher, Reference Fisher1999; Trivers & Willard, Reference Trivers and Willard1973; Leimar, Reference Leimar1996; Schindler et al., Reference Schindler, Gaillard, Grüning, Neuhaus, Traill, Tuljapurkar and Coulson2015). In such cases, differential investment simply reflects a facultative response to incentives, which we conceive broadly to include any currency that might affect fitness in a sexually reproducing species.
Our data do not allow us to study fitness directly. They do, however, allow an epidemiological approach to differential stopping rules before the emergence of distorted sex ratios and by extension an examination of son bias in the Caucasus more broadly. Our results suggest that son bias in the Caucasus, along with whatever distortions and fitness effects it may or may not involve, is probably based on a deep-rooted preference for sons that exists specifically because of cultural evolutionary processes.
2. Background
Identifying a culture of son bias can be challenging because such a culture does not always translate into a male-biased sex ratio, and a male-biased sex ratio does not necessarily require a culture of son bias. If skewed sex ratios at birth follow from a culture of son bias, at least three conditions must hold (Lesthaeghe & Vanderhoeft, Reference Lesthaeghe and Vanderhoeft2001; Guilmoto, Reference Guilmoto2009). First, parents must harbour culturally evolved son-biased fertility preferences. Second, fertility rates must be low so that parents face a significant risk of ending up without a son unless they actively engage in sex selection. Third, parents must possess both the means and willingness to undertake sex selection. In particular, pre-natal sex selection, which is the primary issue in the Caucasus, requires access to obstetric sonography and some acceptance of abortion as a method of family planning (Schief et al., Reference Schief, Vogt and Efferson2021).
Before the 1990s, obstetric sonography was not widely available in the Caucasus. Thus, even if a strong culture of son bias was in place, it could not have affected population-level sex ratios at birth, and indeed sex ratios in Armenia, Georgia and Azerbaijan remained at their natural levels in Soviet times. Therefore, we cannot compare historically undistorted sex ratios with contemporary sex ratios and conclude that the change reveals a cultural shift toward son-biased fertility preferences.
Regarding the availability of medical ultrasound, Duthé et al. (Reference Duthé, Meslé, Vallin, Badurashvili and Kuyumjyan2012) report that ultrasound technology began to appear in the Caucasus in the late 1980s and was fully introduced in most hospitals by the mid 1990s. Hohmann et al. (Reference Hohmann, Lefèvre and Garenne2014) also report that sex-screening methods quickly became available following the dissolution of the Soviet Union. Michael et al. (Reference Michael, King, Guo, McKee, Richardson and Stuckler2013) explains the limited availability of ultrasound machines in the Soviet period as a lack of domestic manufacturing capacity coupled with Western restrictions on exporting technology with military applications.
Without sex selection, son-biased parents can increase the probability of having a son by using differential stopping rules. Put simply, if you have a son, and you are content with the number of children you have, stop having children. If you do not have a son, keep having children, and do so even if you would otherwise stop. While such a strategy does not affect the sex ratio in the population, it does alter the distribution over family compositions. For example, families with only daughters appear less often than expected, and families in which the final child is a son appear more often than expected. We can thus analyse historical fertility outcomes to document son preferences even when sex ratios provide no insights.
Our strategy for inferring son preferences requires data on within-household fertility outcomes as aggregate sex ratios are largely unaffected by stopping rule behaviour. To be precise, fertility stopping can increase the aggregate sex ratio at birth only if parents with a natural tendency to conceive sons have more children than parents with a tendency to conceive daughters. Interestingly, continuing to have children until a son is born means that parents with a natural propensity of conceiving sons would have fewer children on average, thereby depressing rather than increasing the sex ratio at birth in the population. In reality, heterogeneity in the natural propensity to conceive offspring of a particular sex is too limited to imply a significant effect for the aggregate sex ratio (Grech et al., Reference Grech, James and Lauri2018).
What about the possibility that a biased sex ratio does not necessarily reflect a culture favouring one sex over the other? Variation in the human sex ratio at birth can also exist without explicit preferences and conscious sex selection by parents. For example, a significant and growing body of evidence links maternal stress to the death of male fetuses, which affects the sex ratio at birth in the wake of wars and other forms of social upheaval (James & Grech, Reference James and Grech2017). More broadly, the general theory of sex allocation, of course, does not require culture. Whether considering the equilibrium sex ratio in the population (Fisher, Reference Fisher1999) or facultative changes in parental investment based on parental condition and the relative reproductive values of male vs. female offspring (Trivers & Willard, Reference Trivers and Willard1973; Leimar, Reference Leimar1996; Cronk, Reference Cronk2007; Schindler et al., Reference Schindler, Gaillard, Grüning, Neuhaus, Traill, Tuljapurkar and Coulson2015), the basic evolutionary theory holds without culture. Especially telling, the explicit values in a cultural group can favour one sex, while investments in terms of actual behaviour favour the other sex, with the latter consistent with standard predictions under the Trivers–Willard hypothesis (Cronk, Reference Cronk2017).
For this paper, we have compiled and analysed a new dataset that allows us to grapple with the potentially complex and subtle relationship between a culture of son bias and a son-biased sex ratio. Specifically, we have compiled archival data from the 1989 census of households living in the Russian Soviet Federative Socialist Republic. The data allow us to compare the fertility outcomes of parents from different cultural origins who lived in Soviet-era Russia and bore children during the late 1970s and the 1980s, a period predating the distortion of sex ratios in the Caucasus. By comparing Armenians, Georgians and Azeris with people from other ethnic groups, we aim to discern whether modern-day disparities in sex ratios at birth across post-Soviet societies mirror a recent divergence in son bias, or whether they reflect longstanding cultural differences that were present before the Soviet collapse. Our data provide a way into this problem because we can combine both the epidemiological approach and the ability to identify differential stopping rules. The epidemiological approach increases confidence that we can isolate cultural variation, while the ability to identify stopping rules is crucial because we know that any son bias during the Soviet era did not take the form of sex-selective abortion.
Aside from general questions in gene–culture coevolutionary theory, our paper also contributes to the literature on son preference in the Caucasus (Duthé et al., Reference Duthé, Meslé, Vallin, Badurashvili and Kuyumjyan2012; Guilmoto, Reference Guilmoto2013; Meslé et al., Reference Meslé, Vallin and Badurashvili2007; Michael et al., Reference Michael, King, Guo, McKee, Richardson and Stuckler2013; Schief et al., Reference Schief, Vogt and Efferson2021). Previous research has documented distorted sex ratios, discussed the role of sex-selective abortions and measured son preferences using questionnaire items or implicit association tests. All the papers in this literature point to the increased availability of medical ultrasound as an important part of any explanation of the increase in the sex ratio during the 1990s.
The same literature, however, also raises the possibility that cultural evolution may have been unfolding quickly at the time. For example, concurrent developments like the decline of female political representation, deteriorating labour market conditions and an increase in violent conflicts may have caused an unprecedented preference for sons in the newly independent states of the Caucasus. Simply noting that sex ratios at birth started to increase dramatically in 1990s does not help to separate the possible mechanisms. As explained above, this is a general problem associated with identifying cultural variation either through time or across space. Culture often covaries with other forms of variation among groups, and this confounded variation limits the scope for isolating cultural variation in preferences, beliefs and behaviours.
We examine a culture of son preference by limiting our comparisons to different ethnic groups all living in Russia prior to the widespread availability of medical ultrasound. Thus, from a methodological perspective, our paper also adds to a growing literature that attempts to identify the causal role of culture by observing the behaviour of migrants who have different origins but live under a single set of institutions in a common host country (Fernández, Reference Fernández2011). In doing so, we provide evidence for a culture of son preference among Armenian, Georgian and Azeri parents that predates both the expanded availability of medical ultrasound as well as the political and cultural developments associated with the dissolution of the Soviet Union.
Importantly, our focus is on the kind of son bias that causes extreme distortions of the sex ratio, the kinds of distortion that can only stem from active sex selection on the part of the parents. For example, as we document in a previous paper (Schief et al., Reference Schief, Vogt and Efferson2021), conditional on the first two children being girls, the sex ratio among third-born children in Armenia is a staggering 330 boys for every 100 girls. In stark contrast, conditional on the first two children being boys, the sex ratio among thirdborn children does not exceed the natural level of 105 boys for every 100 girls. Active choices by parents who want to ensure the birth of a son, rather than environmental factors, are required to explain these conditional sex ratios.
3. Data and methods
Our data are a 5% random sample from the 1989 census in the Russian Soviet Federative Socialist Republic. The unit of analysis in the census is a household. A household is defined as a set of individuals who live together in a given apartment. If multiple families share a communal apartment, they were counted as separate households. For each household member, we observe their gender, date of birth and ethnicity. Our 5% random sample is the only remaining microdata from the 1989 census. Access to these data is strictly limited and requests for data access should be submitted to the International Laboratory for Population and Health at the Higher School of Economics in Moscow.
We observe the demographic characteristics of all family members who share a household at the time of the census. However, our data do not include information on family members who no longer live in the same household. Hence, the set of children recorded in the census may not be the same as the set of children born to a given couple. In particular, older children who have already moved out are not recorded. This is a challenge as studying fertility outcomes requires that we observe all children born to any given couple. We address this challenge by imposing a restrictive age limit on the oldest child observed in the census, and we exclude all households with at least one child exceeding this age limit.
We chose 14 as our cutoff age. With this cutoff, the child recorded in the census as the oldest child in the family is in fact likely to be the first-born. To see this, consider what would be required for a child to appear in our sample as the oldest child even though the child was actually not first-born. Such an outcome would require that the interbirth interval between the first- and second-born children was especially long or that the first-born child moved out at an especially young age. For example, if the birth interval between the first- and second-born child was less than 4 years, the first-born child would have had to move out before the age of 18 for us to miscategorise the second-born child. Alternatively, imagine a first-born child who moved out at the age of 23. Miscategorising the second child in this case would have required an interbirth interval of at least 9 years. Because such scenarios are probably rare, we are confident that our sample consists mostly of households for which we have information on all children. A cutoff of 14 also means that we consider children born between 1974 and 1989. Finally, the sample is restricted to families with fewer than six children.
Our goal is to examine the existence of a culture of son preference among Armenian, Georgian and Azeri parents that predates the rise in the sex ratios at birth in the Caucasus. Evidence of historical son preference among Armenian, Georgian and Azeri parents, and the lack of such evidence for parents in other cultures, would suggest that the rise in the sex ratio at birth in the Caucasus reflects deeply rooted cultural preferences rather than recent shifts towards son-biased fertility preferences. To produce such evidence, we analyse fertility outcomes of parents in Soviet-era Russia and show that Armenian, Georgian and Azeri parents appear more son biased than Eastern Europeans or Central Asians.
Comparing the fertility outcomes of parents within Soviet-era Russia has an important advantage over comparing the fertility outcomes of parents across different Soviet republics. To the extent that labour markets or local institutions in Armenia, Georgia and Azerbaijan differed from those in other Soviet republics in ways that incentivised parents to have sons, it is conceivable that incentives, rather than a culture of son preference, caused fertility outcomes to be more son-biased in the Caucasus. Comparing fertility outcomes among parents who all lived in Soviet-era Russia alleviates this concern. This strategy of comparing individuals of different cultural backgrounds living in the same institutional setting is called the epidemiological approach and has become a standard tool to isolate the causal role of culture (Fernández & Fogli, 2009; Fernández, Reference Fernández2011).
Papers relying on the epidemiological approach often study second-generation migrants because first-generation migrants are likely more strongly selected on specific traits and may not be representative of individuals in their country of origin. Our analyses are based on all households recorded as living in Soviet-era Russia at the time of the 1989 census. Although our data will certainly also contain first-generation migrants, many households will have lived in Russia for more than one generation. A limitation of our data is the lack of information on the place of residence, education or household income, which unfortunately prevents us from statistically controlling for the socio-economic characteristics of the parents in our sample.
3.1. Son preferences and the decision to have a third child
When parents decide whether or not to have another child, they take into account their current family composition. For example, all things being equal, parents with more children are less likely to have another child compared with parents with fewer children because the former are more likely to have reached their desired family size. In addition to the number of existing children, parents with sex-biased fertility preferences also take into account their sex composition. As a result, parents with a strong desire to have at least one son are more likely to have a third child when their first two children are girls. Hence, observed fertility outcomes reveal whether a significant proportion of parents follow son-biased stopping rules.
We focus on the decision to have a third child. The decision to have a second child is unlikely to reveal any son bias because the vast majority of parents in our context want to have at least two children, independent of their sex. Investigating the fertility decisions of parents with three or more children is problematic because large families are rare. Moreover, most families with three children will already have a son. Son bias may influence not only the decision whether to have another child, but also when to have it. Specifically, a tendency of parents to invest more in sons may lead to extended intervals between births after having a son, compared with shorter intervals following the birth of a daughter (Mace & Sear, Reference Mace and Sear1997).
We compute the odds of having three or more children at the time of the 1989 census for different parents who are grouped according to the sex of their first two children. The first group is made up of parents whose first two children are girls. The second group comprises parents whose first two children are boys. And the third group comprises parents whose first two children are one of each sex.
Our analysis proceeds by comparing the odds for different groups. For example, to see whether parents without a son are more likely have a third child compared to parents who already have a son, we compute the log odds ratio,

where $N_{{\rm no}\;{\rm son}}^{{\rm third}\;{\rm child}}$ is the number of households with at least three children and no son among the first two children. Similarly, $N_{{\rm no}\;{\rm son}}^{{\rm no}\;{\rm third}\;{\rm child}}$
 is the number of households without a third child and no son among the first two children, $N_{{\rm son}}^{{\rm third}\;{\rm child}}$
 is the number of households with at least three children and at least one son among the first two children, and $N_{{\rm son}}^{{\rm no}\;{\rm third}\;{\rm child}}$
 is the number of households without a third child but at least one son among the first two children. If parents do not care whether their children are sons or daughters, then their decisions to have another child depend exclusively on the number of current children, and the log odds ratios should all be equal to 0. Deviations from zero indicate a statistical association between the sex composition among the first two children and the existence of a third child.
Our data allow us to compute the odds ratios by ethnicity. While the data distinguish between 176 different ethnicities, most have very few observations, and we restrict our attention to the following: Russians, Estonians, Latvians, Lithuanians, Belorusians, Ukrainians, Moldovans, Goergians, Armenians, Azeris, Turkmens, Uzbeks, Tajiks, Kazakhs and Kyrgyz. We further group these ethnicities into four regions based on their homelands; Russia, Eastern Europe and the Baltics (Estonians, Latvians, Lithuanians, Belorusians, Ukrainians and Moldovans), Caucasus (Georgians, Armenians, and Azeris) and Central Asia (Turkmens, Uzbeks, Tajiks, Kazakhs and Kyrgyz).
4. Results
Figure 1 shows the evolution of the sex ratios at birth in Russia, Eastern Europe, the Caucasus and Central Asia, as reported by the United Nations Population Division. The clear outlier among these four regions is the Caucasus, which saw a dramatic increase in the sex ratio at birth during the early 1990s. Against this backdrop, we now turn to our data to ask whether parents of Armenian, Georgian and Azeri origin living in the Russian Soviet Federative Socialist Republic during the 1970s and 1980s similarly stand out with their fertility choices.
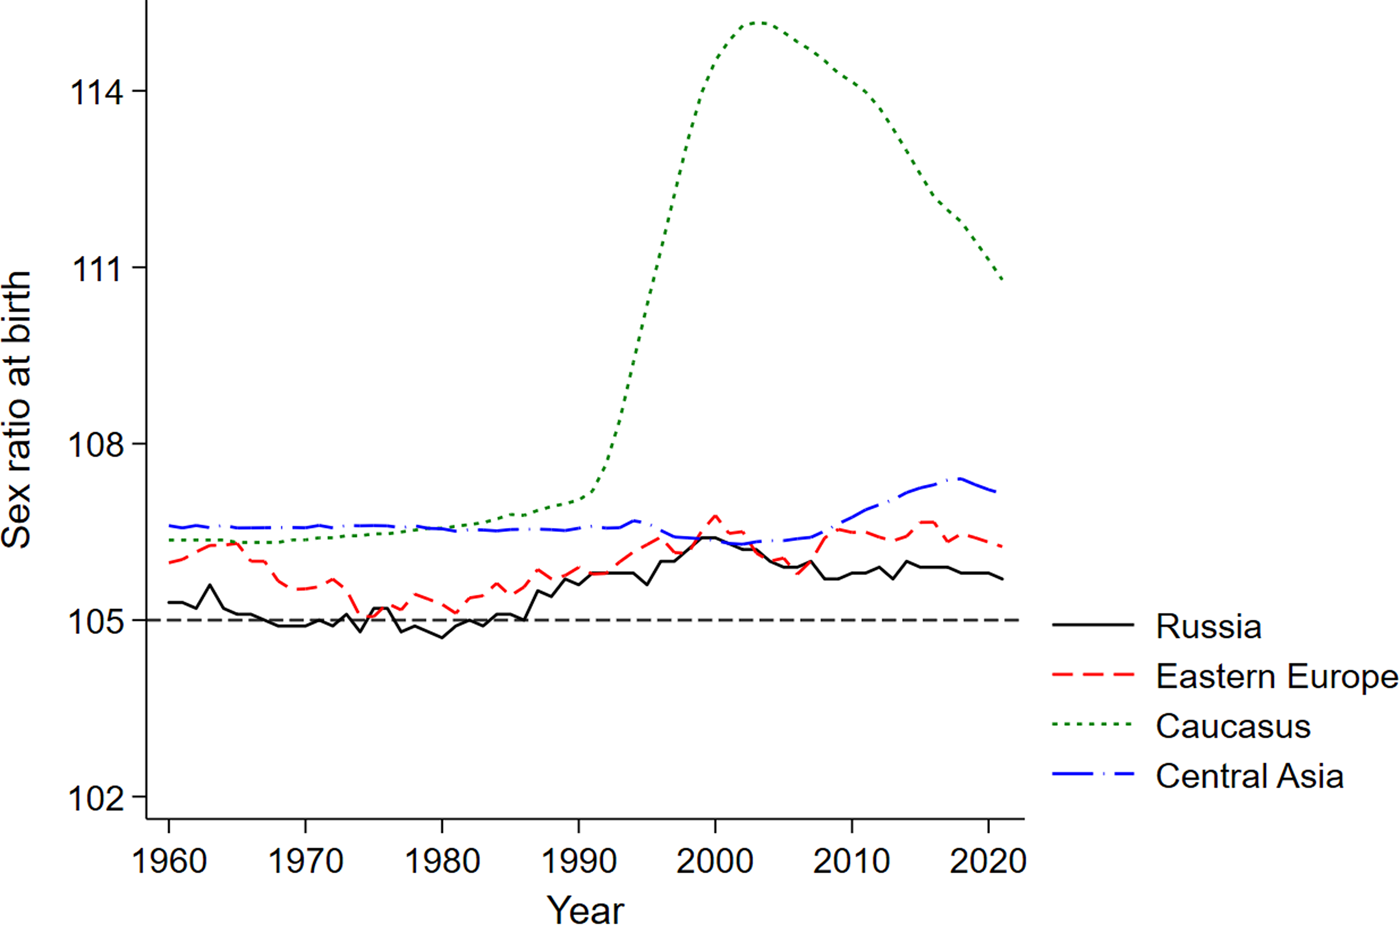
Figure 1. Evolution of sex ratios at birth (number of boys per 100 girls).
Source: United Nations, Department of Economic and Social Affairs, Population Division (2022). The sex ratio at birth for a given region is computed as the average of the country-level sex ratios weighted by population size.
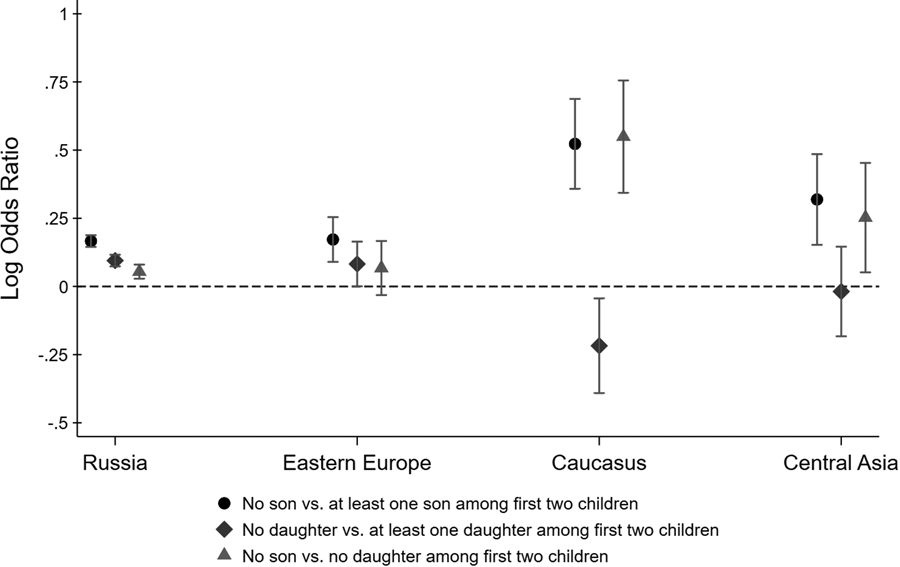
Figure 2 shows point estimates for different log odds ratios along with 95% confidence intervals. The black circle-shaped markers show log ratios of the odds of having a third child for parents with no son relative to parents with at least one son among the first two children. Similarly, the blue diamond-shaped markers show the log ratios of the odds of having a third child for parents with no daughter relative to parents with at least one daughter among the first two children. If parents have a preference for a gender mix among their children, these log odds ratios may be larger than zero, even if parents do not generally prefer sons over daughters (or vice versa). To isolate son preference, the green triangle-shaped markers show the log ratios of the odds of having a third child for parents with no son relative to parents with no daughters.
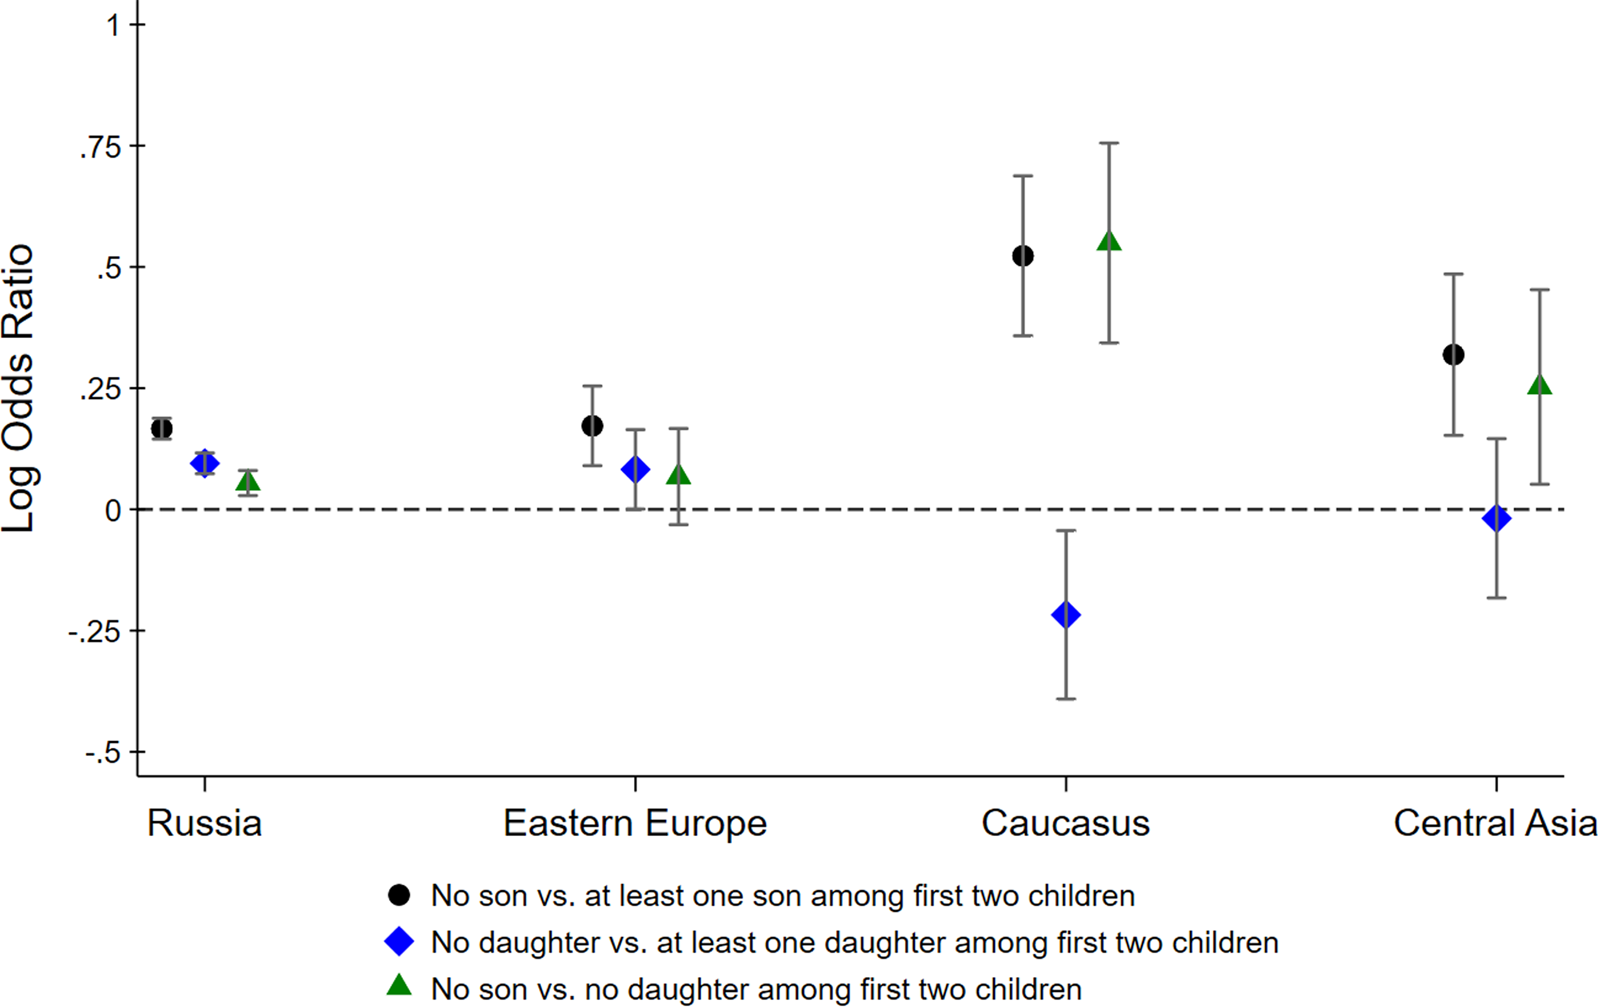
Figure 2. Log odds ratios of having a third child by sex composition of first two children. Confidence intervals are computed at the 95% level.
For Russians, all three log odds ratios are larger than 0, suggesting that Russian parents have (a) a preference for at least one son, (b) a preference for at least one daughter and (c) a stronger preference for sons than for daughters. The inferred son preference among Russian parents is relatively weak, however, with parents of two girls being only moderately more likely to have a third child compared to parents of two boys. We find very similar odds ratios for Eastern Europeans, although somewhat less precisely estimated. The odds ratios for Central Asians are more suggestive of son preference, although their confidence intervals overlap with the Russian point estimates, implying that we cannot reject the hypothesis that Central Asians are no more son biased than Russians. In contrast, Armenians, Georgians and Azeris really stand out. The fertility outcomes of parents from the Caucasus region reveal strong son bias, with parents whose first two children were girls being 1.75 times more likely to have had a third child than parents whose first two children were boys.
Figure 2 shows how the lack of a son among the first two children is associated with the decision to have a third child. The same results can also be derived within a regression framework. Table 1 reports the estimated coefficients from a logistic regression. The dependent variable is an indicator that equals one if the family has a third child and zero otherwise. We regress this indicator on different variables describing the gender composition among the first two children, interacted with ethnicity indicators. The omitted category is Russian parents whose first two children are of mixed gender. This regression analysis confirms that the lack of a son among the first two children is a strong predictor of a third child among Armenian, Georgian and Azeri households, and much less so among other households. As before, we find that Russians have a preference for a gender mix, evidenced by the higher odds of having a third child if the first two children are of the same sex. Eastern Europeans and Central Asians are not statistically different from Russians. In contrast, the interaction terms with the Caucasus dummy are statistically significant at the 1% and 5% level, respectively. Armenian, Georgian and Azeri parents are more likely to have a third child if the first two children are girls and less likely to have a third child if the first two children are boys.
Table 1. Logistic regression table

Standard errors in parentheses.
*p < 0.05, ** p < 0.01, *** p < 0.001.
What about the possibility that infant mortality affects our results? Deceased children are not included in the census, implying that in our data the gender of the first two children may not always correspond to the gender of the first two children born in a given household. Nevertheless, infant mortality is extremely unlikely to drive our results. Estimates put the rate of infant mortality in the Soviet Union during the mid-1980s at about 32 in 1000 (Anderson & Silver, Reference Anderson and Silver1986). This number may mask heterogeneity across different population subgroups. However, even if households faced different mortality rates, reflecting for example differential access to medical care, the gender composition within households would remain unaffected as long as the relative mortality rates of boys vs. girls is similar across households. Gender-biased care can in principle distort the relative survival probabilities of boys vs. girls, but there is no evidence of gender-biased mortality rates in our context. In Table 2, we report the sex ratios for the same set of ethnicities. As expected, the sex ratios are similar across groups, and a common sex ratio of 103 boys for every 100 girls cannot be statistically rejected.
Table 2. Summary statistics. The sex ratio is defined as the number of boys per 100 girls

5. Discussion
Over the past decades, parents in Armenia, Georgia and Azerbaijan have resorted to sex-selective abortions to influence the sex composition of their children. As a result, the number of boys born for every 100 girls has increased to levels far beyond the natural sex ratio at birth. Heightened sex ratios first emerged in the 1990s following the dissolution of the Soviet Union, which brought about important changes in the social and economic structure of post-Soviet societies. What caused this increase in sex ratios? On the one hand, the strengthening of national identities and religiosity, the sharp increase in economic insecurity, the new reliance on male labour migration, and the diminished representation of women in political position may all have occurred alongside a shift in fertility preferences toward an increased valuation of sons over daughters. On the other hand, the 1990s also saw a plummeting of fertility levels and a greatly expanded availability of medical ultrasound so that parental preferences for sons could for the first time be reflected in heightened sex ratios. Against this backdrop, it is unclear ex ante whether the increasing sex ratios at birth during the 1990s reflected a contemporary shift toward more son-biased fertility preferences or rather a newfound ability to meet deeply-rooted cultural preferences for sons by preferentially aborting female fetuses.
Using microdata from the 1989 census in the Russian Soviet Federative Socialist Republic, we show that the fertility decisions of Armenian, Georgian and Azeri parents in the late 1970s and the 1980s were much more son-biased than the fertility decisions of Russians, Eastern Europeans and Central Asians. We interpret this finding as evidence that the recent increase in the sex ratio at birth in the Caucasus is at least partially reflecting deep-rooted cultural preferences for sons.
Can the son preferences inferred from the observed fertility choices in our data rationalise the steep increase in sex ratios at birth in the Caucasus? Answering this question would require mapping the prevalence of stopping behaviour before the advent of ultrasound technology onto the later evolution of the sex ratio when sex-selective abortions became possible. Although achieving a precise mapping may not be possible, it may still be helpful to consider a stylised model. The purpose is to analyse the potential impacts of the preferences underlying stopping rule behaviour on sex ratios in the presence of sex-selective abortions.
Assume that parents can have either two or three children. Parents are more likely to have a third child if their first two children are girls, and they can choose to resort to sex selection on the third child to ensure the birth of a son. We assume a natural sex ratio of 105 boys for every 100 girls. We further assume that half the parents resort to sex selection on the third child to ensure a male birth, provided they do not already have a son. These assumptions imply a conditional sex ratio of 310 boys for every 100 girls – consistent with estimates of the conditional sex ratio among third-born children with two older sisters in Armenia (Guilmoto, Reference Guilmoto2013; Schief et al., Reference Schief, Vogt and Efferson2021). The free parameters of this model are the conditional probabilities of having a third child given the gender of the first two children.
We consider three scenarios for the conditional probabilities of having a third child given the gender of the first two children. In the first scenario, the probability of having a third child is 0.5 for all parents, irrespective of the gender of the first two children. The second scenario introduces sex-biased fertility stopping. In our data, Armenian, Georgian and Azeri parents whose first two children are girls are 1.75 times more likely to be recorded with a third child than parents from the same countries whose first two children are boys. Motivated by these numbers, we increase the probability of having a third child from 0.5 to 0.875 for parents without a son. As a consequence, average fertility is also higher in scenario 2 than scenario 1. Finally, in the third scenario, we consider a case without sex-biased fertility stopping but the same average fertility as in the second scenario. To achieve this, we set the probability of having a third child to 0.59 for all parents.
Table 3 reports the sex ratio at birth in each of these scenarios. Notably, the sex ratio is largest in the second scenario where it reaches almost 114 boys for every 100 girls. This sex ratio is consistent with estimates for Armenia during the late 1990s and early 2000s. It therefore seems plausible that the magnitude of the son preferences inferred from the observed fertility choices in our data can rationalise the increase in the sex ratio during the 1990s following the introduction of sex selection technology in the Caucasus. Admittedly, however, this stylised model needs to be interpreted with caution, as it relies on strong assumptions. It is likely, for example, that the possibility of sex selection would also change the conditional probability of deciding to have third child.
Table 3 Hypothetical sex ratios (number of boys per 100 girls) under different scenarios for stopping rules

Interestingly, our results also support – tentatively – one of the key hypotheses of gene–culture coevolution, namely the claim that cultural evolutionary processes can reshape selection on genes in ways that would not otherwise occur (Richerson & Boyd, Reference Richerson and Boyd2008). If distorted sex ratios are a manifestation of the same son-biased culture that we identify in Soviet-era Russia, then gene–culture coevolutionary models suggest that the culturally evolved choices behind these biased sex ratios can generate selection pressures on the genes that influence the primary sex ratio at fertilisation (Kumm et al., Reference Kumm, Laland and Feldman1994; Laland et al., Reference Laland, Kumm and Feldman1995; Kumm & Feldman, Reference Kumm and Feldman1997). In particular, as sex ratios at birth started to climb in the 1990s, families were setting the stage for an excess of marriageable men and a shortage of marriageable women in the 2020s. They were setting the stage for a system out of equilibrium from the perspective of natural selection and the associated primary sex ratio it favours.
Why do Armenia, Georgian and Azeri parents have strong son preferences? While our paper leaves this question ultimately unanswered, it provided helpful clues in the quest to explain the phenomenon of son bias in the Caucasus. Whatever the origin of son biased fertility preference in the Caucasus, our analyses strongly suggest that it has little to do with the events associated with the dissolution of the Soviet Union. The falling apart of an established economic and political order and the social upheaval that went along with that surely affected preferences and norms and may have left a lasting mark on the culture in these societies. However, strong son bias appears to predate the 1990s, and the search for a satisfactory explanation should therefore be focused on earlier history.
Acknowledgements
We thank Evgeny M. Andreev for kindly providing us with the required data from the special sample micro-data file of the Soviet Population Census of 1989. We also thank two anonymous referees and the editor, Ruth Mace, for their helpful suggestions. Sonja Vogt and Charles Efferson thank the Swiss National Science Foundation (Grant Nrs. 100018_185417 and 100018_215540).
Author contributions
MS: conceptualisation, analysis, and writing. SV: conceptualisation. EC: data preparation. CE: conceptualisation and writing.
Financial support
SV and CE thank the Swiss National Science Foundation (Grant Nrs. 100018_185417 and 100018_215540).
Conflicts of Interest
CE is a member of the editorial board of Evolutionary Human Sciences. Otherwise, MS, SV, and EC declare none.
Research transparency and reproducibility
Access to the special sample micro-data file of the Soviet Population Census of 1989 is restricted but can be requested.


 Open access