


In many cases, the extent of the area invaded by an invasive species is so substantial that there are simply insufficient resources to control and manage the full extent of the invasion. Efficient use of resources and best management practices are critical for achieving invasive species management goals. It is important for scientific researchers to provide recommendations to land managers on how best to prevent new invasions and prioritize management efforts on existing invasions. Systematic regional planning is one way to quantitatively prioritize different management actions across the landscape, and has application to large-scale invasive species management.
Box 1 Management Implications
Nonnative invasive species are one of the biggest threats to biodiversity worldwide. Invasive species often negatively affect the structure, function, and services of ecosystems they invade. Annually, public and private organizations spend significant time and resources managing invasive species, often ineffectively.
Here we use systematic regional planning to prioritize areas around the Great Salt Lake in Utah for control and restoration of the invasive wetland grass common reed [Phragmites australis (Cav.) Trin. ex Steud.]. We apply results from a previously developed species distribution model for common reed to create a prioritization framework for control and restoration of common reed around the Great Salt Lake. By using results from a species distribution model that show wetland areas that are vulnerable to future invasion, we are able to create a detailed map showing areas to prioritize for invasive species management. This prioritization framework can help wetland managers better focus resources and efforts in targeted areas where there is greatest likelihood of successfully controlling common reed and restoring critical wetland habitat.
Nonnative invasive species are one of the biggest threats to biodiversity worldwide (Pimentel et al. Reference Pimentel, Pimentel and Wilson2007). Invasive species often negatively affect the structure, function, and services of ecosystems they invade (Cronk and Fuller Reference Cronk and Fuller1995; Horan et al. Reference Horan, Perrings, Lupi and Bulte2002). Annually, public and private organizations spend significant time and resources managing invasive species, often ineffectively (Olson Reference Olson2006; Pimentel et al. Reference Pimentel, Zuniga and Morrison2005). Economic losses resulting from invasive species and control efforts have been estimated at $120 billion yr-1 in the United States (Pimentel et al. Reference Pimentel, Zuniga and Morrison2005).
Invasive species may span many different sites, land ownership, and jurisdictional boundaries. In many cases the extent of the area invaded by an invasive species is so substantial that there are simply insufficient resources to control and manage the full extent of the invasion (Caplat et al. Reference Caplat, Coutts and Buckley2012). Efficient use of resources and best management practices are critical for achieving invasive species management goals (Papeş et al. Reference Papeş, Sällström, Asplund and Vander Zanden2011). It is important for scientific researchers to provide recommendations to land managers on how best to prevent new invasions and prioritize management efforts on existing invasions (Papeş et al. Reference Papeş, Sällström, Asplund and Vander Zanden2011). Systematic regional planning is one way to quantitatively prioritize different management actions across the landscape (Bryan and Crossman Reference Bryan and Crossman2008) and has application to large-scale invasive species management.
Spatial conservation prioritization is an aspect of systematic regional planning where available spatial information on environmental and socioeconomic conditions is used to aid in decision making for conservation or other natural resource management issues (Moilanen et al. Reference Moilanen, Wilson and Possingham2009). Spatial prioritization has been used extensively in conservation planning and management but is applicable to any natural resource management activity that involves spatial choice in selection of management options (Moilanen et al. Reference Moilanen, Wilson and Possingham2009). The suitability of a site for restoration depends on surrounding environmental conditions both on the local site scale and landscape scale, and spatial prioritization can be useful for identifying these factors and allows land managers to select optimal sites for management and restoration (Thomson et al. Reference Thomson, Moilanen, Vesk, Bennett and Mac Nally2009). Spatial prioritization has been used in several wetland restoration planning studies (Kauffman-Axelrod and Steinberg Reference Kauffman-Axelrod and Steinberg2010; Moreno-Mateos and Comin Reference Moreno-Mateos and Comin2010), in forest restoration (Orsi and Geneletti Reference Orsi and Geneletti2010), and in riparian and watershed restoration (Steel et al. Reference Steel, Fullerton, Caras, Sheer, Olson, Jensen, Burke, Maher and McElhany2008). Spatial prioritization has not been used as extensively in invasive species management, yet there are clear opportunities for spatial prioritization methods to inform invasive species management (Pool et al. Reference Pool, Strecker and Olden2013; Skurka Darin et al. Reference Skurka Darin, Schoenig, Barney, Panetta and DiTomaso2011; Thomson et al. Reference Thomson, Moilanen, Vesk, Bennett and Mac Nally2009). Many invasive species risk analysis, prioritization, or decision analysis studies do not include an explicit spatial component (Forsyth et al. Reference Forsyth, Le Maitre, O’Farrell and van Wilgen2012). With information about an invasive species’ current and predicted future range, studies can create spatially explicit risk analysis or control prioritization models. Region-wide risk assessments on the potential for nonnative plants to become invasive in a new area have become common (Kumschick and Richardson Reference Kumschick and Richardson2013; Richardson and Thuiller Reference Richardson and Thuiller2007; Wilson et al. Reference Wilson, Gairifo, Gibson, Arianoutsou, Bakar, Baret, Celesti-Grapow, DiTomaso, Dufour-Dror, Kueffer, Kull, Hoffmann, Impson, Loope, Marchante, Marchante, Moore, Murphy, Tassin, Witt, Zenni and Richardson2011). These studies are useful for prevention of new species becoming established and for setting early detection and rapid-response priorities. However, after a species establishes in an area, it is useful to have a framework or areas identified to target control, monitoring, and restoration efforts, and this is where spatial prioritization efforts are useful.
Invasive species spatial prioritization models require data on the current distribution, the biotic and abiotic factors driving invasion, and areas that might be vulnerable to future invasion (Epanchin-Niell and Hastings Reference Epanchin-Niell and Hastings2010). An understanding of the biotic or abiotic factors that contribute to successful spread and establishment of invasive plants can inform management decisions regarding areas to target monitoring and control efforts and steps that can be taken to prevent invasion into new systems (Hobbs and Humphries Reference Hobbs and Humphries1995). Species distribution modeling (SDM) is a correlative statistical technique that associates the presence or absence of species with biotic and abiotic predictor variables (Franklin Reference Franklin2010). Use of SDM is becoming increasingly common in invasion ecology, both to explain current distributions of invasive species and to predict areas of future invasions (Andrew and Ustin Reference Andrew and Ustin2009; Crall et al. Reference Crall, Jarnevich, Panke, Young, Renz and Morisette2013; Menuz and Kettenring Reference Menuz and Kettenring2012). The results from these models can aid land managers in prioritizing areas for extra monitoring and control efforts (Dullinger et al. Reference Dullinger, Kleinbauer, Peterseil, Smolik and Essl2009; Franklin Reference Franklin2010; Stohlgren et al. Reference Stohlgren, Ma, Kumar, Rocca, Morisette, Jarnevich and Benson2010).
While use of species distribution models has increased in recent years (Barbosa et al. Reference Barbosa, Schneck and Melo2012), fewer studies have explicitly addressed how SDM results could be applied to conservation and natural resources management issues. Ecological models can aid decision making by evaluating different consequences of management actions (Starfield Reference Pimentel, Zuniga and Morrison1997). However, often ecological models are created but not actually used to make management decisions (Arlettaz et al. Reference Arlettaz, Schaub, Fournier, Reichlin, Sierro, Watson and Braunisch2010) because managers do not have access to scientific publications, are not familiar with or have little experience using the models, do not trust model results, have perceptions of differences in agenda, or fear that models would decrease the decision makers’ autonomy to make decisions (Addison et al. Reference Addison, Rumpff, Bau, Carey, Chee, Jarrad, McBride and Burgman2013; Arlettaz et al. Reference Arlettaz, Schaub, Fournier, Reichlin, Sierro, Watson and Braunisch2010). As a result, it is important to develop models that are appropriate for on-the-ground natural resource management goals and objectives and involve managers and stakeholders in the research process. Models may sometimes be seen as either too simple or too complex for the decision they are intended to address or do not propose management recommendations that are explicit or specific enough (Addison et al. Reference Addison, Rumpff, Bau, Carey, Chee, Jarrad, McBride and Burgman2013; Arlettaz et al. Reference Arlettaz, Schaub, Fournier, Reichlin, Sierro, Watson and Braunisch2010). Frameworks for how model results can be used by decision makers can help to implement research recommendations (Larocque et al. Reference Larocque, Bhatti, Ascough, Liu, Luckai, Mailly, Archambault and Gordon2011). Implementation strategies for model results are especially important when creating SDMs for invasive species. Often, results from SDM output and other invasion-related research can explain general factors that make a site more vulnerable to invasion but may not provide management recommendations that are specific enough (Levin-Nielsen Reference Levin-Nielsen2012; Papeş et al. Reference Papeş, Sällström, Asplund and Vander Zanden2011).
We apply results from a previously developed SDM (Long et al. Reference Long, Kettenring, Hawkins and Neale2017) to create a prioritization framework for control and restoration of the invasive wetland grass common reed. Nonnative common reed is one of the most problematic invasive plants in wetlands and moist, disturbed habitats across North America (Kettenring et al. 2012b; Saltonstall Reference Saltonstall2002). It creates dense monocultures and thereby displaces beneficial native wetland vegetation and reduces the quality of the habitat and ecosystem services provided by wetlands (Chambers et al. Reference Chambers, Havens, Killeen and Berman2008; Kettenring et al. Reference Kettenring, de Blois and Hauber2012a; Silliman and Bertness Reference Silliman and Bertness2004). Significant resources are spent controlling introduced common reed on public and private lands across North America, including our study area, the Intermountain West (Hazelton et al. Reference Hazelton, Mozdzer, Burdick, Kettenring and Whigham2014; Kettenring et al. Reference Kettenring, de Blois and Hauber2012a; Martin and Blossey Reference Martin and Blossey2013). It is therefore essential for common reed managers to understand both the current extent of invasion and biotic and abiotic conditions that contribute to invasion. Common reed is difficult to eradicate, and control and management efforts often fall short of management goals, making studies about how to best prioritize resources for highest likelihood of management success necessary (Hazelton et al. Reference Hazelton, Mozdzer, Burdick, Kettenring and Whigham2014; Martin and Blossey Reference Martin and Blossey2013). Here we address common reed invasion in the ecologically significant Great Salt Lake (GSL), Utah wetlands to develop and apply a robust spatial prioritization model to improve management outcomes in this system. We developed our spatial prioritization model specifically for common reed management around the GSL. However, the framework could reasonably be applied to invasive species management in other areas.
Material and Methods
Study Area
As with many other wetlands of North America, GSL wetlands have been heavily invaded by common reed. These over 150,000 ha of wetlands around the GSL constitute the majority of wetlands in the state of Utah and a significant portion of wetlands in the Intermountain West. They provide critical habitat for migratory birds on the Pacific and Central flyways; around one third of all western waterbirds migrate through GSL wetlands (Jensen Reference Jensen1974; Paul and Manning Reference Paul and Manning2002). GSL wetlands are managed by several different agencies, including federal, state, nonprofit, and private duck hunting clubs (Figure 1). Despite significant resources spent on controlling this plant on public and private lands in Utah and elsewhere, little research has assessed the drivers of common reed invasion in inland wetlands, especially in the semiarid Intermountain West, making coordinated, lake-wide management efforts difficult (but see Kulmatiski et al. Reference Kulmatiski, Beard, Meyerson, Gibson and Mock2011; Kettenring and Mock Reference Kettenring and Mock2012).

Figure 1 Great Salt Lake wetland area land ownership. Wetlands around the Great Salt Lake are mostly managed by federal and state agencies, private duck clubs, and nonprofit agencies.
Previously, we determined the distribution of common reed around the GSL and environmental conditions that correlate with increased risk of common reed invasion (Long et al. Reference Long, Kettenring, Hawkins and Neale2017). We used 1m multispectral remote sensing imagery to map the current distribution of common reed and SDM to identify areas vulnerable to future invasion (Figure 2). Results from the remote sensing and SDM are the foundation for our prioritization model. For a full description of the methods used for common reed mapping and modeling, see Long et al. (Reference Long, Kettenring, Hawkins and Neale2017).

Figure 2 (A) Vegetation layer of wetland vegetation around the Great Salt Lake (GSL) based on 1m multispectral imagery that was classified using pixel based classification. (B) GSL common reed habitat suitability map based on species distribution modeling results. Each raster cell consists of a probability ranging from 0 to 1, with 0 being the least suitable habitat and 1 being the most suitable. See Long et al. (Reference Long, Kettenring, Hawkins and Neale2017) for full details on the vegetation classification and habitat suitability modeling.
Prioritization Model
To create our common reed prioritization model, we used multi-criteria decision analysis (MCA) to rank common reed patches for control. MCA is a systematic approach to decision making using multiple criteria when applied to complex management decisions (Belton and Stewart 2002). MCA can aid individuals or groups of stakeholders in exploring multiple management options. It is often used in complex natural resource management scenarios, where goals and outcomes may be influenced by different fields, such as natural resources, social sciences, and politics (Langemeyer et al. Reference Langemeyer, Gomez-Baggethun, Hasse, Scheuer and Elmqvist2016; Roura Pascual et al. Reference Roura‐Pascual, Krug, Richardson and Hui2010). MCA is commonly paired with Geographic Information System (GIS)-based analysis to create spatial prioritization or decision support tools. We used an MCA approach in our project, but other decision support tools that are commonly used in conservation planning and invasive species management include systematic conservation planning using programs such as Marxan (Ball et al. Reference Ball, Possingham and Watts2009; Januchowski-Hartley et al. Reference Januchowski-Hartley, Visconti and Pressey2011) and state and transition models (Frid et al. Reference Frid, Hanna, Korb, Bauer, Bryan, Martin and Holzer2013), among other approaches. We selected an MCA approach because of its straightforward nature and ease of application.
We created the prioritization model based on a 2-part MCA (Figure 3): (1) an assessment of the need for restoration of a patch (restoration need), and (2) an assessment of the likelihood that restoration will succeed in that patch (restoration feasibility) (Orsi and Geneletti Reference Orsi and Geneletti2010). The restoration need score attempts to identify areas that have patches of common reed that would have a major benefit to the overall landscape if restored (Table 1), including areas that would be good wetland habitat if restored, such as areas with lots of desirable emergent vegetation in the vicinity. The restoration need score assigns value from both an ecological and resource-use perspective, such as proximity to areas used for recreation. The restoration feasibility score is a measure of how likely restoration success is for that patch (Table 2). The feasibility score includes both ecological and management aspects that might influence how likely a site will be to restore both in terms of removing common reed, and keeping it from becoming reinfested. The restoration need score focuses on how desirable a patch is to restore, while the restoration feasibility score focuses on how attainable it would be for a wetland manager to successfully restore that patch. Each patch was assigned both a restoration need score and a restoration feasibility score (either high or low) based on the input. For the prioritization model, we extracted the common reed raster cells from our classified GSL vegetation raster. We then used the clump function in the raster package in R 3.0.1 (R Core Team Reference Core Team2013) to group common reed pixels into unique patches.
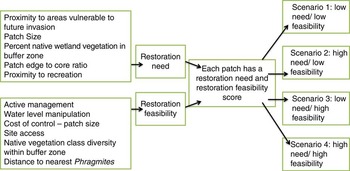
Table 1 Restoration need score variables. The restoration need score attempts to identify areas that have patches of common reed that would have a major benefit to the overall landscape if restored.

Table 2 Restoration feasibility score variables. The restoration feasibility score is a measure of how likely restoration success is for that patch.

Predictor Variables
We determined the variables used for the restoration need (Table 1) and restoration feasibility (Table 2) score based on common reed literature and feedback from multiple meetings with wetland managers from federal, state, local, and private agencies. We sent out a preliminary prioritization framework to wetland managers around the GSL to obtain feedback on the criteria we selected for prioritization. We made adjustments to the model based on manager feedback and presented preliminary model results at a GSL Phragmites Working Group meeting. The GSL Phragmites working group is a voluntary group comprised of wetland managers, research scientists, and concerned citizens with the goal of creating a coordinated management effort for common reed around the GSL. Attendees at the GSL Phragmites working group meeting included federal and state wetland managers, private duck club reserve managers, university researchers, and consulting scientists. In addition, our framework was also presented at the GSL Technical Team meeting. The GSL Technical Team is a working group through the Utah Department of Forestry, Fire, and State Lands that is made up of scientists, land managers, and industry representatives to provide recommendations on the science and management of GSL ecosystems (Long et al. Reference Long, Kettenring, Hawkins and Neale2017). We made final adjustments to the prioritization model based on feedback we received from the working group meetings.
We calculated proximity to areas vulnerable to common reed invasion based on a habitat suitability raster from our previous work on common reed distribution and habitat suitability modeling around the GSL (Long et al. Reference Long, Kettenring, Hawkins and Neale2017). Proximity to areas vulnerable to common reed invasion was calculated using the Near function in ArcGIS 10.1 (Environmental Systems Research Institute [ESRI], Redlands, CA). We calculated patch size, where the minimum patch size was the minimum mapping unit from Long et al. (Reference Long, Kettenring, Hawkins and Neale2017), 1 m2. We calculated the percent of native wetland vegetation classes within a buffer zone of 100 m. Wetland type was based on the updated National Wetland Inventory dataset (NWI) (USFWS 2012). Proximity to recreation was calculated using proximity to boat launches and public waterfowl hunting areas, whose locations were obtained from records from the Utah Automated Geographic Reference Center (UT AGRC).
We obtained data on variables associated with the restoration feasibility score based on land use and management records and publicly available GIS layers. We obtained the land ownership file from the Utah AGRC (AGRC 2013). Active management is a measure of whether a patch of common reed is in an area that has been actively managed for common reed control in the past 3 years. This layer was compiled based on control and management records and information provided by wetland managers around the GSL. GSL wetlands are frequently impounded to give managers increased control of water levels so they can maximize water levels for waterfowl and shorebird habitat, resulting in highly modified hydrology. Water level manipulation criteria measures whether a patch of common reed is in a site where land managers have the ability to manipulate water levels. We compiled these data based on the water diversion records from the State of Utah and on information provided by wetland managers. We used the Near function in ArcGIS 10.1 to calculate proximity to other common reed patches.
Patch Scoring
Values for each variable were calculated in ArcGIS 10.1 and then transformed to a value between 0 and 1 that took into account whether the variable was a benefit or a cost in terms of common reed restoration need or feasibility (Geneletti Reference Geneletti2005; Orsi et al. 2010). We then used a simple linear weighted summation to produce an index score, where each of the variables was given equal weight. However, if a manager thought certain aspects of prioritization were more important than others, the weighting of the criteria could be manipulated based on management needs and goals. To develop the restoration need and restoration feasibility scores, we added up the criteria for each group and then assigned the scores categories of either high or low based on the distribution of the scores (Tables 3 and 4).
Table 3 Restoration need variable scores.

Table 4 Restoration feasibility variable scores.
Scenario Development and Assessment
We then developed four different alternative management scenarios based on the combination of the restoration need and restoration feasibility scores: Scenario 1 (low need and low feasibility), Scenario 2 (high need and low feasibility), Scenario 3 (low need and high feasibility), and Scenario 4 (high need and high feasibility) (Figure 4). We used the combination of these 2 scores to determine which scenario each patch fell into. We analyzed the distribution of the restoration need and feasibility scores and assigned them high or low based on the median score value (Table 4). We calculated landscape statistics for each scenario to compare the potential overall effect of common reed management for each scenario. We calculated the total area and number of patches for each scenario. We also calculated the areas of each scenario on each land-ownership type.

Figure 4 Great Salt Lake common reed patches by priority class, based on prioritization model results.
Results and Discussion
Common reed patches were almost evenly divided between high and low restoration need scores, with slightly more low restoration need patches. The low need, low feasibility scenario comprised the most area (2,800 ha), followed by high need, low feasibility (1,994 ha), then low need, high feasibility (1,801 ha), and lastly, high need, high feasibility (1,380 ha). Often patches that were ranked as low restoration need were either in close proximity to other common reed patches, or had low cover and diversity of native wetland vegetation in close proximity.
Our landscape level prioritization allowed us to examine general patterns of common reed distribution and management constraints on a lake-wide scale. Often sites are selected for restoration or invasive species control based on availability, budget, or ease of access, and factors such as optimal spatial location in the landscape or likelihood of restoration success given site conditions are not always considered (Epanchin-Niell and Hastings Reference Epanchin-Niell and Hastings2010; Maron and Cockfield Reference Maron and Cockfield2008). Using a systematic prioritization approach can result in greater restoration success by selecting sites where conditions are optimal for restoration, greater connectivity between restored sites, and lowered chances of reinvasion if neighboring sites are restored as well.
The majority of common reed patches around the GSL fell into low feasibility classes, suggesting that it may be difficult to achieve successful control with these patches (Figure 5). Often low feasibility scores were the result of proximity to suitable but unoccupied common reed habitat. However, there were still many patches with high feasibility scores where control efforts are likely to be more successful. Focusing control and management on these patches will likely have more success.

Figure 5 Hectares of land in each scenario type from results of common reed restoration prioritization model. Results are further broken down by Great Salt Lake wetland landowner type.
Scenario 1 patches had a low need for restoration (such as patches that are not close to suitable common reed habitat and not as likely to expand) and also low feasibility (difficult to access, for example). These areas could be put lowest on the priority list when dealing with limited resources. Scenario 2 patches had a high restoration need (such as large areas of common reed) but low feasibility. These are areas that may require significant effort to manage, are difficult to access, or have other management factors that contribute to a low possibility of success. These patches may be areas that managers would want to put lower down on the priority list for management when dealing with limited resources and first focus on the high need areas that also have a higher feasibility. Scenario 3 patches had low restoration need and high restoration feasibility. These patches would be good areas to target for management and restoration because they may be easy targets with high potential for success. For example, these might be areas that are small isolated patches of common reed that are easy to access and surrounded by a lot of emergent wetland vegetation. These are areas that could be “low hanging fruit” to manage and restore and could help reduce the expansion of common reed around the lake. Lastly, Scenario 4 included patches with high restoration need and high restoration feasibility. These patches may be large core common reed areas surrounded by lots of healthy wetland habitat that could have a big impact on the overall wetland condition if managed. These are areas that would require more effort for management and restoration than Scenario 3 but still have a good chance of succeeding because of a high feasibility score (easy access, water level manipulation ability, etc.). Since these areas are high need, they may be bigger projects, but would still be worth the effort as they could eliminate large sources of common reed expansion.
We chose to calculate restoration need and restoration feasibility scores separately for each patch to allow multiple prioritization scenarios and flexibility in management. For example, depending on management goals, managers may only want to focus on patches with high feasibility scores regardless of restoration need, or they may want to focus on patches with high restoration need regardless of restoration feasibility. Management goals may differ depending on ownership type, so ownership analysis allows us to look at composition of restoration need and feasibility across land ownership types (Figure 5). Additionally, adding a factor that incorporates the percentage of land occupied by common reed for each land owner could be another criterion under the restoration feasibility score. Such a variable could better account for the fact that some agencies have more common reed than others, and therefore their resources for common reed control will be spread thin.
We developed the criteria for the restoration need and feasibility scores based on data available and factors listed as important based on meetings with wetland managers. However, as new data becomes available or new management concerns arise, the criteria and model could be updated. There are certain criteria that were hard to incorporate as spatial data into the model but are important to consider in common reed management around the GSL. We were not able to incorporate a relative comparison of resources each agency or private duck club can devote to common reed management around the lake. However, detailed numbers on each organization and landowner’s common reed control budget could improve the criteria for restoration feasibility scores. We used patch size as an index of the relative cost of controlling a patch, but more detailed data on cost of control could greatly improve the model and the feasibility score. Cost of management is one of the greatest limiting factors in invasive species control, so ensuring that it is accurately represented in invasive species prioritization models is important. There are various ways of incorporating bioeconomic models for invasive species prioritization, but many of these bioeconomic models are complex to develop, and were outside of the scope of our project (Epanchin-Niell 2010).
Based on manager feedback we weighted all criteria the same, but criteria weights can be adjusted to meet different management goals. We used a very straightforward scoring method, which is very common in many conservation prioritization methods (Moilanen et al. Reference Moilanen, Wilson and Possingham2009). However, more complex systems of scoring and weighting criteria exist and can be implemented in various conservation prioritization software programs, such as Marxan or Zonation (Moilanen et al. Reference Moilanen, Wilson and Possingham2009), or using analytic hierarchy process (Forsyth et al. Reference Forsyth, Le Maitre, O’Farrell and van Wilgen2012; Januchowski-Hartley et al. Reference Januchowski-Hartley, Visconti and Pressey2011; Thomson et al. Reference Thomson, Moilanen, Vesk, Bennett and Mac Nally2009).
While there is extensive research on effects of invasive species on ecosystems and factors leading to invasion, often this information is not directly translated into invasive species management actions (Levin-Nielsen Reference Levin-Nielsen2012; Papeş et al. Reference Papeş, Sällström, Asplund and Vander Zanden2011). It is important to take outputs from ecological research and models on invasive species and provide more specific management recommendations and to put these recommendations in the context of related social or economic settings. Frequently with invasive species management the infestation is much larger than many land managers have the time or resources to address (Skurka Darin et al. Reference Skurka Darin, Schoenig, Barney, Panetta and DiTomaso2011). Studies on how to prioritize control efforts and specific recommendations for how to use results of invasive species research and models can help guide invasive species management. Incorporating criteria related to feasibility of on-the-ground invasive species control, management, and restoration is something that is often lacking in planning for restoration (Aronson et al. Reference Aronson, Blignaut, Milton, Le Maitre, Esler, Limouzin, Fontaine, De Wit, Mugido, Prinsloo, Van Der Elst and Lederer2010; Knight et al. Reference Knight, Sarkar, Smith, Strange and Wilson2011).
Acknowledgements
This research was supported by Kennecott Utah Copper Charitable Foundation; Utah Division of Forestry, Fire & State Lands; Utah Division of Water Quality; Utah Division of Wildlife Resources; Utah Wetlands Foundation; the Utah Agricultural Experiment Station; and the Utah State University Department of Environment and Society. We thank the Kettenring Wetland Ecology Lab, N. Hough-Snee, and two anonymous reviewers for their valuable feedback.


