1. Introduction
Higher energy prices and increased biofuel production over the past decade have substantially impacted the agricultural sector, especially through higher and more volatile prices. The changes to agricultural commodity output prices have understandably been a major focus in the research arena (e.g., McPhail, Reference McPhail2011; Nazlioglu, Erdem, and Soytas, Reference Nazlioglu, Erdem and Soytas2013; Nazlioglu and Soytas, Reference Nazlioglu and Soytas2012). Although agricultural input price changes have also been volatile over the past decade, they have received much less attention. Yet, these inputs are no less important, especially fertilizers, which have become a necessary and vital input for crop production.Footnote 1
The impacts of higher input prices are felt, in particular, when the input has few substitutes or is necessary for production. Some agricultural inputs have a close substitute (e.g., labor and capital can be substituted for each other to some degree in the long run) or are something that farmers can put off purchasing for a couple of years (e.g., a new tractor); however, others, such as fertilizers, are more rigid. That is, there is little farmers can do to boost crop yields beyond applying the necessary amount of fertilizer.Footnote 2 In fact, the two agricultural production inputs that have experienced the largest and most volatile price changes during the biofuels era, fertilizers and fuels, have very few substitutes (Beckman, Borchers, and Jones, Reference Beckman, Borchers and Jones2013). However, whereas increasing fuel prices can be linked to higher oil prices, the price of the main input for fertilizers (natural gas) has declined overall during the past decade.
Historically, U.S. fertilizer prices have been largely linked with supply-side forces (Huang, 2007); however, recent changes in the energy and agricultural sectors have seemingly altered this relationship. Indeed, natural gas prices have declined over the past 10 years, whereas fertilizer prices reached record highs in 2008 and have stayed at higher than average levels since then. This is despite natural gas costs comprising approximately 70%–80% of fertilizer production costs (Gellings and Parmenter, Reference Gellings, Parmenter, Gellings and Blok2004). The change in this price relationship has occurred for a variety of reasons: record natural gas output, a decline in domestic fertilizer production, an increase in global demand for fertilizers, and an increase in the demand for fertilizers by crop (mainly corn) producers. This last point is particularly important, as fertilizer prices now seem to have a closer relationship with corn prices. To add to these changes, the share of fertilizers in total production costs increased from 13% during 1996–2000 to 22% during 2006–2010 for corn farmers so that fertilizers are now the largest share of production costs (Beckman, Borchers, and Jones, Reference Beckman, Borchers and Jones2013).Footnote 3
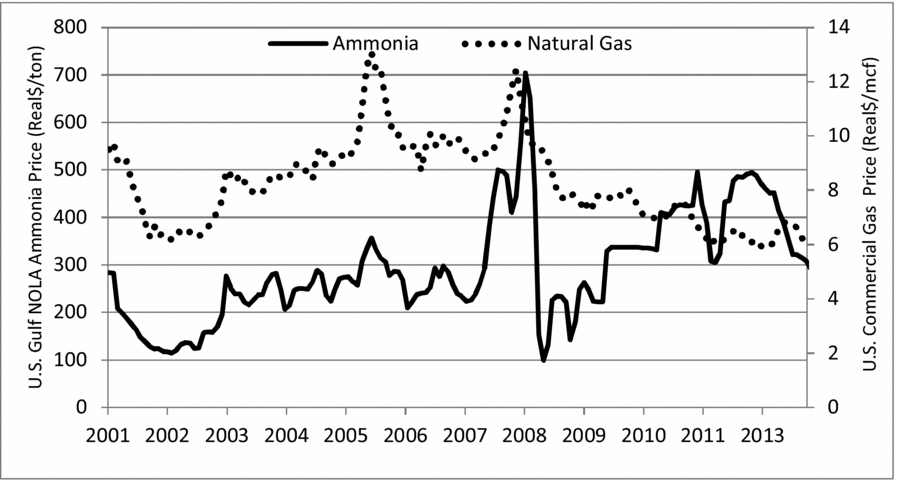
To illustrate how the relationship between natural gas and fertilizer prices has changed, Figure 1 plots prices of natural gas and a heavily used nitrogen fertilizer (ammonia) in real terms since 2001. The two prices appear to move together until around 2008. Both natural gas prices and ammonia prices fell at the end of 2008. However, natural gas prices continued their downward trend, whereas ammonia prices had no such pattern. To further investigate the price movements, we also calculated correlation coefficients for these time periods. The correlation between the two prices over the entire time period was 0.06; however, this is quite deceiving. Taking for reference what appears to be a structural break in 2008, the correlation coefficient from 2001 to 2007 (0.89) was quite different than that from 2008 to 2013 (0.10).

Figure 1. Historical (Real) Natural Gas and Ammonia Prices (Monthly), 2001–2013 (sources: ammonia prices, Green Markets; natural gas prices, U.S. Energy Information Administration, 2014)
The central hypothesis of this work is that there has been a structural change in fertilizer prices such that they now have a close relationship with their demand component (corn prices). Looking at these two price series, Figure 2 indicates that ammonia prices and corn prices do not really seem to track each other, especially until after the start of the biofuel boom in 2007. Indeed, the correlation coefficient for ammonia and corn from 2001 to 2007 indicates that they were in fact weakly related (0.07). It is not until the rapid buildup in commodity prices that the correlation between the two prices becomes much stronger (0.60).

Figure 2. Historical (Real) Corn No.2 Illinois Prices and Ammonia Prices (Monthly), 2001–2011 (source: corn prices, U.S. Department of Agriculture, 2014)
In this article, we implement a framework specifically designed for analyzing the changes in fertilizer price relationships by employing econometric modeling. We estimate an error correction model to better understand the historical relationship of demand- and supply-side changes on fertilizer prices.Footnote 4 We pay particular attention to account for any point of structural change, with the hypothesis that the recent biofuel boom has induced a structural change in the relationship between fertilizer and its supply (natural gas) and demand (corn prices) components. We also utilize a variable that tracks the number of nitrogen fertilizer firms; this variable allows us to better understand whether market power is present in the nitrogen fertilizer industry. Results indicate that market power does exist in the ammonia industry.
2. Literature Review
The strengthening of the relationship between energy and agricultural commodity prices during the biofuels era has elicited a wealth of research.Footnote 5 Several studies (Enders and Holt, Reference Enders and Holt2012; Jin and Kim, Reference Jin and Kim2012; Karali and Power, Reference Karali and Power2013) have focused on better understanding the underlying behavior in price and volatility movements. Along with providing new techniques to estimate these changes, all three articles highlight the importance of accounting for structural change in energy and agricultural commodity time-series data.
Several other studies have utilized time-series econometric techniques, in particular cointegration, to test the joint movement of energy and agricultural commodity prices. For example, Harri, Nalley, and Hudson (Reference Harri, Nalley and Hudson2009) use an error correction model (ECM) to conclude that oil prices are linked to corn, cotton, and soybean prices, but not wheat prices. The time-series analysis of Serra et al. (Reference Serra, Zilberman, Gil, Goodwin, Khanna, Scheffran and Zilberman2010) suggests the existence of a long-term equilibrium relationship between ethanol, corn, and oil prices in the United States. Du and McPhail (Reference Du and McPhail2012) estimate a structural vector autoregression (VAR) model with results showing that ethanol, gasoline, and corn prices are more closely linked in the March 2008–2011 period than the three years before that. They also find evidence of a structural change in their complete data set: March 2005 to March 2011.
In a study most similar to our work, Galbraith (Reference Galbraith2010) utilizes an ECM to examine how specific fertilizer prices at different North American locations adjusted to changes in crop and input prices during two different periods: 2002–2005 and 2006–2009. The different periods are due to the author believing that there was a structural change; however, this is not formally tested. Results from this work indicate that there were asymmetric changes in natural gas–nitrogen price transmission (nitrogen prices adjusted more rapidly to natural gas increases than decreases). The corn–nitrogen price relationship was present only during the 2006–2009 time period versus the earlier time period.
3. Econometric Framework
3.1. Model Formulation
The objective of this study is to better understand how changes to energy and agricultural sectors during the biofuels era have altered the relationship between fertilizers and the supply and demand components. We recognize that using econometrics with time-series data is the most appropriate method for understanding historical changes in fertilizer price relationships.
The time-series methodology we begin with is an ECM, which has the benefit of combining standard time-series methods (incorporating a lag structure) and information from economic theory (that there exists a long-run equilibrium structure among the variables). There are various methods to calculate ECMs, such as the Engle and Granger (Reference Engle and Granger1987) method, the single-equation error correction model (SEECM), and a vector error correction model (VECM). The VECM approach (see Johansen [Reference Johansen1988] or Phillips [Reference Phillips1991]) is appropriate when variables are endogenously determined by each other in a system of equations. Because fertilizers are only a small share of natural gas usage, and corn prices are likely driven more by demand forces (e.g., feed, food, and biofuel demand), we do not use a VECM.
Both the Engle and Granger (Reference Engle and Granger1987) and SEECM models estimate the speed at which the dependent variable returns to equilibrium after a change in the independent variables, and in addition, both provide short- and long-run effects. We utilize the SEECM method rather than the Engle and Granger two-step method because the Engle and Granger method does not clearly distinguish dependent variables from independent variables, as it assumes endogeneity between the variables. There are additional empirical (see De Boef and Keele, Reference De Boef and Keele2008) and theoretical (see Beck, Reference Beck1992) reasons for choosing the single-equation model. The single-equation model does require weak exogeneity, as it requires that the direction of causality between variables is well defined. For an example of recent research that uses an SEECM, Baquedano, Liefert, and Shapouri (Reference Baquedano, Liefert and Shapouri2011) compare market integration for export cash crops versus imported food crops for two countries.
To formulate our ECM, we first have to understand the components of fertilizer prices. Consider that the price of any good is a function of the demand and supply for that good. The demand for a good such as fertilizer is influenced by many factors, such as the price of that good: for this, we note that most agronomic literature and extension services assume that farmers are profit maximizers. Therefore, a decrease in fertilizer prices would likely not induce farmers to use much more fertilizer than is agronomically optimal. An increase in fertilizer prices could possibly lead to lower fertilizer applications; however, farmers must weigh the higher fertilizer price with the lower yields they would receive for using less fertilizer, the price they would receive for their crops (i.e., is it worth using less fertilizer if output prices increased?), and their cropping decisions (perhaps switching to a less intensive fertilizer-demanding crop). The complexity of this decision is beyond the scope of this study, but we do note that the amount of fertilizer applied to corn increased from 277 pounds/acre in 2005 to 284 pounds/acre in 2010 (U.S. Department of Agriculture [USDA], 2013b; Economic Research Service [ERS], 2013), although the price paid by farmers for fertilizer increased from an index of 162 in 2005 to 252 in 2010 (USDA, National Agricultural Statistics Service, 2013).
The price of other goods that are substitutes or complements can also impact demand: land, labor, or capital could be substitutes for fertilizers. However, none of these can provide the specific nutrients that fertilizers provide; thus, substitution among fertilizers and other inputs is quite inelastic or even negative as shown by Debertin, Pagoulatos, and Aoun (Reference Debertin, Pagoulatos and Aoun1990). Changes in tastes or preferences might impacts fertilizers, but for our case, we will assume that ammonia fertilizers do not have any real substitutes in terms of other fertilizers. Finally, the number of buyers in the market can also impact fertilizer demand. The biofuels era has brought about a large increase in corn production, which has translated to an increase in the demand for fertilizer. The fact that fertilizer use has increased in the face of higher prices leads us to believe that this last component of demand might be the most important in the fertilizer price relationship from a “demand” perspective.Footnote 6
The supply of a good is influenced by several components including the price of that good. Changes in the price of other goods that can be produced with the seller's resources can also impact supply; however, fertilizer production is extremely capital-intensive with specific machinery. Thus, it would be difficult to produce any other product. Technology changes are also important; nevertheless, for our time period, we assume that technology is constant. Finally, the other component impacting supply is the price of inputs. Historically, this last factor seems to be very important in U.S. fertilizer production because fertilizers seem to be heavily dependent on natural gas prices. For example, there was a 17% reduction in ammonia supply from 2000 to 2006 due largely to higher and more volatile natural gas prices (Huang, 2007), and natural gas is approximately 70%–80% of fertilizer costs.
Another important aspect is the issue of market power. If a sector is perfectly competitive, then, in a constant marginal cost business, the price of that sector should not depend on the price of a downstream sector. That is, if the ammonia sector is perfectively competitive, then its price should not be influenced by the price of corn (the demand component). The literature (Kim et al., Reference Kim, Taylor, Hallahan and Shaible2001) indicates that fertilizer firms are oligopolies, a market structure in which firms must take into account the reactions of other firms in their pricing strategies. We also test for market power in our models by using two different variables: capacity utilization (i.e., the percentage of nitrogen plants operating based on their rated capacity) and the number of nitrogen fertilizer–producing companies.
To understand how these various components interact with fertilizer prices, we utilize time-series methods to examine the relationship between the three products and include the measures of market power. We estimate an ECM for the entire time series of the form:
 $$\begin{eqnarray}
\Delta {\it ammonia}_{\it t} &=& \alpha \;{\rm + }\;{\it \beta }\Delta {\it gas}_{\it t} + {\it \eta }\Delta {\it corn}_{\it t} + {\it capacity/companies} \nonumber\\
&& + {\it \delta (ammonia}_{{\it t - 1}} - \varphi {\it gas}_{{\it t - 1}} - {\it \tau corn}_{{\it t - 1}} ) + {\rm \varepsilon }_{\it t} {\rm ,}\end{eqnarray}$$
$$\begin{eqnarray}
\Delta {\it ammonia}_{\it t} &=& \alpha \;{\rm + }\;{\it \beta }\Delta {\it gas}_{\it t} + {\it \eta }\Delta {\it corn}_{\it t} + {\it capacity/companies} \nonumber\\
&& + {\it \delta (ammonia}_{{\it t - 1}} - \varphi {\it gas}_{{\it t - 1}} - {\it \tau corn}_{{\it t - 1}} ) + {\rm \varepsilon }_{\it t} {\rm ,}\end{eqnarray}$$where δ is the error correction component. This error-correcting component (ECC) determines the long-run adjustment between two or more variables back to their long-run equilibrium relationship. The coefficients of the explanatory variables outside the parentheses (β and η) measure the short-run effect that a change in an independent variable has on ammonia prices. The coefficients inside the parentheses (φ and τ) measure the long-run effect. Finally, “capacity/companies” represents our measure of market power.
Based on our structural change work, we also estimate models for pre-2008 and post-2008. All statistical tests, however, point to differences in the pre- and postmodels. As will be shown in the results, the pre-2008 data are not cointegrated, indicating that there is no long-run cointegration relationship between fertilizers and the supply and demand components. Therefore, we estimate this series using first differences in a standard linear model.
3.2. Time-Series Model Diagnostics
The first step in any time-series analysis is to determine if the data are stationary or nonstationary. Nonstationary data are not mean reverting, which can lead to incorrect results if not accounted for. There are many tests to examine whether the data are stationary—for example, the augmented Dickey Fuller (ADF), Phillips-Perron (PP; Phillips-Perron, 1988), and Kwiatkowski-Phillips-Schmidt-Shin (KPSS; Kwiatkowski et al., Reference Kwiatkowski, Phillips, Schmidt and Shin1992). The PP test is one of the most widely used tests for stationarity because it makes less restrictive assumptions concerning the error term (than, for instance, the ADF test), allowing for weak dependency and heterogenous distributions and providing robustness to violations of more standard error term assumptions. However, simulation results on the PP's null hypothesis that a series has a unit root have shown problems with low power (as with many other unit-root tests), leading to a higher likelihood of making type II errors (Schmidt and Phillips, Reference Schmidt and Phillips1992). Thus, it is possible that the PP unit-root test could fail to reject the null hypothesis of nonstationarity for series that are actually stationary. For this reason, we compare these test results with those from the KPSS unit-root test that posits a null of no unit root (Kwiatkowski et al., Reference Kwiatkowski, Phillips, Schmidt and Shin1992). Reliability is greatly enhanced if both these unit-root tests give results that are in agreement.
The other aspect that needs to be considered in the estimation of time-series models is the presence of structural breaks, which if ignored can lead to unreliable and inaccurate results. The importance of allowing for structural breaks has been pointed out in the literature. For example, Thirtle, Schimmelpfennig, and Townsend (Reference Thirtle, Schimmelpfennig and Townsend2002) utilize an ECM with structural breaks to test the induced innovation hypothesis for U.S. agriculture. Enders and Holt (Reference Enders and Holt2012) estimate shifting mean autoregressions allowing for structural breaks to identify changing commodity price fundamentals over a 50-year period.
The appropriate test for structural change can vary with the model framework, but Chow's (Reference Chow1960) test has been widely used because it simply splits the sample into two subperiods and applies an F-test of parameter equality. The problem with this approach is that candidate break dates have to be chosen a priori based on a feature of the data or some relevant historical event. Thus, results using these approaches are sensitive to break date search starting points, and multiple breaks compound the problems (Hansen, Reference Hansen2001). The Quandt likelihood ratio (QLR) is a modified version of the Chow test, as the QLR test computes the Chow F-test repeatedly with differing break dates. Using the QLR tests, the structural break point does not have to be specified and can be endogenously determined.
3.3. Data
Data for the econometric models are derived from several sources. Necessary data are natural gas prices obtained from the U.S. Energy Information Administration (2014), for which we utilize the U.S. natural gas price for commercial consumers; ammonia prices in the form of the U.S. Gulf NOLA price, obtained from Green Markets publications; and corn prices (No. 2 yellow, U.S. Central Illinois price) from the ERS (USDA-ERS, 2014). Monthly data from January 2001 to December 2013 for these price series are used. All prices are deflated using the Consumer Price Index from the U.S. Bureau of Labor Statistics (BLS).
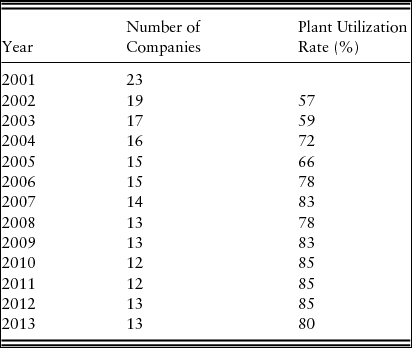
The U.S. Geological Survey (2015) tracks various components of nitrogen fertilizers; this is the source for nitrogen plant utilization and company data. Unfortunately, only annual data are available. Table 1 indicates that the number of nitrogen fertilizer plants has decreased over our time period: in 2001, there were 23 companies, and by 2013, this had fallen to 13. The decrease was especially prevalent from 2001 to 2005 when the number of companies fell by 35%. Figure 1 offers a potential explanation for this. From 2001 to 2002, natural gas and ammonia prices dropped by 34% and 56%, respectively. However, from 2002 to 2005, prices turned upward again, increasing by 94% and 183%, respectively. This double whammy of low prices and then high prices caused many ammonia producers to cease production or to merge with other firms (Huang, 2007). Table 1 indicates that the reduction of nitrogen firms has led to an increase in the nitrogen plant utilization rate. Indeed, the correlation coefficient between the two variables is −0.92 indicating that they are strongly, inversely related.
4. Econometric Results
We begin with testing for structural change and unit roots in the data because not properly dealing with these statistical issues could confound our econometric results. First, we test for structural change in our price series using the QLR test to search for the break date with the largest F-statistic. The results indicate the presence of a structural break occurring in June 2008; this information, plus the suggestion of a structural break in 2008 from Figures 1 and 2 (and the calculated correlations), leads us to split the data (and model) into pre-2008 and post-2008 components.
What might explain this structural break in prices? For the natural gas/fertilizer price relationship, the BLS (2013) notes that there was a 25% increase in natural gas production in the United States from 2007 to 2012, which led to the large decline in natural gas prices (Figure 1). Fertilizer prices fell as well in 2008. However, by 2009 fertilizer prices trended upward, whereas natural gas prices kept falling. Thus, even though natural gas costs comprise approximately 70%–80% of fertilizer production costs (Gellings and Parmenter, Reference Gellings, Parmenter, Gellings and Blok2004), the supply-side link seems to have been weakened. In particular, demand-side pressures helped lead to a new linkage of fertilizer and crop prices. This was especially pronounced for corn. U.S. ethanol production more than doubled from 2007 to 2010, which dramatically increased the demand for corn in the United States (Beckman, Borchers, and Jones, Reference Beckman, Borchers and Jones2013). Corn farmers used 46% of all nitrogen fertilizers in the United States in 2010 (USDA-ERS, 2013a); thus, any increase in the demand for corn would lead to an increase in demand for fertilizers. This effect certainly linked ammonia and corn prices, as evident by the change in correlation coefficient from 0.07 for 2001–2007 to 0.60 for 2008–2013.
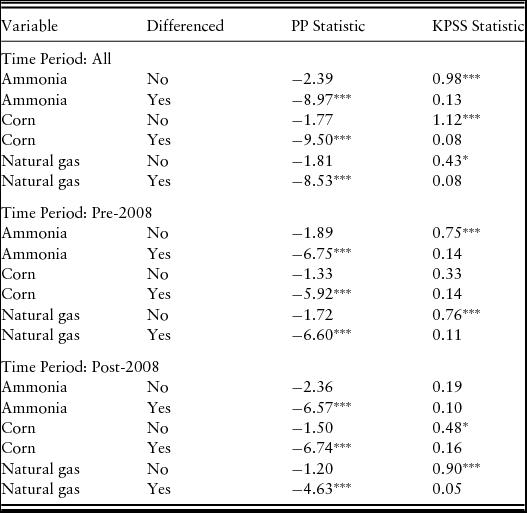
We also need to determine if there is a stochastic component to each of the variables by testing for unit roots. Using both the PP and KPSS tests (Table 2), all three price series are found to be integrated on the order of 1. Because we are splitting our data and model into two components, we also conduct the unit-root tests for each time period. Results are the same: all three series are nonstationary in levels and need to be first-differenced to become stationary.
Table 2. Phillips-Perron (PP) and Kwiatkowski-Phillips-Schmidt-Shin (KPSS) Unit-Root Tests

Notes: Asterisks (***, **, and *) represent rejection of the null hypothesis at the 1%, 5%, and 10% levels, respectively. All variables are estimated with an intercept.
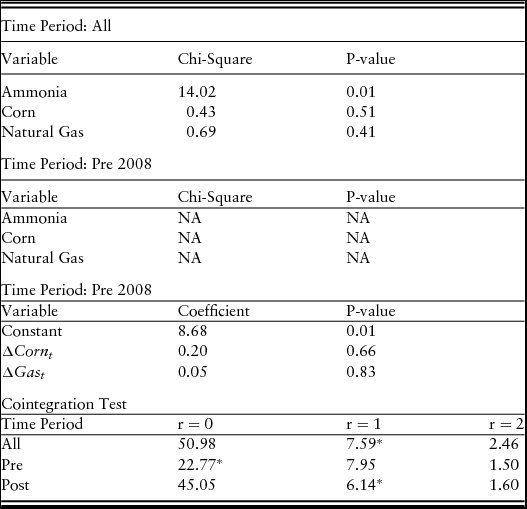
The next step is the test of weak exogenity between the variables, as is required to use the SEECM. The results of the Johansen (Reference Johansen1988) exogenity test indicate (Table 3) that for the full time series, ammonia prices are endogenous to gas and corn prices at the 0.01 significance level, whereas the P values of gas and corn prices suggest that they are exogenous. This is also the case for the post-2008 data. However, the pre-2008 data indicate that none of the variables are endogenous. Next, we have to test if the stochastic trends of the three time series are correlated with each other (i.e., if the series are cointegrated). The Johansen cointegration test estimates the number of cointegrating relationships between a group of variables. If the series are cointegrated, then we can use an ECM. The results from Table 3 indicate that again the full and post time series are cointegrated, with one cointegrating vector. However, the cointegration tests for the pre-2008 data indicate that there are no cointegrating vectors; thus, we cannot represent this data set with an ECM.
Table 3. Model Diagnostics

Note: P-value significance indicates endogeneity at the indicated level. All models were estimated with the same assumption of an intercept.
Note: (*) indicates cointegration. All models estimated with 2 lags and an intercept.
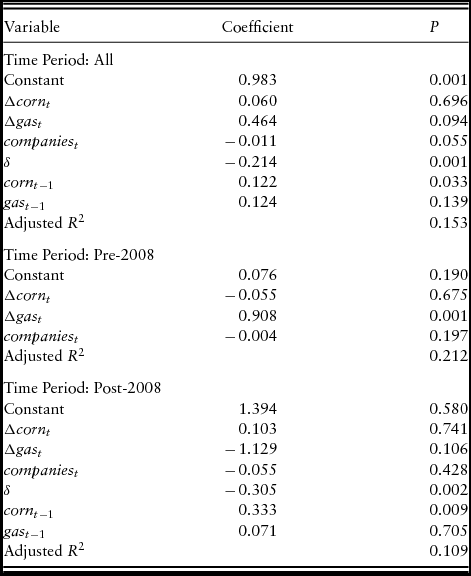
With these pieces in place, we estimate the SEECM for (equation 2), using the full and post time-series data (Table 4). The results of the model using the full data indicate that there is a statistically significant short-term relationship between ammonia prices and natural gas prices at the 10% significance level. The ECC is −0.214, indicating that 21% of any disequilibrium between the prices is corrected through changes in the price of corn and natural gas in the next period. The long-term coefficient for corn is statistically significant at the 1% significance level with the long-term effect for corn prices being −0.03% (−0.214 × 0.122). The P value for the coefficient for natural gas is 0.139, which indicates that we would reject the null hypothesis of a relationship between natural gas and fertilizer prices. Although a P value of 0.139 is close to the 10% significance level, it is a surprising result. Delving further into the results, the outcome for natural gas occurs because of the inclusion of the companies variable. That is, if the companies variable is removed, the long-term coefficient for natural gas becomes statistically significant at the 1% level (and it is negative, as is expected).
Table 4. Model Estimation Results

The result for the companies variable is statistically significant (at the 10% level) and has a negative coefficient. Thus, a decrease in the number of companies will lead to an increase in the differenced ammonia price. A nitrogen plant utilization variable (plant utilization) was also used in the estimation (companies and plant utilization were not included at the same time, in case of possible multicollinearity); however, the results are insignificant. Both companies and plant utilization are measured on an annual basis (and are included in a model with monthly data); thus, it is not surprising that at least one was not statistically significant. However, plant utilization was much more volatile and unpredictable than companies over our time series. For example, utilization was 59% in 2003 when natural gas prices were $8.10/Mcf, 72% in 2004 when natural gas prices were $8.77/Mcf, and 66% in 2005 when natural gas prices averaged $10.28/Mcf. The companies variable has consistently decreased over time.
The results of the model using post–June 2008 data indicate that ammonia prices do not have a statistically significant relationship with natural gas prices (in neither the short nor the long term), as Figure 2 suggests. However, the short-term P value for natural gas prices is 0.106, close to the 10% significance level. Results for the postmodel indicate that the coefficient for corn is 0.103 for the short term, but it is not statistically significant. The ECC is −0.305, a larger magnitude than that for the total period. The estimated long-run coefficient indicates that in the long-run ammonia prices would decrease by 0.10% for each 1% change in the price of corn (−0.305 × 0.333). This is larger than the effect for the model using the entire time series.
The cointegration and exogeneity test results indicate that we do not use an ECM for the pre-2008 data; rather, we use a standard linear model with first differences (equation 2). These results indicate that corn prices do not have a statistically significant relationship with ammonia prices; instead, only the supply-side coefficient is statistically significant. The coefficient for natural gas (Table 4) is 0.908 (i.e., a 1% increase in natural gas prices will increase ammonia prices by 0.91%). Note that the companies variable is not significant in either the pre- or post-2008 data sets.
5. Conclusions
Fertilizers are very important to farming, providing necessary nutrients and boosting crop yields. The recent increase in biofuel production, coupled with large increases in energy prices, brought about large changes to the energy, fertilizer, and agricultural sectors. Although changes to agricultural output prices have received heavy interest in research, the large changes to agricultural input prices have been of less interest. Historically, U.S. fertilizer prices have been largely determined by supply-side forces; however, the recent changes in agriculture have seemingly altered this relationship. Indeed, natural gas prices declined over the past 10 years, whereas fertilizer prices reached record highs in 2008 and have stayed at higher than average levels since then. This change has occurred for a variety of reasons including record natural gas output, a decline in domestic fertilizer production, an increase in global demand for fertilizers, and an increase in the demand for fertilizers by corn producers.
Our results indicate the presence of a structural break in ammonia prices occurring around June 2008. The use of an ECM confirms this result. After 2007, ammonia prices had a strong relationship with corn prices; whereas pre-2008, the only relationship was with natural gas prices. Furthermore, the post-2008 model indicates that ammonia and corn prices have a long-term relationship, but the short-term coefficient is not statistically significant. In addition, our results indicate that a decrease in the number of ammonia fertilizer companies will lead to an increase in the differenced ammonia price (i.e., market power exists).
What remains to be seen is whether fertilizer prices will eventually fall if natural gas prices stay low. Natural gas prices spiked in the beginning of 2014 but ultimately fell by 26% for the year, whereas nitrogen-based fertilizer prices increased by 1% over 2014. The majority of the decrease in natural gas prices in 2014 occurred in the second half of the year, which is after farmers purchase fertilizers. It is possible that the decline in natural gas prices could find its way to fertilizer prices, but could it happen by the time farmers purchase their fertilizer for 2015? Ultimately, it seems as if we are in a new era in which demand-side forces impact fertilizer prices in much the same way as supply-side forces.
This study assumes a closed U.S. economy; however, some of these products are much more global in nature. For natural gas, U.S. natural gas prices were linked with global gas prices in earlier years; however, since 2008, they have been decoupled from oil and therefore from natural gas prices elsewhere in the world. The United States imported 30%–60% of nitrogen fertilizer over the study period, so future work could consider how imported prices might factor into the equations. In addition, U.S. corn is traded globally, so it is not just domestic U.S. supply and demand factors that matter, but also global supply and demand.


