Introduction
Increasing world population has resulted in increased demand in agricultural production such as food input, crop production and livestock farming. Every year, more agricultural waste contributes significantly to feedstock availability in biogas installations across Europe, with over 64% of the feedstock/substrates coming from agricultural residues. Livestock farming has witnessed an intensive growth to meet up with the demand of the growing human population across Europe and around the world. Livestock contributes approximately 40% of the global value of agricultural products, providing livelihoods and food security for almost 1.3 billion people worldwide (Różyło and Bohacz, Reference Różyło and Bohacz2020). This has led to a higher proportion of livestock waste needed to be recycled and utilized sustainably. One of such researched and sustained ways of agricultural waste utilization are biogas production and the fertilization practices of digestates. The resulting treated or recycled waste produces digestates that are on the increase yearly, hence the need to find sustainable methods to utilize the digestates.
Digestates are the products obtained from the anaerobic digestion of waste; animal waste inclusive. They have been found useful and beneficial to agricultural lands, by providing higher proportions of mineralized plant-available nutrients than the untreated manure and since digestion results in a significant odour reduction (Insam et al., Reference Insam, Gómez-Brandón and Ascher2015). The content of plant macronutrients, micronutrients and organic components in the digestate depends on the origin of the ongoing substrate and the management of the digestion process. The low environmental impacts and improved crop yields have encouraged the use of recycled organic waste such as slurries and manure as an alternative to chemical fertilizers (Alburquerque et al., Reference Alburquerque, de la Fuente and Bernal2012). The proportion of ammonium is generally higher in digestate than in the organic substrate going into the anaerobic digestion process (Risberg et al., Reference Risberg, Cederlund, Pell, Arthurson and Schnürer2017) aside from the lesser variation in the nutritional composition of digestates owing to anaerobic treatment gives an advantage.
The agricultural sector is an essential source of greenhouse gas (GHG) emissions, in particular, N2O and CH4, which generates about one-fifth, or up to 6.1 Gt CO2 eq. of all annual emissions (Lewis and Lewis, Reference Lewis and Lewis2018). In Lithuania, agriculture is one of the main drivers of the economy and GHG emissions from the agricultural sector is only slightly lower than those from the transport sector and in 2017 they totalled 4.4 Mt CO2 eq. EEA Report No 17. 2018 ). In a bid to create a win-win solution in creating a sustainable ecosystem, studies are necessary to evaluate the use of nature-based sources such as digestates to reduce GHG emissions without reducing agricultural productivity and competitiveness. Anthropogenic emissions of GHGs, particularly carbon dioxide (CO2), methane (CH4) and nitrous oxide (N2O), have increasingly become significant contributors to global climate change (Lavoie et al., Reference Lavoie, Kellman and Risk2013). GHG emissions, most importantly, CO2, N2O and CH4, are influenced by the combination of soil factors, plant-nutrient uptake and microbial activities in the soil. The soil being a natural CO2 sink is often involved in the release of CO2 into the atmosphere by organic matter transformation through the breakdown of complex carbon compounds and soil respiration. Nitrous oxide is mainly produced by nitrification under aerobic conditions and denitrification under anaerobic conditions as fertilization is one of the most critical factors controlling N2O emissions (Lavoie et al., Reference Lavoie, Kellman and Risk2013). The most significant contributions to CH4 emissions are enteric fermentation and manure management with minor contributions from rice paddies and agricultural burning (Johnson et al., Reference Johnson, Franzluebbers, Weyers and Reicosky2007). CH4 emissions are related to the anaerobic conditions through the actions of methanogens resulting in most available data being focused on wetlands that represent the primary source of CH4 from soils (Verdi et al., Reference Verdi, Mancini, Ljubojevic, Orlandini and Dalla Marta2018a).
The proper management of digestate through their application to agricultural field plays essential roles in the real GHGs impact reduction. Studies have indicated contributing factors such as dry matter content and C : N ratio plays unique roles in the biochemical and biological pathways that result in GHG emission (Oertel et al., Reference Oertel, Matschullat, Zurba, Zimmermann and Erasmi2016). Several studies have confirmed the significance and role of nitrogen from inorganic fertilizers in GHG emission (Holly et al., Reference Holly, Larson, Powell, Ruark and Aguirre-Villegas2017; Brenzinger et al., Reference Brenzinger, Drost, Korthals and Bodelier2018). Aside from the management of digestates application to reduce GHGs impact, the influence of the different types of digestates on GHG emissions through its composition and the make-up of the various available digestates are inadequate. There is a need to evaluate the pollution risk and associated climate change with the use of different animal waste-based digestate.
The objective of this study is to evaluate the influence of agricultural resources through animal waste-based digestate on GHG emissions from agricultural soils. It was hypothesized that the application of different types of animal waste digestate would reduce the emissions of GHG compared to synthetic nitrogen fertilizer in the soil.
Material and methods
Experimental site
The experimental study was carried out in the fields of Lithuania Research Centre for Agriculture and Forestry (55°40′N, 23°87′E) during the 2018 and 2019 growing seasons. The soil of the experimental fields was Endocalcari-Epihypogleyic Cambisol and the chemical composition at a depth of 0–20 cm as shown in Table 1. The experiment was set with spring wheat (Triticum aestivun L.) in 2018 and 2019, respectively. The spring wheat is of Collada variety sown at a seed rate of 270 kg/ha. The cultivation period was from April to September for both years.
Table 1. Selected physio-chemical properties of the soil (0–20 cm layer)

P2O5, phosphorus pentoxide; K2O, potassium oxide; C, carbon; Ca, calcium; Mg, magnesium; N, nitrogen.
Experimental design
The field experiment was established in three replicates in a complete randomized design with five treatments. Each treatment plot was 30 m2 (3 m×10 m). The experimental treatments were as follows: unfertilized (control), fertilized with the synthetic nitrogen fertilizer, pig manure digestate, chicken manure digestate and cow manure digestate. The 170 kg N/ha presented in the liquid form of the digestates were split fertilized at an application rate of 90 and 80 kg N/ha.
Gas sampling and flux calculation
The fluxes were measured by the static chamber-gas and measured using gas chromatography technique (Kanerva et al., Reference Kanerva, Regina, Rämö, Ojanperä and Manninen2007; Zhang et al., Reference Zhang, Li, Chang, Qin, Fu and Jiang2015) with slight modifications. The chamber base box (frame) has a U-shaped groove (50 mm wide and 50 mm deep) at the top edge to hold a removable chamber box.
The frames made from stainless steel were permanently installed in the ground, 20 cm deep into the soil. The area enclosed by the frame was 0.168 m2. For each flux measurement, the chamber was closed for 3 min and the gas samples were taken in 20 ml by volume using a well-sealed 20 cc syringe. The gas samples were taken in the morning between the time interval of 9.00 a.m.–10.00 a.m. to improve the consistency of gaseous flux estimations. The gas samples were collected in glass vials with rubber tubing as the lid. The fluxes of CO2, N2O and CH4 were measured at 2 weeks interval from the start of the cultivating season (4 weeks before the start of digestate application) to the next 2 months after harvest. Gas samples were taken from each plot, each treatment had three replicates. The samples were analysed with a gas chromatograph (HP 6890 Series, GC System, Hewlett, wPackard, USA) equipped with flame ionization (FID) and electron capture detectors (ECD) and nickel catalyst for converting CO2 to CH4. The temperatures of the GC oven, FID and ECD were 70, 300 and 350°C, respectively. The gas chromatography procedures were as described by Kanerva et al. (Reference Kanerva, Regina, Rämö, Ojanperä and Manninen2007). The cumulative flux rates of CO2, N2O and CH4 over the growing seasons of 2018 and 2019 (April to September) were calculated by linear interpolation between the daily fluxes (Ussiri et al., Reference Ussiri, Lal and Jarecki2009). The flux rate of each GHG was calculated based on the rate of change in GHG concentration within the chamber, estimated as the slope of the linear regression between the GHG concentration and gas sampling time.
The mean annual temperature and precipitation for the 2 years of study at the site were obtained from the Institute meteorological station stationed in Dotnuva, Lithuania (Fig. 1).

Fig. 1. Colour online. Monthly average temperature (°C) and precipitation (mm) in 2018 and 2019 for the study period. 1, 2, 3 – represent the average temperature and precipitation taken in 10 days.
Determination of soil physio-chemical properties and digestate chemical composition
The soil samples were collected at the beginning of the experiment from the depth of 0–20 cm. The selected physio-chemical properties of the soil sampled from the field at the beginning of the field trial were determined (Table 1) and the volumetric water content of the soil was measured at 5 cm depth with a portable sensor HH2 WET (Delta-T devices Ltd, England).
The digestates were obtained from industrial sources at three locations in Lithuania with the treatments used serving as their primary feedstocks. The digestates were spread on the soil surface without injection on the treatment plots. For each digestate application, the rate of digestate was calculated according to its content of total nitrogen. The chemical composition of the digestates applied for the 2 years was analysed with the results presented in Table 2 and the digestates were split-fertilized at 90 and 80 kg N/ha for both years.
Table 2. Digestate physio-chemical parameters

P2O5, phosphorus pentoxide; K2O, potassium oxide.
Statistical and numerical analyses
The observed data were statistically processed using SAS 9.4 software. Turkey's test was applied to determine significant differences between means at an α level of 0.05 to determine the effects of the treatments on CO2, N2O and CH4 emissions.
Results
Carbon dioxide emissions
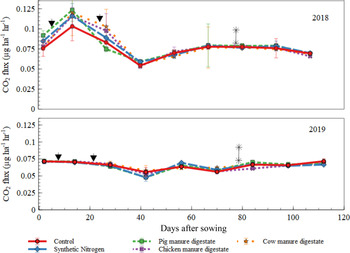
The study indicated that CO2 emissions increased immediately after digestate application. The CO2 emissions varied for both years with higher emissions observed in 2018 compared to 2019. Daily emission rates in 2018 ranged from the lowest flux in control at 0.0543 μg/ha/h to a daily peak of 0.1237 μg/ha/h observed in pig manure digestate. For 2019, the lowest daily emission rate of 0.0479 μg/ha/h was found in pig manure digestate at day 42 with the highest daily CO2 emissions rate of 0.0719 μg/ha/h observed in pig manure digestate and control treatment (Fig. 2). Pig manure digestate treatment had a significant effect on CO2 emissions at day 14 and day 28 compared with other treatments in 2018 (Supplemental Table 1). For 2019, there were significant differences in CO2 emissions on day 14, 28, 56 and 84 between the treatments (Supplemental Table 1). Both years witnessed the most declines in CO2 emissions after day 40 of cultivation. After the second fertilization rate for both years, decrease in CO2 emissions was observed for all the treatments, with daily CO2 emission rates flattening out in 2018 from post-harvest to the end of the cultivation period. In contrast to 2019, after the initial drop in CO2 emissions, there were peak variations in CO2 emissions with pig manure digestate and synthetic nitrogen fertilizer having the highest CO2 emission peaks. The irregular peak patterns observed in 2019 signified the consistent release of CO2. There were no significant differences (P < 0.05) between the treatments on cumulative CO2 emissions between the treatments for both years (Supplemental Table 4). The cumulative CO2 emission over 120 days was significantly higher in the chicken manure digestate and cow manure digestate in 2018 and 2019, respectively (P < 0.05).

Fig. 2. Colour online. Daily CO2 emission trend. ▾ Represents first and second digestate application at 90 and 80 kg N/ha; **indicates after harvest.
Methane emissions
Daily fluxes of CH4 during the study period were significantly higher in 2018 compared to 2019 as the daily emission rates of CH4 ranged between 0.000107 and 0.000115 μg/ha/h and 0.000104 and 0.000115 μg/ha/h in 2018 and 2019, respectively (Fig. 3). The highest value was obtained in cow manure digestate on day 40 and lowest in control on day 56 for the year 2018. The highest CH4 emission in 2019 was observed in synthetic nitrogen fertilizer on day 70 with peaks of 0.0001153 CH4 μg/ha/h in 2018 and lowest in pig manure digestate at 0.000104 μg/ha/h after post-harvest to the end of the experiment. There were no clear patterns in the CH4 emissions over the cultivation period for both years indicating CH4 oxidation and production. The inconsistent emission peaks occurring after the second fertilization and post-harvest showed an irregular pattern. In 2018, emissions dropped sharply after the first and second fertilization with a peak occurring after that in contrast to the cultivation in 2019, where CH4 emission peaks were observed in all the treatments after the first fertilization application followed by a slight decline in CH4 emissions after the second fertilization. There were significant differences (P < 0.05) in the daily CH4 emissions between the treatments on day 42 and day 56 in 2018 (Supplemental Table 2). For 2019, only the measurements of day 84 showed significant differences between the treatments (P < 0.05). The cumulative CH4 emissions over the 120 days were negligible in all treatments with no significant influence (P < 0.05) between the treatments (Supplemental Table 4).

Fig. 3. Colour online. Daily CH4 emission trend. ▾ Represents first and second digestate application at 90 and 80 kg N/ha; **indicates after harvest.
Nitrous oxide emissions
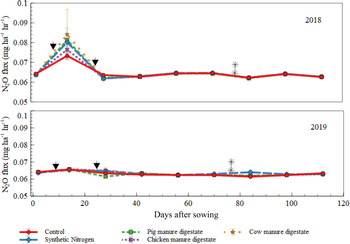
For all treatments, N2O emissions were generally low. N2O was released after the first fertilization for both years reaching a peak after 15 days with the highest peak emission observed in chicken manure digestate in 2018 and cow manure digestate in 2019 with fluxes of 0.086 and 0.065 N2O mg/ha/h, respectively (Fig. 4). On day 28 of the 2018 cultivation year, cow manure digestate had a significant effect (P < 0.05) on N2O emission compared with other treatments, while for other measurement days, the treatments had no significant effect on N2O emission rate (Supplemental Table 3). Emission rates regularly decreased to the background emission level after the first fertilization application in 2018 till after the end of the growing season. For 2019, a consistent decrease was observed in the emission rates for all treatments after the second fertilization rate except for synthetic nitrogen fertilizer, which peaked slightly at day 65 before decreasing towards the end of the cultivation period. We further observed that between days 70 and 85, the N2O emission rates from the synthetic nitrogen fertilizer were higher than from the other treatments and ranged from 0.062 to 0.063 N2O mg/ha/h in 2019. The N2O emission rate at day 70 and day 98 in 2019 was significantly higher in synthetic nitrogen fertilizer from the other treatments (P < 0.05). Treatments had no significant effect on the cumulative N2O emissions over the 120 days (P < 0.05) between the treatments (Supplemental Table 4).

Fig. 4. Colour online. Daily N2O emission trend. ▾ Represents first and second digesate application at 90 and 80 kg N/ha; **indicates after harvest.
Soil moisture influence on N2O, CH4 and CO2 fluxes
CO2 emissions in 2018 were relatively stable with the highest CO2 production detected after digestate fertilization with soil moisture at 10.8% (Fig. 5a). Emissions from the soil applied with cow manure digestate were the highest at 0.004081 μg/ha/h when soil moisture increased. The lowest CO2 flux was observed in cow manure digestate followed by pig manure digestate when soil moisture was lowest at 5.7%. For 2019, CO2 flux was relatively stable in response to moderate soil moisture contents ranging from 13.0 to 14.59% in the cultivation year.

Fig. 5. Colour online. (a) CO2 emissions in digestates less synthetic nitrogen fertilizer. (b) N2O emissions in digestates less synthetic nitrogen fertilizer. (c) CH4 emissions in digestates less synthetic nitrogen fertilizer.
N2O fluxes decreased in most of the 2018 cultivation period occasioned by lower soil moisture after digestate fertilization (Fig. 5b). Emission from the soil applied with pig manure digestate was highest at 0.00115 μg/ha/h when soil moisture increased to 10.8%. The soil served as N2O source as the cultivation season progressed with a relatively low and stable N2O emission. CH4 flux was lower as increased soil moisture did not positively influence CH4 emissions (Fig. 5c). The increased soil moisture of 10.5% resulted in emissions in pig and chicken manure digestate.
Global warming potential
The global warming potential (GWP) showed no significant differences between the treatments (P < 0.05) shown in Supplemental Table 4. However, the emission of N2O was a major contributor to GHG emissions in this study. In assessing the impact of GHG-related emissions in agriculture on global climate change, the GWP from soil CO2, CH4 and N2O emissions in a 100-year time frame was assessed as CO2-equivalent emissions (kg/ha/y) by multiplying emissions by their respective GWPs: 298 for N2O and 25 for CH4 (IPCC, 2007) (Lewis and Lewis, Reference Lewis and Lewis2018).
Discussion
Carbon dioxide emissions
The emission of CO2 increased after the application of the digestates in both cultivation years. The increased CO2 emission affirmed the reports of other studies (Pampillon-Gonzalez et al., Reference Pampillón-González, Luna-Guido, Ruíz-Valdiviezo, Franco-Hernández, Fernández-Luqueño, Paredes-López, Hernández and Dendooven2017; Czubaszek and Wysocka-czubaszek, Reference Czubaszek and Wysocka-czubaszek2018) of the digestates having enough degradable organic material despite the fermentation of organic residues during the digestion process and at the onset of the experiment. The easily decomposable organic material in the digestate served as the required substrate for soil microorganisms, thereby increasing the CO2 production. The higher organic matter content as observed in the digestates (Table 2) increases soil microbial activities and which had a positive influence on soil respiration and consequently CO2 emissions. The influence of organic matter content also followed reports by Verdi et al. (Reference Verdi, Mancini, Ljubojevic, Orlandini and Marta2018b) where higher CO2 emissions were observed in the digestates compared with mineral N possibly due to digestate composition and optimum soil moisture conditions which allowed the infiltration into the soil. The probable reason for the increased CO2 emission was the enrichment of water content of soil combined with the mild air temperatures that occurred, which encouraged the proliferation of soil microorganisms and consequentially soil respiration (Verdi et al., Reference Verdi, Mancini, Ljubojevic, Orlandini and Marta2018b). Soil moisture positively correlated with CO2 emission, which explained the slight increase in emissions observed 40 days after digestate application. The subsequent decline of CO2 emissions could further be explained by the dry weather conditions, most notably the soil temperature. Kanerva et al. (Reference Kanerva, Regina, Rämö, Ojanperä and Manninen2007) reported that soil CO2 corresponds to temperature and soil moisture, which usually reduces soil CO2 fluxes. The soil under pig digestate treatment had consistently higher CO2 emission in comparison to the other digestates. Pig manure produced higher CO2 emissions than the other two digestates after the first digestate application at 28 days of spring wheat cultivation while other digestates witnessed a considerable drop in emissions after post-harvest. This is explained by the consistent release of CO2 in pig manure digestate, indicating a higher organic carbon content that allows microbial metabolism in the soil. The stable CO2 fluxes that occurred after the second year of digestate application can best describe the effect of the digestate treatments on the GHG concentration and emissions. All the digestates had reduced cumulative CO2 emissions of over 30% from the preceding year except for cow manure digestate of just about 18% increase in carbon release.
Methane emissions
The application of the different types of digestates did not stimulate CH4 emissions significantly compared to synthetic nitrogen fertilizer. The peaks observed in CH4 emissions for both years corresponded to when precipitation was highest (Fig. 1). Precipitation tends to fill soil, creating an anaerobic condition that allows for the small build-up of CH4 that diffuses in the shortest time. This partly explains the irregular peak patterns for both years. The volatilization of dissolved CH4 produced before application in the course of storage of the digestates could explain the emissions peak after digestate application as affirmed by Sommer et al. (Reference Sommer, Sherlock and Khan1996). Also, the anaerobic microbes in the digestate might encourage methanogenesis at the initial stage of digestate application, hence giving room to the peak observed as previously reported by Wulf et al. (Reference Wulf, Maeting and Clemens2002). Emissions for both years were negligible resulting from the rapid decline of the content of volatile fatty acids in the digestates used in the field as reported by Sommer et al. (Reference Sommer, Sherlock and Khan1996) and the rapid depletion of oxygen that could adversely affect the process of methanogenesis (Chadwick et al., Reference Chadwick, Pain and Brookman2000; Czubaszek and Wysocka-czubaszek, Reference Czubaszek and Wysocka-czubaszek2018). Measurement of emissions at post-harvest showed that CH4 emissions were still occurring but declining after harvest.
Nitrous oxide emissions
The lower N2O emissions observed for both years were expected as, the more stable carbon from the easily degradable carbon during the digestion process were more difficult to be degraded by the microbes; thus, less adequate to stimulate denitrification, which has been reported in previous studies (Vallejo et al., Reference Vallejo, Skiba, Garciatorres, Arce, Lopezfernandez and Sanchezmartin2006; Crolla et al., Reference Crolla, Kinsley, Pattey, Arthur, Jerry and David2013). The initial N2O emissions observed after the first fertilization rate are explained by many contributing factors. Askri et al. (Reference Askri, Laville, Trémier and Houot2016) and Sherlock et al. (Reference Sherlock, Sommer, Khan, Wood, Guertal, Freney, Dawson and Cameron2002) had previously reported the initial peak in N2O emission occurred during a period of active nitrification. Peak emissions result from the nitrification of NH4 from the digestates as well as by the denitrification of the resulting NO3. Production of N2O in the soil is a by-product of the oxidation of NH4+ to NO2− and NO2− to NO3− under aerobic conditions (nitrification) and the result of anaerobic reduction of NO3− (Ruíz-Valdiviezo et al., Reference Ruíz-Valdiviezo, Luna-Guido, Galzy, Gutiérrez-Miceli and Dendooven2010). N2O fluxes after the first stage of fertilization were due to the liquid state of the digestates. This aligns with the observation of Wulf et al. (Reference Wulf, Maeting and Clemens2002) that reported that high water content of digestate enables anaerobic conditions with consequent higher N2O losses. Emissions decreased and flattened out towards the end of the 2018 and 2019 cultivation season which could be related to the soil N concentrations as other studies have reported similar trends (Vallejo et al., Reference Vallejo, Skiba, Garciatorres, Arce, Lopezfernandez and Sanchezmartin2006; Kanerva et al., Reference Kanerva, Regina, Rämö, Ojanperä and Manninen2007; Alburquerque et al., Reference Alburquerque, de la Fuente and Bernal2012). In the second year of fertilization, pig manure digestate had the highest N2O emission with the attendant possibility that N2O emission increased with increasing soil organic carbon content present in the pig manure digestate and probably due to favourable conditions for denitrification as reported by Wulf et al. (Reference Wulf, Maeting and Clemens2002). Emission pattern was slightly different in the second year of fertilization from the first year as a result of favourable environmental conditions in the second year. The direct contribution from the applied digestates and synthetic nitrogen fertilizer for both years were evaluated by discounting the N2O emitted from the control treatment. For 2018, chicken manure digestate and pig manure digestate accounted for <30% of N2O emissions while synthetic nitrogen fertilizer contributed 43% to N2O emissions with pig manure digestate contributing the least N2O emission with 4.66% of total emissions. These observations suggest that in the additions of organic C in the form of digestates to agricultural soils, a reduced proportion of N2O was emitted. Therefore, organic fertilizers can mitigate the emissions of the N2O when applied to agricultural soil.
Influences of soil moisture on N2O, CH4 and CO2 fluxes
The initial CO2 emissions are encountered after the digestates application which was a result of mineralization of easily decomposable substrates before returning to the background levels (Oertel et al., Reference Oertel, Matschullat, Zurba, Zimmermann and Erasmi2016). This emission could also be supported by increased soil moisture content facilitating increased microbial activities and microbial respiration as soils with less water-filled pore space (WFPS) show higher emissions by nitrification, with a maximum at 20% WFPS as also reported by Da Silva Cardoso et al. (Reference Da Silva Cardoso, Junqueira, Reis and Ruggieri2020). Metzger and Yaron (Reference Metzger and Yaron1987); Gao et al. (Reference Gao, Ju, Su, Meng, Oenema, Christie, Chen and Zhang2014); Oertel et al. (Reference Oertel, Matschullat, Zurba, Zimmermann and Erasmi2016) reported N2O production is optimal around 60% WFPS and lowest when WFPS is below 30%. Lin et al. (Reference Lin, Hernandez-Ramirez, Kryzanowski, Wallace, Grant, Degenhardt, Berger, Lohstraeter and Powers2017) had earlier reported that soil moisture content was the dominant factor driving N2O emission, as this reflects the soil oxygen availability. This possibly explains the negligible N2O emissions reported in the study as N2O-producing bacteria require aerobic conditions. The longer spell of lower soil moisture for the 2 years can significantly reduce soil emissions, in which case the soil may then turn into a net sink for N2O production. It has been widely reported that soils are CH4 sinks under aerobic conditions and correlates positively with soil humidity under anaerobic conditions (Ussiri et al., Reference Ussiri, Lal and Jarecki2009; Gao et al., Reference Gao, Ju, Su, Meng, Oenema, Christie, Chen and Zhang2014; Oertel et al., Reference Oertel, Matschullat, Zurba, Zimmermann and Erasmi2016). The lower soil moisture content inhibited the production of CH4 as methane uptake in soils increases with decreasing soil humidity and the addition of N through the digestates did not influence CH4 production.
Global warming potential
The total GWP for the 2 years showed that there was a decrease in the total GWP in all the treatments in 2019 when compared with 2018. Application of animal waste digestates to agricultural fields may contribute to mitigating global warming as evidenced by the percentage decrease of 4.3 and 3.9% in cow manure digestate and pig manure digestate. The influence of animal waste-based digestate application on GHG emissions and global warming mitigation on a long-term basis is a knowledge gap that should be addressed in the future. Significant differences between short- and long-term influences on digestates application on soil GHG emissions have been reported by Johnson et al. (Reference Johnson, Franzluebbers, Weyers and Reicosky2007); Wei et al. (Reference Wei, Xu-Ri, Liu, Wang and Wang2014); Zhang et al. (Reference Zhang, Li, Chang, Qin, Fu and Jiang2015).
Conclusion
The individual and cumulative GHG emissions from the digestates were low in both years and not significantly affected by the different digestates applied. However, during the experimental period, climatic conditions were unusually dry with warm weather conditions. The low emission of GHG makes the digestates suitable for use as fertilizers for low-emission agricultural waste management in temperate climate conditions. There were no negative environmental impacts arising from GHG emissions with the application of the animal waste-based digestates for the 2 years of study and a longer-term implication of the use of this digestate is a future work that should be explored.
Supplementary material
The supplementary material for this article can be found at https://doi.org/10.1017/S0021859621000319
Financial support
This project has received funding from the Research Council of Lithuania (LMTLT), agreement No. S-SIT-20-5
Conflict of interest
None.
Ethical Standards
Not applicable.