


Introduction
Global population has increased from 2.5 billion in 1950 to 7.6 billion in 2018, and it is estimated to reach 9.8 billion by 2050 (UN/DESA, 2017); in the meantime, agricultural production must double from current levels in order to meet the food demand by then. This increase needs to be concurrently accomplished during rising climatic variability, land, water resources scarcity and economic volatility (FAO 2015, 2021).
Today, cereals represent one of the most important staple foods worldwide, because they largely contribute to the dietary energy supply in all regions. Some of them, like maize, also represent a renewable energy source in substitution to fossil fuel, due to their valuable bio-ethanol production (Vaughan et al., Reference Vaughan, Block, Christensen, Allen and Schmelz2018); hence, there is an increasing demand for maize production.
Production and exports/imports of cereals, including maize, depend strongly on the response of crops to the biotic and abiotic stress, and on the other hand, the rising demand for food production, due to the growing global population, pushes towards an increase of the per hectare yield, together with the development of more resistant varieties, resilient to environmental (climatic) extremes (Vinocur and Altman, Reference Vinocur and Altman2005).
If food industry and the agricultural sector contribute largely to climate change, they are also particularly vulnerable to its effects, with climate change and weather extremes greatly affecting the whole chain from production to consumption (Fróna et al., Reference Fróna, Szenderák and Harangi-Rákos2021; Salika and Riffat, Reference Salika and Riffat2021) and, in general, there is a general consensus among scholars on the fact that climate change represents an important threat to agriculture (IPCC, 2007, 2014, 2021; Mall et al., Reference Mall, Gupta, Sonkar, Dubey, Pandey and Sangwan2017). Moreover, extreme temperature and drought events, which increased in the last decades (Alexander et al., Reference Alexander, Zhang, Peterson, Caesar, Gleason, Klein Tank, Haylock, Collins, Trewin, Rahimzadeh, Tagipour, Rupa Kumar, Revadekar, Griffiths, Vincent, Stephenson, Burn, Aguilar, Brunet, Taylor, New, Zhai, Rusticucci and Vazquez-Aguirre2006; Orlowsky and Seneviratne, Reference Orlowsky and Seneviratne2012; IPCC, 2021), are expected to further increase (Beniston et al., Reference Beniston, Stephenson, Christensen, Ferro, Frei, Goyette, Halsnaes, Holt, Jylhä, Koffi, Palutikof, Schöll, Semmler and Woth2007), with subsequent negative impacts on crop growth (Seneviratne et al., Reference Seneviratne, Nicholls, Easterling, Goodess, Kanae, Kossin, Luo, Marengo, McInnes and Rahimi2012; Gourdji et al., Reference Gourdji, Sibley and Lobell2013; Verdi et al., Reference Verdi, Napoli, Orlandini and Dalla Marta2019; Zampieri et al., Reference Zampieri, Ceglar, Dentener, Dosio, Naumann, van den Berg and Toreti2019).
The study of the effects of weather on agriculture has a long tradition, beginning with ancient river cultures of the Middle East and East (Egypt, Mesopotamia, India and China) where the observations of natural phenomena (river floods, monsoons) were of great importance in terms of agricultural production forecast. In recent decades several studies investigated the correlation among climate change and climate variability and crop production, and the effect of adaptation strategies (Beillouin et al., Reference Beillouin, Schauberger, Bastos, Ciais and Makowski2020; Salinger et al., Reference Salinger, Dalla-Marta, Dalu, Messeri, Baldi, Messeri, Vallorani, Morabito, Orlandini, Altobelli and Verdi2020; Zscheischler et al., Reference Zscheischler, Martius, Westra, Bevacqua, Raymond, Horton, van den Hurk, AghaKouchak, Jézéquel, Mahecha, Maraun, Ramos, Ridder, Thiery and Vignotto2020).
In the case of Spain and Argentina, researchers investigated the effects of heat stress on maize yield, both using crop modelling and performing experiments on irrigated field and imposing controlled heating (Gabaldón-Leal et al., Reference Gabaldón-Leal, Lorite, Mínguez, Lizaso, Dosio, Sanchez and Ruiz-Ramos2015, Reference Gabaldón-Leal, Webber, Otegui, Slafer, Ordóñez, Gaiser, Lorite, Ruiz-Ramos and Ewert2016). Their findings, although limited to the case of irrigated crops, and not applicable to rainfed production, revealed an important yield reduction as a result of the impact of high temperatures, especially when the number of days with maximum air temperature increases and temperatures exceeds the crop-specific high temperature thresholds.
Some authors have also investigated the impacts of climate change on maize in Mexico, which is among the top ten producers of maize in the world (ASERCA, 2018), focusing on the shifting of cultivation areas, to changes in climate conditions (Conde et al., Reference Conde, Liverman, Flores, Ferrer, Araújo, Betancourt, Villareal and Gay1997; Monterroso et al., Reference Monterroso, Conde, Gómez Díaz and Gay2011) and on the impact of climate change on specific native varieties (Mercer and Perales, Reference Mercer and Perales2010; Ureta et al., Reference Ureta, Martínez-Meyer, Perales and Álvarez-Buylla2012). In a more recent paper, Ureta et al. (Reference Ureta, González, Espinosa, Trueba, Piñeyro-Nelson and Álvarez-Buylla2020) have also shown that both, temperature increase and changes in precipitation will have a negative impact on Mexican yield; they have also discussed the effects of irrigation on crop yield showing that irrigated areas are more resilient in terms of yield under climate change scenarios, and, in general, maize production strategies in Mexico need to change in the future to increase resilience.
Looking at the Pampas in central-eastern Argentina, a country which is one of the world largest exporters, Ferreyra et al. (Reference Ferreyra, Podestá, Messina, Letson, Dardanelli, Guevara and Meira2001) analysed the maize production risk associated with ENSO-related climate variability, and found significant implications for the adoption of ENSO forecasts in agriculture, with ENSO being the major large-scale phenomenon impacting crop yield in the region, and, therefore, confirming its long-term prediction to be a useful tool to monitor and predict patterns of crop yield surpluses and deficits (Anderson, Reference Anderson2021).
The response of maize yield to climate variability during the growing phase in the Corn Belt of United States has been widely investigated (Baum et al., Reference Baum, Licht, Huber and Archontoulis2020; Hoffman et al., Reference Hoffman, Kemanian and Forest2020) as well as the adaptation measures adopted (Abendroth et al., Reference Abendroth, Miguez, Castellano, Carter, Messina, Dixon and Hatfield2021). Available literature shows how, for example, planting longer season hybrids that lengthen the grain fill period can present some uncertainties, but also showing how often farmers, aware of the changes in yield due to changes in climate, are prone to adapt, plan and invest in equipment and/or infrastructure.
Certainly, one of the most effective and less costly adaptation measures to contrast the negative effects of climate change on the crop yield, is an accurate crop management, such as an optimization of the planting window (Cirilo and Andrade, Reference Cirilo and Andrade1994; Bassu et al., Reference Bassu, Fumagalli, Toreti, Ceglar, Giunta, Motzo, Zajac and Niemeyer2021): late or early planting can produce a reduction in the yield (Tsimba et al., Reference Tsimba, Edmeades, Millner and Kemp2013a, Reference Tsimba, Edmeades, Millner and Kemp2013b; Bonelli et al., Reference Bonelli, Monzon, Cerrudo, Rizzalli and Andrade2016).
Some of the main large-scale atmospheric features, such as the North Atlantic Oscillation (NAO), Summer North Atlantic Oscillation (SNAO), the Intertropical Front (ITF) and the West African Monsoon (WAM) and their variability on interannual to decadal time scales, have an important impact on the Central Mediterranean climate, and a subsequent effect on summer crop yields in Europe (Moore and Lobell, Reference Moore and Lobell2015; Ceglar et al., Reference Ceglar, Turco, Toreti and Doblas-Reyes2017) and Italy (Dalla Marta et al., Reference Dalla Marta, Grifoni, Mancini, Storchi, Zipoli and Orlandini2010; Salinger et al., Reference Salinger, Dalla-Marta, Dalu, Messeri, Baldi, Messeri, Vallorani, Morabito, Orlandini, Altobelli and Verdi2020).
The climate variability in the Central Mediterranean region is related to these large-scale features, which have, in turn, an impact on the weather types over the Italian peninsula (Hess and Brezowsky, Reference Hess and Brezowsky1952; Lamb, Reference Lamb1972). In this work, we adopt a software package developed in the framework of COST 733 action ‘Harmonization and Applications of Weather Type classification for Europe Regions’, which offers several classification methods (Philipp et al., Reference Philipp, Beck, Huth and Jacobei2014; Huth et al., Reference Huth, Beck and Kucerova2015). The weather type classification used in this study is based on two methods for temperature and precipitation: a method based on principal component analysis (the T-mode PCA obliquely rotated – PCT), and an algorithm for optimizing partitions (simulated annealing – SAN), successfully used in previous works (Messeri et al., Reference Messeri, Morabito, Messeri, Brandani, Petralli, Natali, Grifoni, Crisci, Gensini and Orlandini2015, Reference Messeri, Benedetti, Crisci, Gozzini, Rossi, Vallorani and Maracchi2018; Salinger et al., Reference Salinger, Baldi, Grifoni, Jones, Bartolini, Cecchi, Messeri, Dalla Marta, Orlandini, Dalu and Maracchi2015; Hidalgo and Jougla, Reference Hidalgo and Jougla2018; Manzanas et al., Reference Manzanas, Gutierrrez, Fernandez, Van Meijgard, Calmanti, Magarino, Colfino and Herrera2018; Vallorani et al., Reference Vallorani, Bartolini, Betti, Crisci, Gozzini, Grifoni, Iannuccilli, Messeri, Messeri, Morabito and Maracchi2018).
The aim of our study is focus to investigate the correlation between climate conditions and maize yield, offering an overview of the links between large-scale atmospheric variability and maize yields in the Veneto Region, a large agricultural area in NE Italy, and a more detailed analysis of the links between the circulation regimes and weather types over the country and maize yield. The scheme of the study follows an analogous work carried out for several crops in Tuscany (Salinger et al., Reference Salinger, Dalla-Marta, Dalu, Messeri, Baldi, Messeri, Vallorani, Morabito, Orlandini, Altobelli and Verdi2020) and is organized as follows: first we analyse the fluctuation in large-scale teleconnection indices (NAO, SNAO, ITF, WAM), circulation regimes and weather types that affect climate anomalies in Veneto. Then, we analyse the relationships between the climate variability, expressed in terms of large-scale indices, and maize yields in Veneto, and the effects of circulation regimes and weather types on maize yield. The objective of the study is therefore to evaluate the impact of large-scale circulation regimes, and consequently the weather types that describe the temperature and precipitation anomalies at local scale (Veneto region), on maize yields. The final objective is therefore to provide a useful tool which, with the desirable improvement in the skill of seasonal weather models in the future, can make it possible to estimate maize production even a few months in advance. A similar approach could also be extended to other territories and other species, thus making it possible to choose in advance the species and sowing varieties according to the circulation regimes and weather types foreseen in the following months in which the culture will develop. Results can certainly be used for the improvement of crop prediction models at seasonal scale, as well to better understand if and how specific adaptation measures can be adopted to counteract the effects of climate change on crop yield and quality.
Materials and methods
Indices of large-scale climate variability (NAO, SNAO, WAM and ITF)
SNAO values were obtained from the Hadley Centre, United Kingdom Meteorological Office, whilst NAO values were taken from (https://www.cpc.ncep.noaa.gov/data/teledoc/nao.shtml). WAM index values were used also in Salinger et al. (Reference Salinger, Dalla-Marta, Dalu, Messeri, Baldi, Messeri, Vallorani, Morabito, Orlandini, Altobelli and Verdi2020). ITF index values were taken from NOA Climate Prediction Center (https://www.cpc.ncep.noaa.gov/products/international/itf/itcz.shtml). Then, these large-scale modes were correlated with both weather regimes and maize crop yields in the regions of Veneto.
Weather regimes: Italian weather types (WT)
Veneto has specific climatic characteristics that are the result of the combined action of factors that act at different scales. The region is part of the Po valley, confined between the Alps, the Apennines and the Adriatic Sea and it is characterized by the presence of a vast mountain area with complex orography and of Lake Garda to the west (Fig. 1).
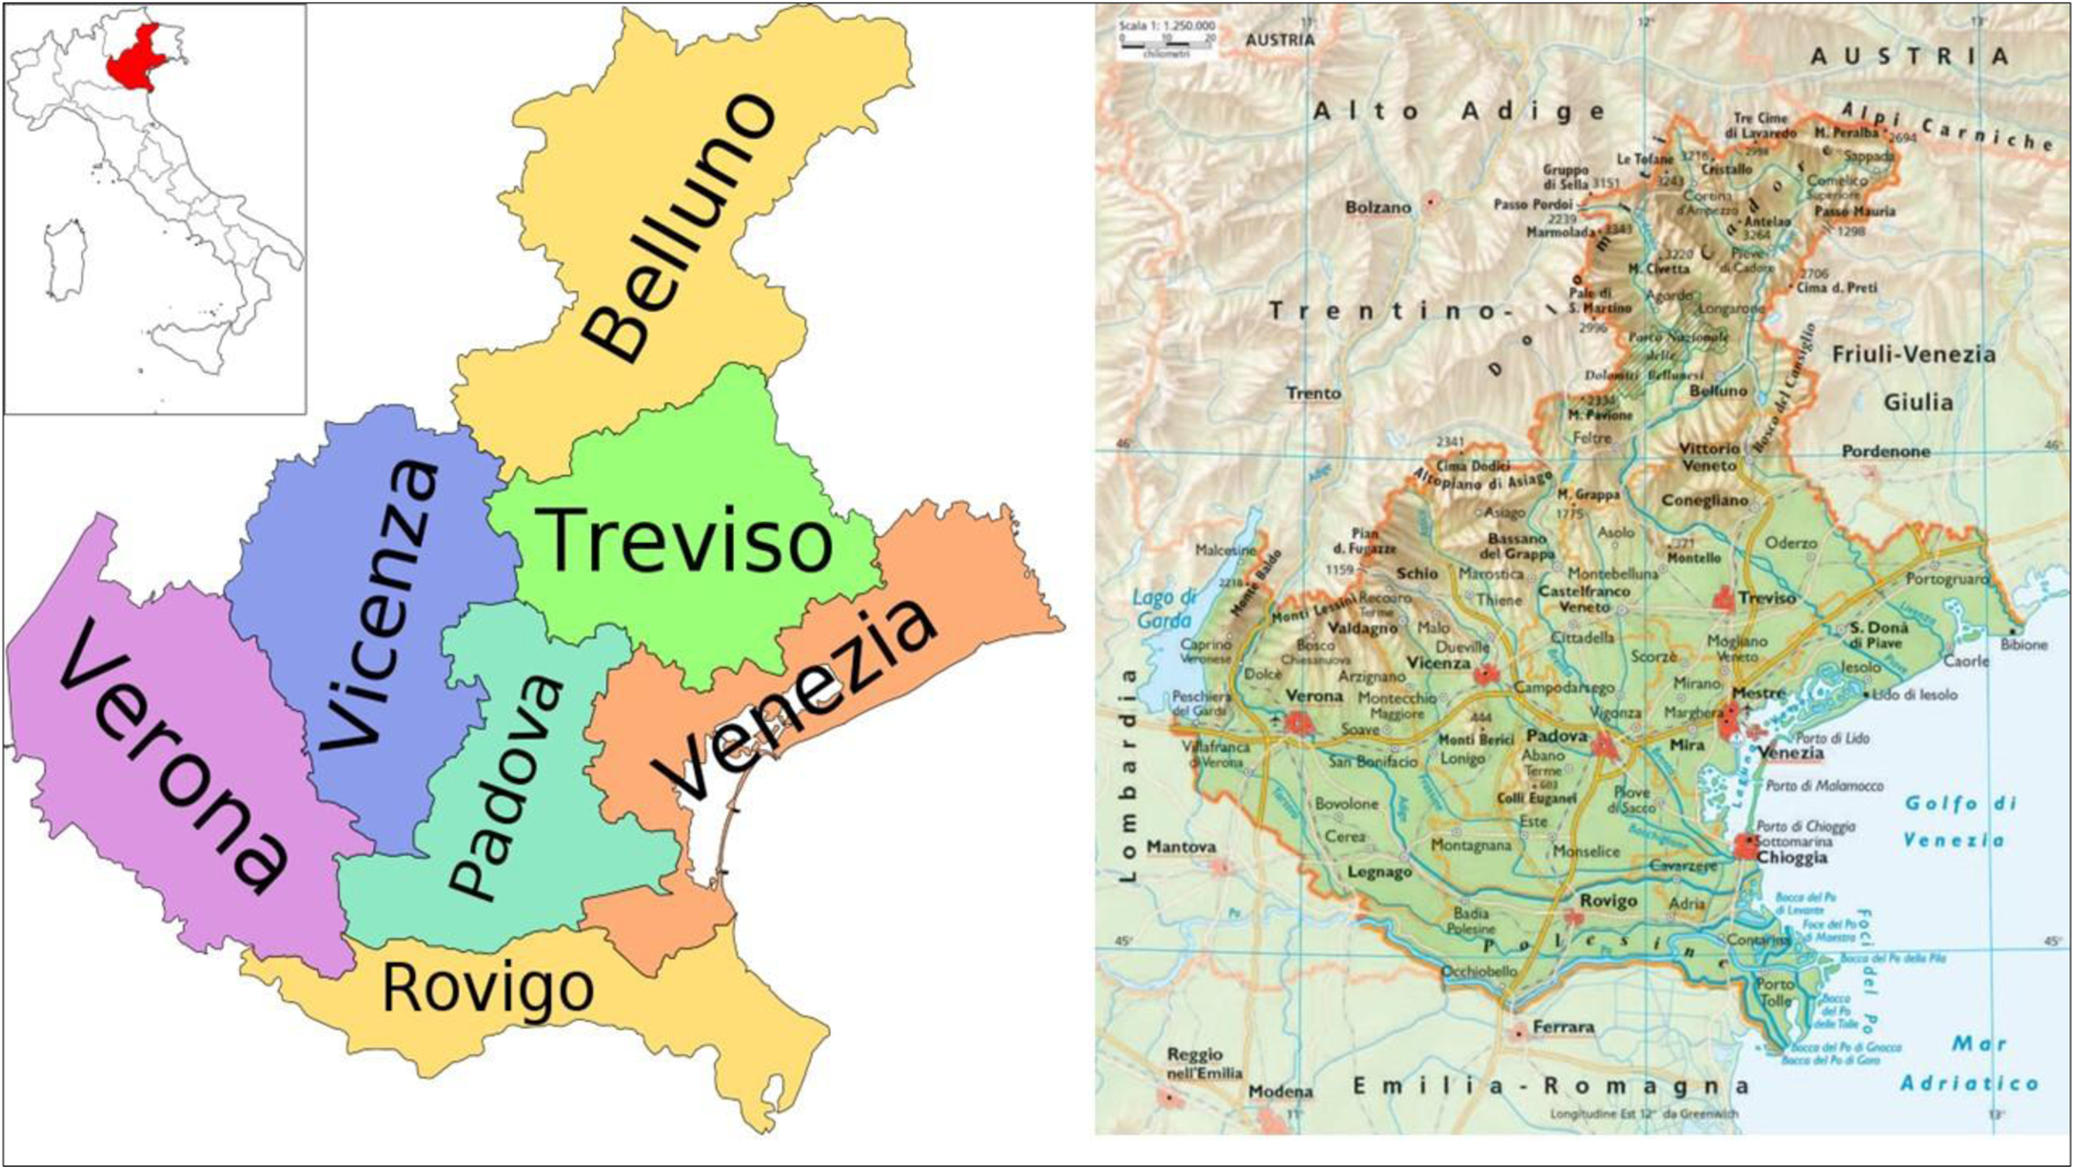
Fig. 1. Colour online. Map of Veneto showing its location, provinces and orography (Source Arpa Veneto www.arpaveneto.it).
Concerning the climatic characteristics, Veneto is located in a transition zone between the Central European area, where the influence of the Western currents predominates, and the South European one, dominated by the action of subtropical and Mediterranean anticyclones that impact on the spatial and temporal distribution of total precipitation Supplementary Figures 1-6. Based on a report of Arpa Veneto (Report Arpa Veneto, www.arpaveneto.it), the average annual precipitation, considering the 1950–2010 observed period, varies from about 670 mm in the southern part of the Region (Province of Rovigo) up to over 2030 mm in the upper Agno valley (Vicenza Prealps). The average annual rainfall trend can be considered increasing from south to north, at least up to the first orographic obstacle constituted by the pre-Alpine belt; from about 700 mm on average per year in Rovigo up to 1200 mm in Bassano del Grappa, in the Vicenza foothills and to 1450 mm in Valdobbiadene, close to the Treviso Pre-Alps.
The plain and hill areas, where maize is concentrated, have annual cumulative precipitations between generally 700 and 1200 mm, up to about 1400 mm in valley close to the Pre-Alps with a positive variation in rainfall moving from west to east along the foothills. The annual period with the highest cumulative rainfall is autumn followed by spring. Also, during summer, Veneto records much precipitation concentrated in the areas close to the pre-Alps. In particular, in autumn and in May precipitation values are close to 100 mm in the south-western provinces and even higher than 150 mm in the areas close to the pre-Alps.
The weather types used in this study are constructed through a sensitivity analysis (Vallorani et al., Reference Vallorani, Bartolini, Betti, Crisci, Gozzini, Grifoni, Iannuccilli, Messeri, Messeri, Morabito and Maracchi2018) to evaluating the best classifications for the Italian territory among all those developed in the context of COST733, in order to best describe the precipitation and surface temperature in Italy. In particular, using the program available online (http://cost733.met.no/) two classifications (one for temperature and one for precipitation) were created with the aim, for each classification to grouping similar configurations in order to maximize the difference between the classes and minimize the infraclass variability.
The Simulated Annealing (SAN) classification method was used for the temperature on nine types of circulation and applied to the geopotential at 500 hPa, while for the precipitation the method is the PCT (principal component transversa), again on nine types of circulation, but applied to the pressure at sea level. The 500 hPa geopotential and pressure fields are extracted from NCEP/NCAR Reanalysis 2 (https://www.esrl.noaa.gov/psd/) data for the period 1979–2015 with a resolution of 2.5° × 2.5°. The Reanalysis are global data of the main atmospheric variables, both at altitude and near the land and sea surface, reconstructed on the basis of observations, satellite data and modelling data, thus constituting a database on a regular grid as close as possible to the reality.
The nine weather types (WT classes), calculated with SAN method for temperature (Fig. 2), and PCT method for precipitation (Fig. 3), were then grouped into three classes of circulation regimes at 500 hPa (cyclonic, blocking and zonal) following what was carried out in Kidson (Reference Kidson2000) and then applied also in Ackerley et al. (Reference Ackerley, Lorrey, Renwick, Phipps, Wagner, Dean, Singarayer, Valdes, Abe-Ouchi, Ohgaito and Jones2011).
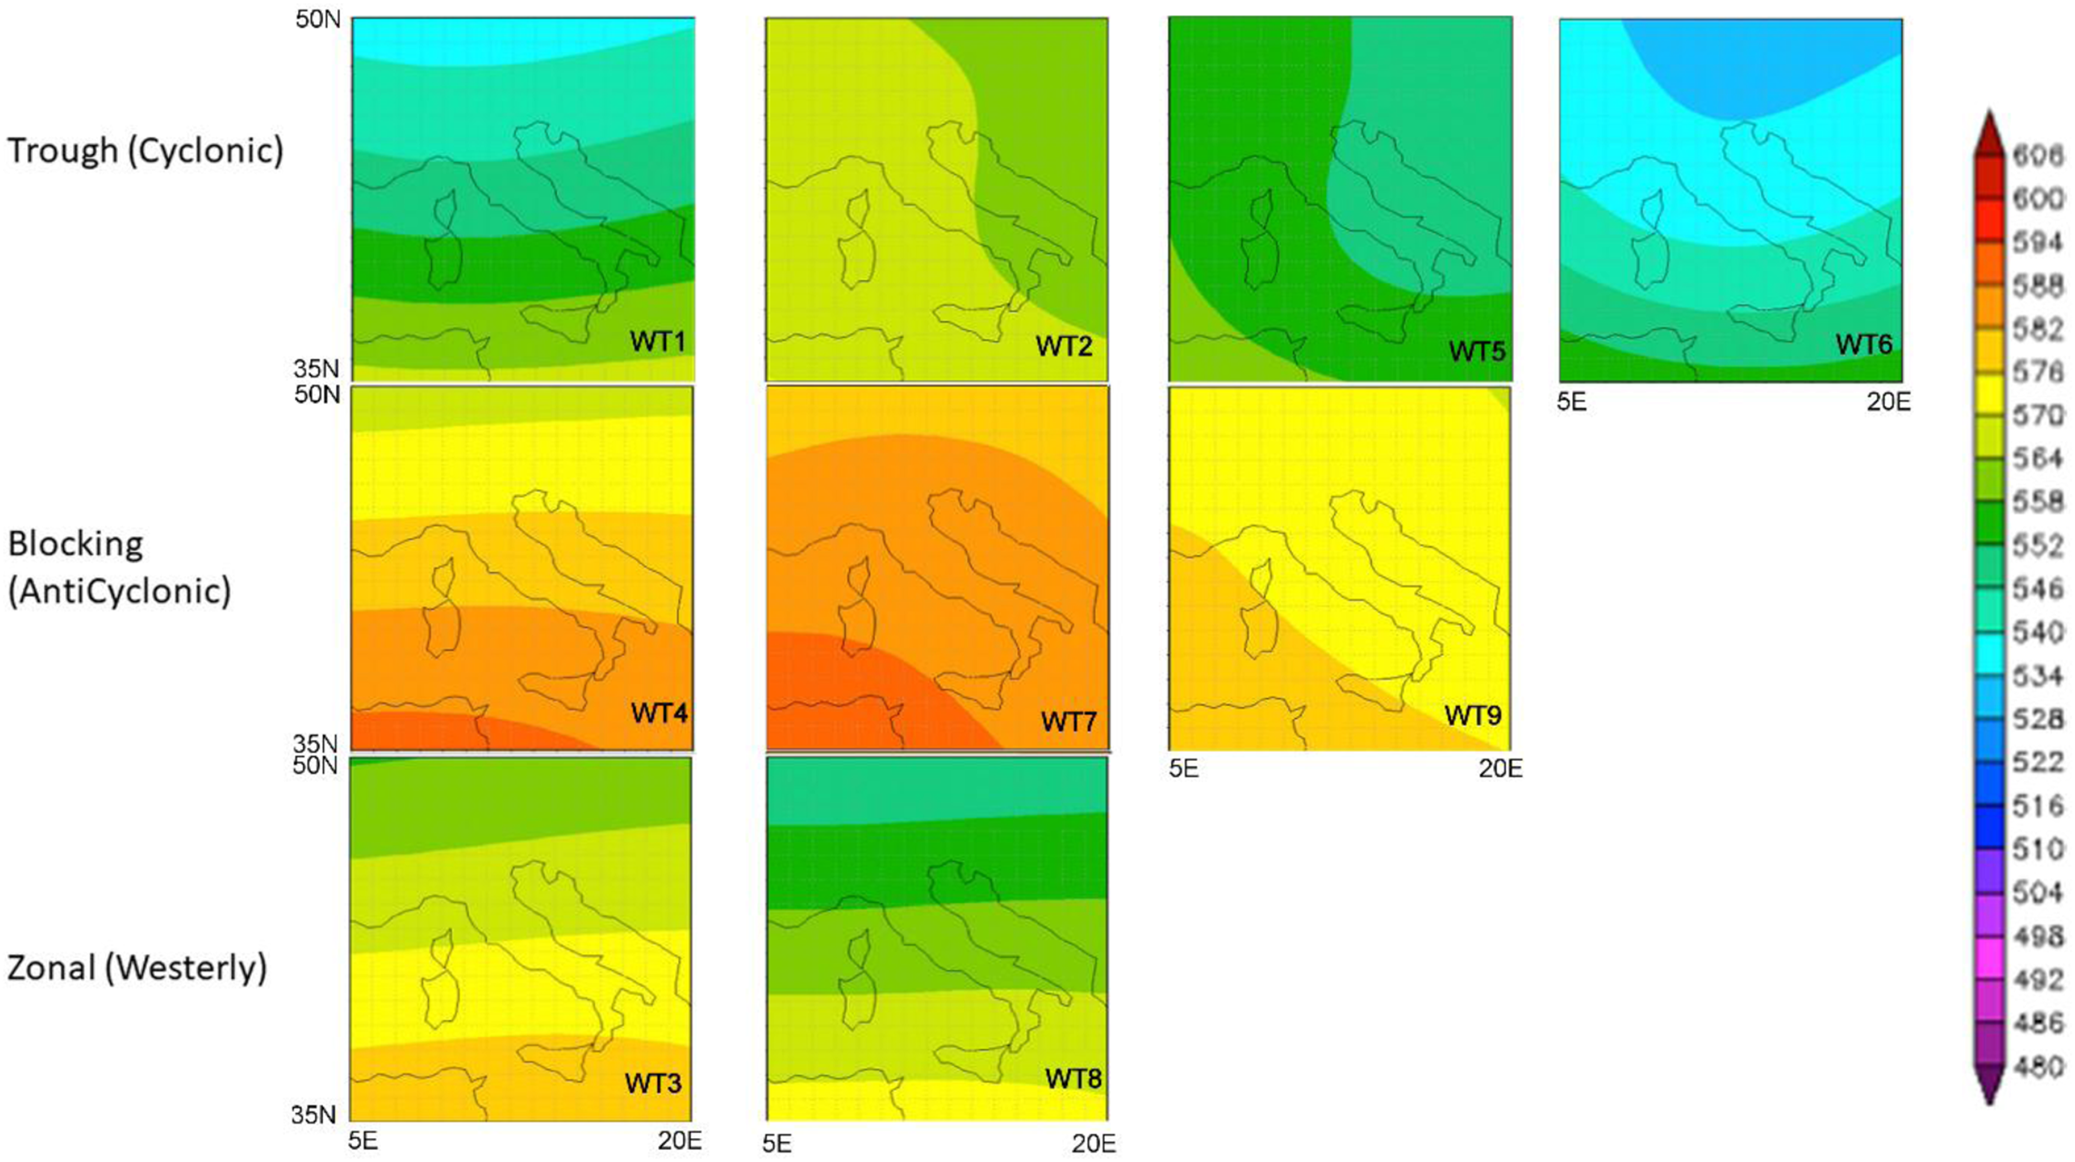
Fig. 2. Colour online. Circulation type classification for Italy based on simulated annealing (SAN) methods, for temperature.
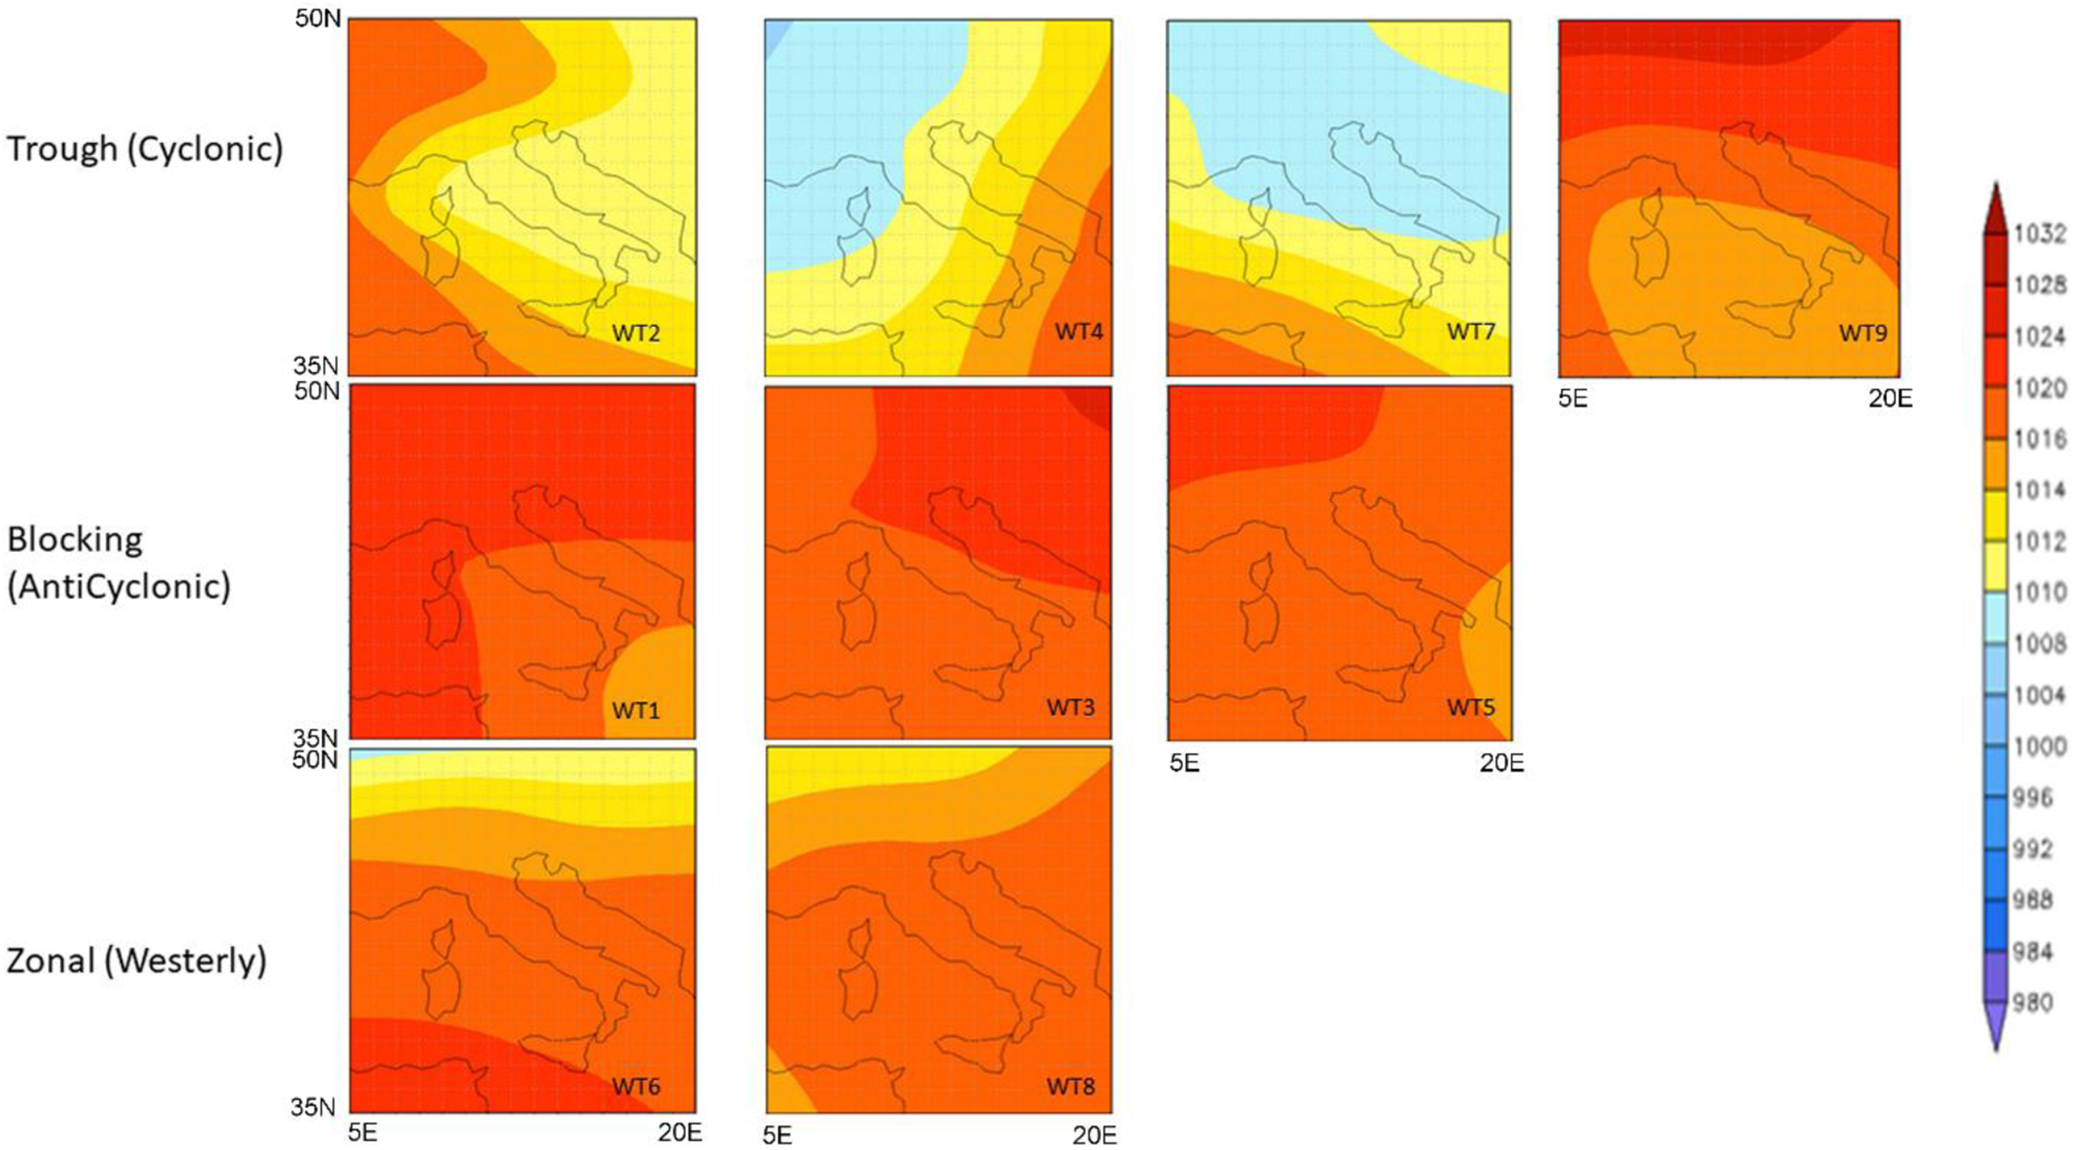
Fig. 3. Colour online. Circulation type classification for Italy based on principal component transversa (PCT) methods for precipitation.
Crop data
The crop information used for the analysis is derived from RICA, the Italian section of the FADN (Farm Accountancy Data Network), a European system of sample surveys conducted annually to collect accountancy data from farms, with the aim of monitoring the income and business activities of EU agricultural holdings. In Italy, the FADN sample selection is made through a stratified random sampling without replacement to represent the different types of farming and economic size of farms throughout the country (http://ec.europa.eu/agriculture/fadn/index_en.htm) (Altobelli et al., Reference Altobelli, Cimino, Natali, Orlandini, Gitz, Meybeck and Dalla Marta2018). Starting from RICA sample for Veneto region only hybrid maize classes 600 and 700 were extracted for each Province, both rainfed and irrigated, from 2008 to 2016. In total, rainfed maize data were extracted for 132 farms in Padova, 47 in Rovigo, 40 in Treviso, 150 in Venezia, 37 in Verona and 16 in Vicenza. Irrigated maize data, for the same provinces, were extracted for 240, 118, 44, 84, 137 and 117 farms, respectively.
Identification of temperature and moisture-sensitive periods
Due to the wide diffusion at global level and the role of maize in the human diet numerous studies were conducted on the effect of climate change on maize yields. Although an increase of CO2 ensures higher photosynthetic activity and yields, especially in C4 crops, the modification of climatic conditions as temperatures increase and precipitation reduction have detrimental effects (Meza et al., Reference Meza, Silva and Vigil2008). Reduction of the growing cycle, number of grains and weight of grains are the typical effects of climate change on maize. Several studies reported a general reduction by 10–30% of yields in very different areas, from Mediterranean and Central Europe to tropical areas of Latin America under climate change effect (Alexandrov and Hoogenboom, Reference Alexandrov and Hoogenboom2000; Tubiello et al., Reference Tubiello, Donatelli, Rosenzweig and Stockle2000; Guereña et al., Reference Guereña, Ruiz-Ramos, Díaz-Ambrona, Conde and Mínguez2001). Drought significantly affects yields even if maize is a drought-tolerant crop and breeding efforts positively contributed to reduce its sensitivity to drought. Frequently, the main yields losses on maize are linked to drought events at flowering stage during ovary differentiation (Zinselmeier et al., Reference Zinselmeier, Westgate, Schussler and Jones1995; Dolferus et al., Reference Dolferus, Ji and Richards2011). This is supported by Cairns et al. (Reference Cairns, Sonder, Zaidi, Verhulst, Mahuku, Babu, Nair, Das, Govaerts, Vinayan, Rashid, Noor, Devi, San Vicente and Prasanna2012) reporting an average yield gap of 145 kg/ha/year on maize when drought occurs at flowering. Those yield losses are significantly reduced when drought occur at mid-grain filling stage with an average gap of 76 kg/ha/year (Campos et al., Reference Campos, Cooper, Habben, Edmeades and Schussler2004). Acute high temperatures have a relevant effect on yield decrease on maize even if between a range of 10–35°C maize development is positively correlated to temperature increase. Above the upper level and by 41°C, maize development is dramatically reduced due to morphological, physiological and biochemical alterations (Meza et al., Reference Meza, Silva and Vigil2008; Cairns et al., Reference Cairns, Sonder, Zaidi, Verhulst, Mahuku, Babu, Nair, Das, Govaerts, Vinayan, Rashid, Noor, Devi, San Vicente and Prasanna2012). In the sub-Saharan areas, it was observed an average yield loss of 1.3% occurred every degree day above 30°C. Likewise, a 2°C temperature increase causes higher yield losses compared to a precipitation decrease of 20% (Lobell et al., Reference Lobell, Bänziger, Magorokosho and Vivek2011; Cairns et al., Reference Cairns, Sonder, Zaidi, Verhulst, Mahuku, Babu, Nair, Das, Govaerts, Vinayan, Rashid, Noor, Devi, San Vicente and Prasanna2012). The most sensitive phases to temperature increase are emergence, stem elongation, flowering and grain filling. In maize, the optimum for plant emergence is defined at 26°C for soil temperature. For each degree above this threshold, it was detected an average reduction for root and shoot growth of 10% occurs until 35°C, beyond which growth is drastically reduced. This is principally due to a relevant reduction in reserve mobilization. Above 35°C stem elongation and morphological differentiation are severely affected. In particular leaves elongation, leaf area, shoot growth and photosynthetic potential are the most affected (Cairns et al., Reference Cairns, Sonder, Zaidi, Verhulst, Mahuku, Babu, Nair, Das, Govaerts, Vinayan, Rashid, Noor, Devi, San Vicente and Prasanna2012). Similarly, to drought, temperature has a strong influence on the flowering stage where the number of fertilized ovules decreases when temperature increases. Male reproductive tissues are highly sensitive to temperature increase compared to female ones. Thus, pollen production and germinability resulted to be the most responsible factors for yield losses (Cairns et al., Reference Cairns, Sonder, Zaidi, Verhulst, Mahuku, Babu, Nair, Das, Govaerts, Vinayan, Rashid, Noor, Devi, San Vicente and Prasanna2012). Maize yields are negatively correlated with temperature when cumulative degree days are accumulated above 32°C during the grain filling stage. High temperatures during this phase alter different physiological process as cellular division and sugar metabolism reducing the sink capacity of grains and thus, final yields (Cairns et al., Reference Cairns, Sonder, Zaidi, Verhulst, Mahuku, Babu, Nair, Das, Govaerts, Vinayan, Rashid, Noor, Devi, San Vicente and Prasanna2012). Maize grains weight is directly linked to rate and duration of grain filling stage. Earlier studies reported a reduction in grain filling period in maize grains in correspondence to high temperatures (Singletary et al., Reference Singletary, Banisadr and Keeling1994). Despite temperature increases, the rate of grain filling is not sufficient to counterbalance the negative effect of reduction of grain filling duration causing significant yield losses.
Water deficit negatively affects maize yields with losses that range from 30 to 90% based on crop stages and duration of critical period (Pandit et al., Reference Pandit, Sah, Chakraborty, Prasad, Chakraborty, Tudu, Narayan, Kumar, Manjunatha, Kumar and Rana2018). The most sensitive stages are flowering and grain filling. The main effects detectable on maize under water deficit conditions are: (i) reduction leaf time-length, plant height, panicle length and panicle per plant, seed weight and numbers, and premature leaf senescence at early stages (e.g. flowering, grain filling) (Sah et al., Reference Sah, Chakraborty, Prasad, Pandit, Tudu, Chakravarty, Narayan, Rana and Moharana2020). However, stress conditions are linked to an excess of water during waterlogging. Short periods of waterlogging are responsible for hypoxia of the root system that shifts to anoxia if this situation is prolonged in time (Zaidi et al., Reference Zaidi, Maniselvan, Srivastava, Yadav and Singh2010). Secondarily, waterlogging reduces root development and uptake resulting in nutrients deficit and toxic compounds accumulation. Plant emergence and tasselling are more susceptible stages for maize. Waterlogging conditions cause a reduction in stomatal conductance and leaves rolling. Furthermore, morphological and physiological modifications occur on the root and shoot systems as production of brace roots by above ground nodes and leaves depletion (Cairns et al., Reference Cairns, Sonder, Zaidi, Verhulst, Mahuku, Babu, Nair, Das, Govaerts, Vinayan, Rashid, Noor, Devi, San Vicente and Prasanna2012).
Statistical analysis
Pearson's correlation analysis (Soper et al., Reference Soper, Young, Cave, Lee and Pearson1917) has been performed between the maize and climate/weather datasets for various relevant months and seasons in order to investigate associations between crop yields with climate indices and teleconnections and weather types (significance 1, 5 and 10% levels of confidence).
Results
Relationships between weather types and temperature in Veneto according to SAN
The SAN ‘blocking’ temperature weather types WT7 produced much above average temperatures (from 1 and 2°C) over Veneto, throughout the April–August period but also WT4 and WT9 produced much above average temperatures (up to 3°C) in April and May. The ‘zonal’ regime produced above (WT3) and below (WT8) average temperatures. However, ‘cyclonic’ SAN weather types (WT1, WT2, WT5 and WT6) were absent over Veneto during the maize growing season (Table 1), and to a lesser extent zonal WT8.
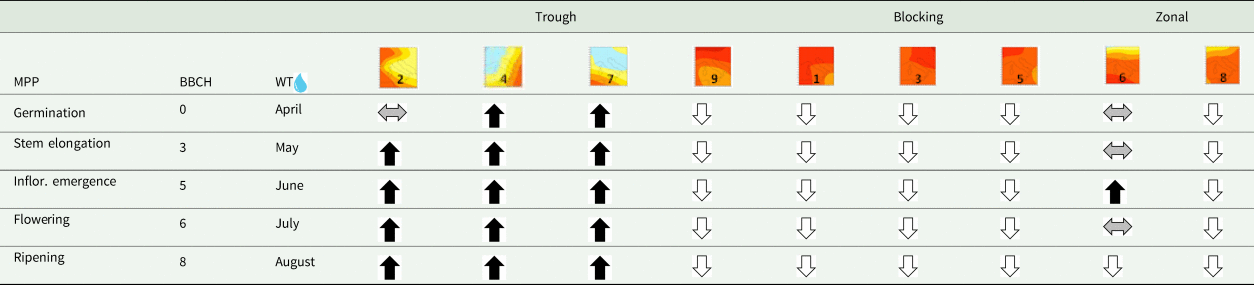
Table 1. Colour online. Monthly temperature anomaly for each circulation type classification for Veneto based on simulated annealing (SAN) methods
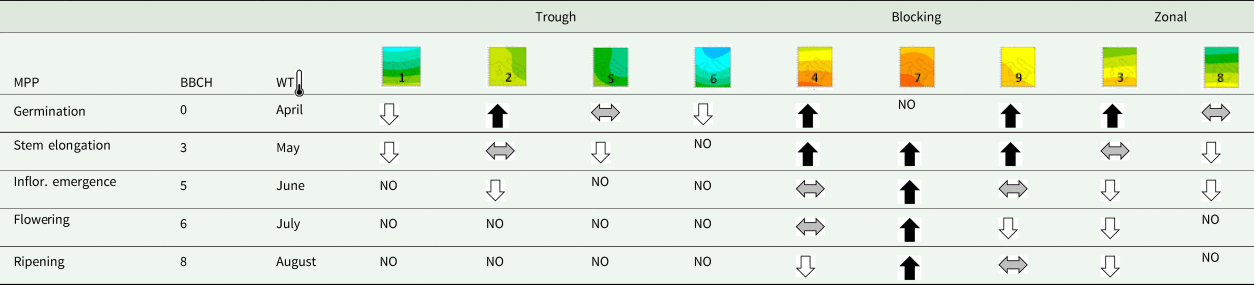
NO, weather types that do not occur during the April–August period; MPP, maize phenological phase; BBCH, Biologische Bundesanstalt, Bundessortenamt und Chemische Industrie scale.
The anomalies refer to the 1981–2010 base period.
Double grey horizontal arrow, −0.5°C < temperature anomalies < +0.5°C; black up arrow, temperature anomalies > 0.5°C; white down arrow, temperature anomalies < −0.5°C.
If we focus our attention on the spring period, the most marked positive anomalies occurred with WT4 and WT9 in April and with WT7 in May (Fig. 4).
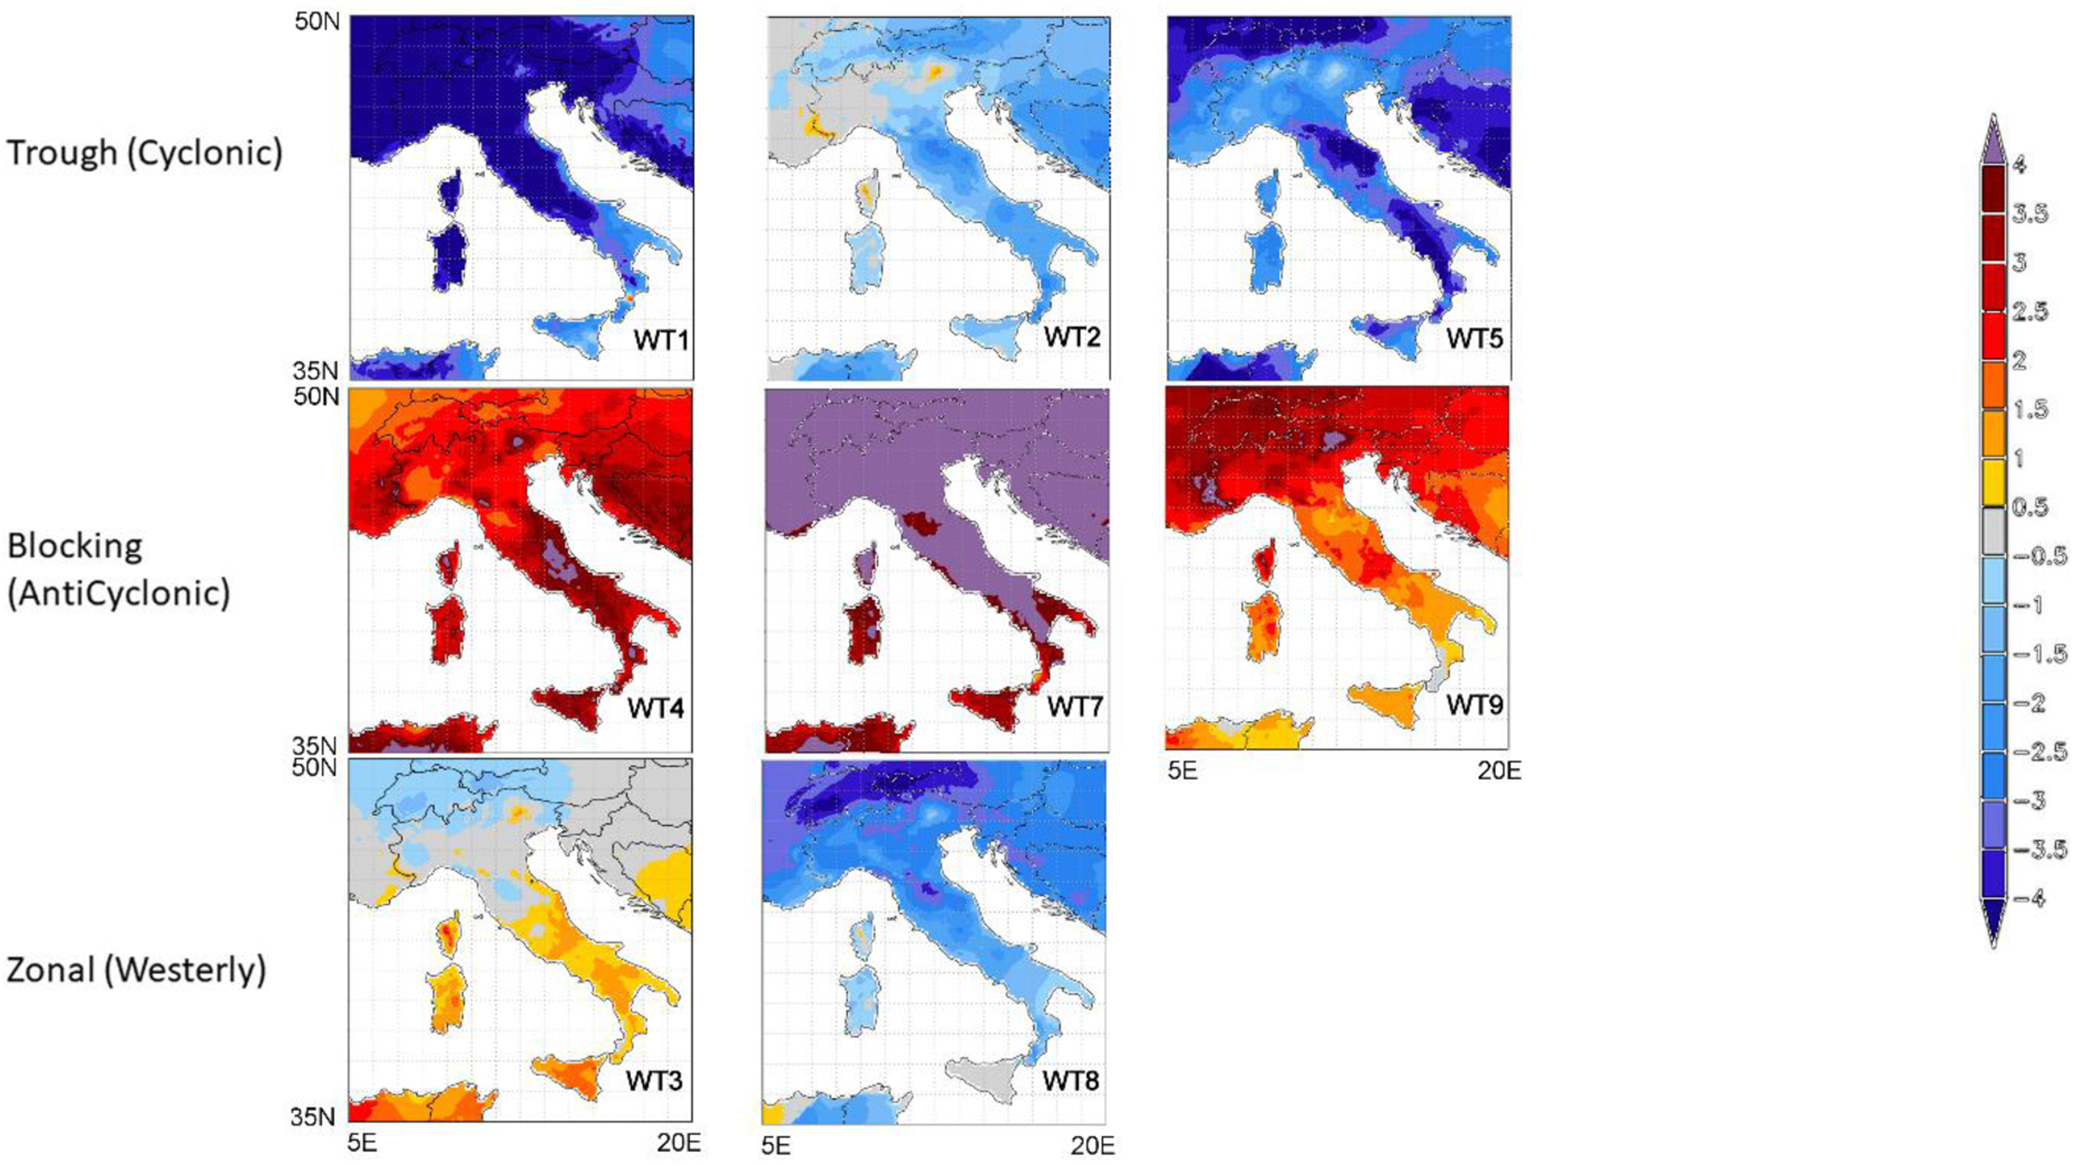
Fig. 4. Colour online. Anomaly monthly mean temperature for each circulation type classification in May for Italy based on simulated annealing (SAN) methods. The anomalies refer to the 1981–2010 base period.
On the contrary, the major negative anomalies occur with WT1 and WT6, both in April and in May (see Supplementary Figs 1–6). Also in June, the greatest thermal anomalies occurred with the WT7 while the highest negative thermal anomalies with the WT8.
As for the two hottest months (July and August), the most frequent weather type was WT7 which in fact determined the greatest positive thermal anomalies; WT4, WT9 and WT3 negative (Fig. 5).
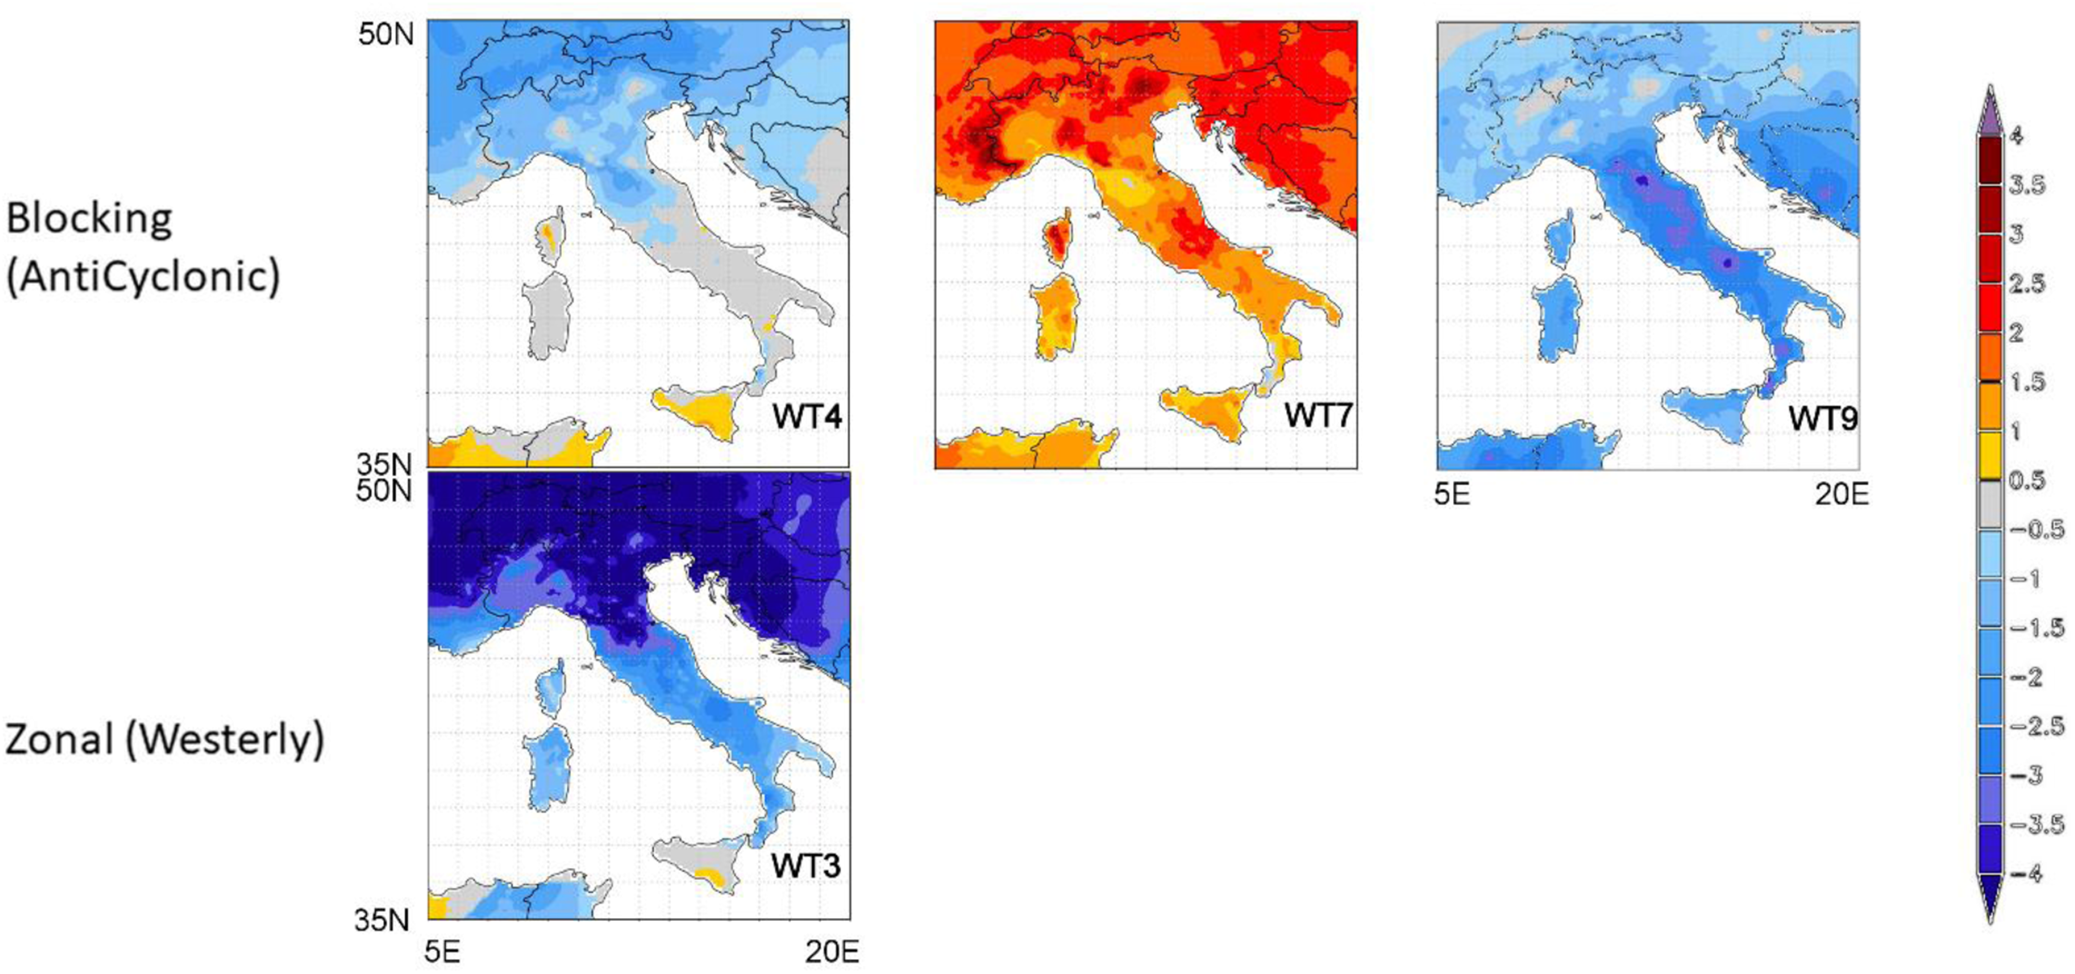
Fig. 5. Colour online. Anomaly monthly mean temperature for each circulation type classification in August for Italy based on simulated annealing (SAN) methods. The anomalies refer to the 1981–2010 base period.
The WTs frequencies varied over the April–August period (Table 2). In April, WTs that occurred most frequently were WT2 and WT8 (about eight times) while in May WT2, WT9 and WT3 with the latter occurring about nine times. In the summer months (June, July and August) WT4 and WT7 were the most frequent. In particular, WT7 occurred on average about 20 times in both July and August.
Table 2. Weather types (WTs) frequencies (%) according to simulated annealing (SAN) methods for each month
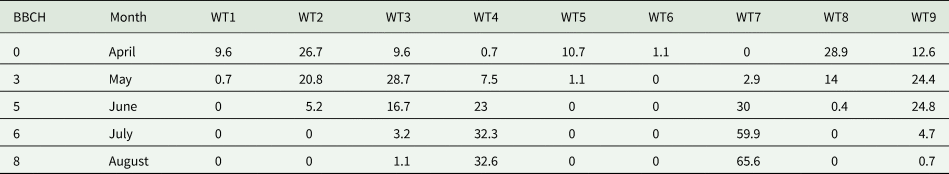
BBCH, Biologische Bundesanstalt, Bundessortenamt und Chemische Industrie scale; WT1, WT2, WT5 and WT6, cyclonic SAN temperature weather types; WT4, WT7 and WT9, blocking SAN temperature weather types; WT3 and WT8, zonal SAN temperature weather types.
Frequencies refer to the1981–2010 base period.
PCT precipitation types
The ‘blocking’ weather types were characterized by precipitation lower than the climatological average throughout the April–August period, especially WT1. The ‘zonal’ regime had generally minor rainfall anomalies but WT8 was generally drier than WT6 (Table 3).
Table 3. Colour online. Monthly precipitation anomaly for each circulation type classification for Veneto based on principal component transversa (PCT) methods
MPP, maize phenological phase; BBCH scale, Biologische Bundesanstalt, Bundessortenamt und Chemische Industrie scale.
The anomalies refer to the 1981–2010 base period.
Double grey horizontal arrow, −10 mm/day < precipitation anomalies < +10 mm/day; black up arrow, precipitation anomalies > 10 mm/day; white down arrow, precipitation anomalies < −10 mm/day.
In general, during the maize growing season, WT6 showed precipitation equal or higher than the average in Veneto. With trough weather types (WT2, WT4, WT7), positive anomalies prevailed; negative anomalies were observed with WT9. In the first maize phenological phase (April), weather types that determined positive precipitation anomalies were only cyclonic ones except WT9 which caused negative anomalies. On the contrary, negative anomalies occurred with blocking weather types (WT1 and WT3 with anomaly even up to 90 mm). During the flowering period (May and June), positive anomalies were caused by WT2, WT4 and WT7; negative anomalies by blocking circulation (in particular WT1 and WT3). In June also WT8 zonal circulation caused negative anomalies. During the fill period of the caryopsis (July and August), the most important pluviometric anomalies (both positive and negative) occurred close to the pre-Alps. August (Fig. 6) also showed a similar behaviour to July but with WT7 which, however, determined the most common positive rainfall anomalies.
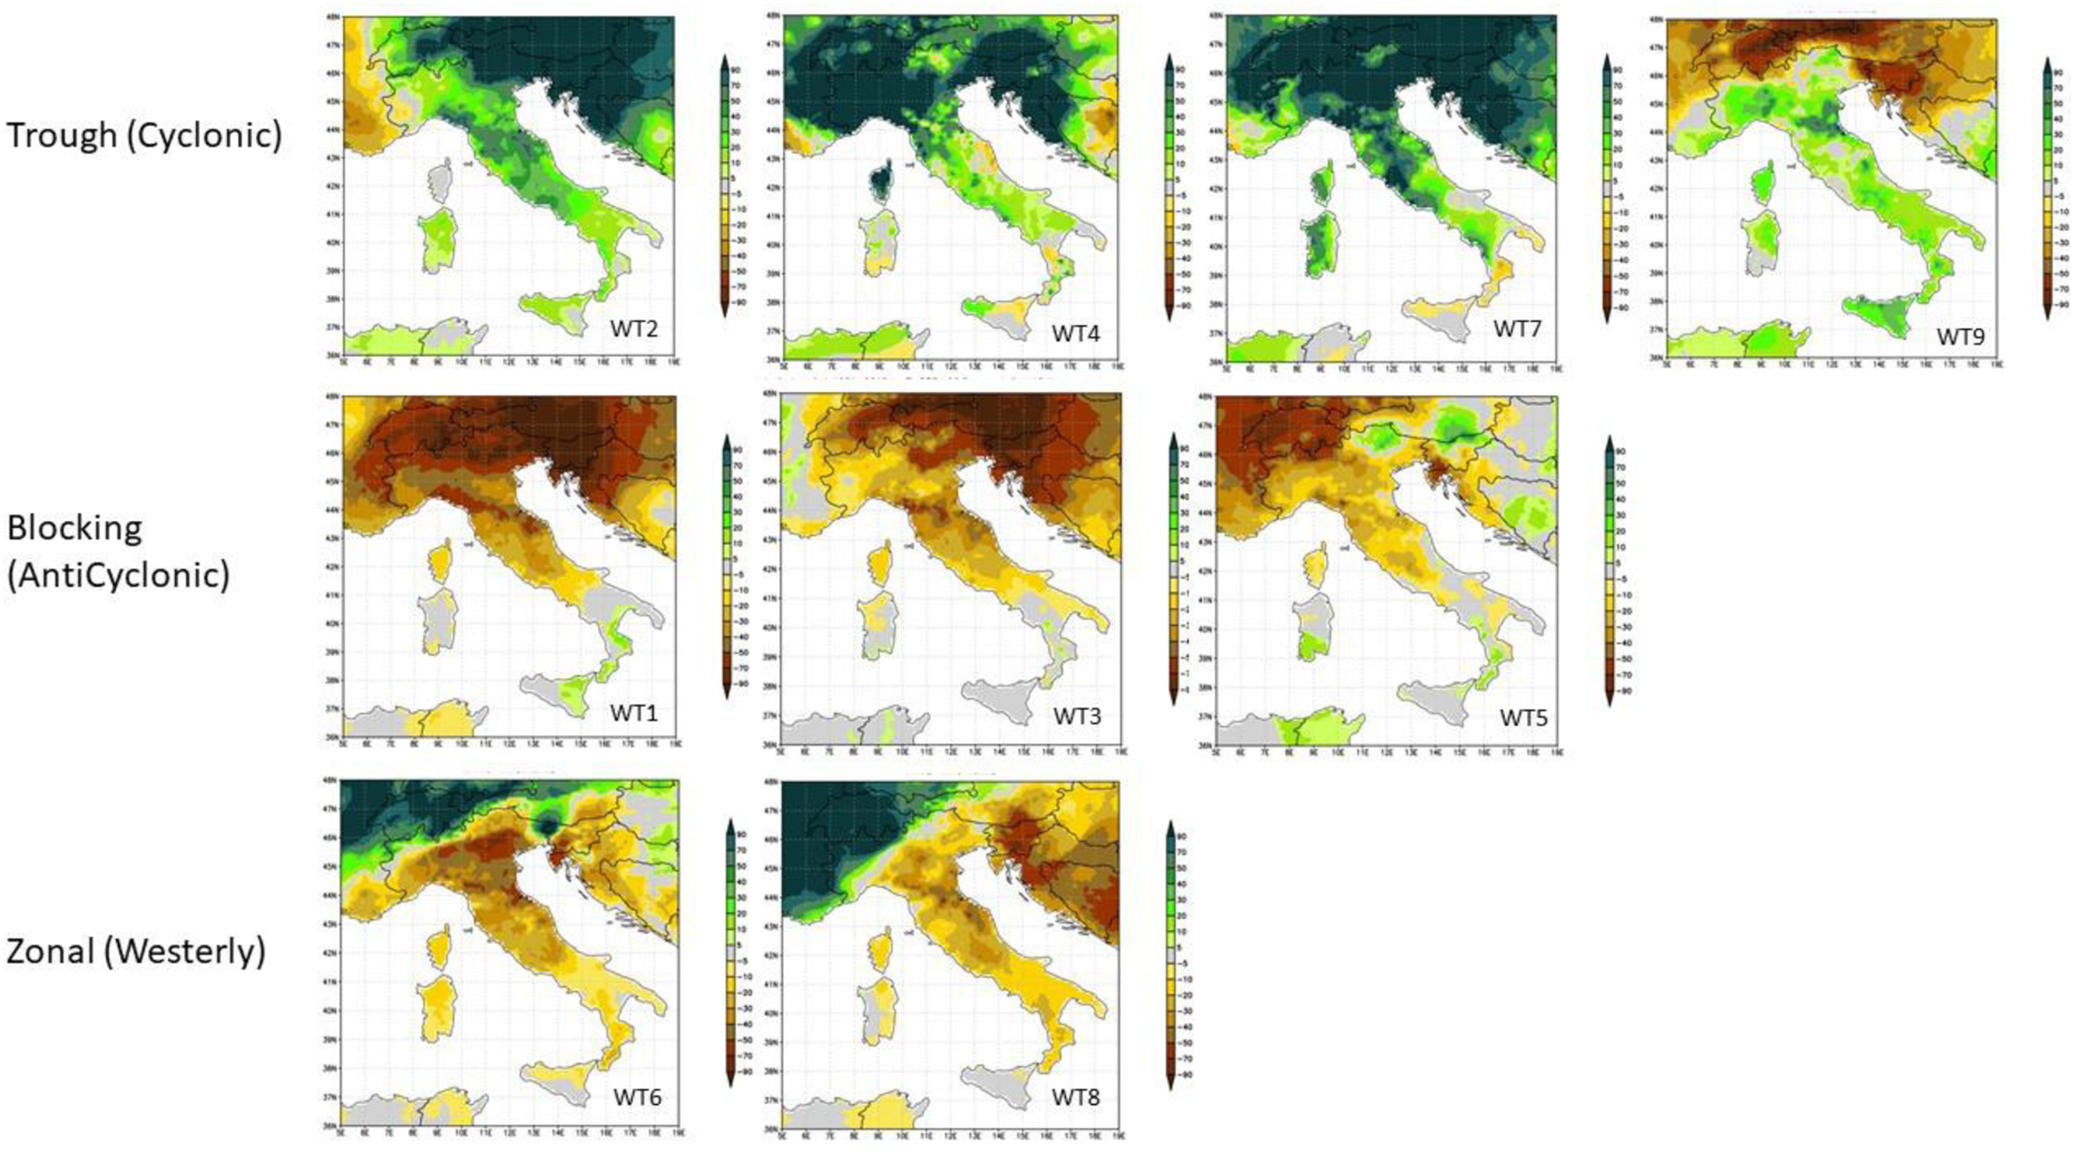
Fig. 6. Colour online. Anomaly monthly precipitation for each circulation type classification in August for Italy based on principal component transversa (PCT) methods. The anomalies refer to the 1981–2010 base period.
On the contrary, WT1 and WT3 caused the most negative rainfall anomalies. As for the zonal weather types, it is WT6 that caused the most important negative precipitative anomalies. The precipitation anomalies maps for each month (from April to August) can be consulted in Salinger et al. (Reference Salinger, Dalla-Marta, Dalu, Messeri, Baldi, Messeri, Vallorani, Morabito, Orlandini, Altobelli and Verdi2020) where correlations between WTs and different crop yields in Tuscany were analysed.
As for the frequency of the WTs was very different over the months. In April the nine WTs were fairly well distributed and each of them occurs on average 3–4 times, only WT1 occurred only two times. In May the most frequent were WT3, WT5 and WT8 (five times) while all the others occurred on average between two and five times. In June, the frequency of WT2 and WT8 was five times, WT3, WT6 and WT7 3; only one time the other WTs. July was similar to June also as regards the frequencies of the WTs. WTs blocking (WT1, WT3, WT5) were more frequent in August, in particular WT5 occurred on average seven times.
Teleconnections between large-scale patterns of climate variability, circulation regimes and weather types
Large scale
Salinger et al. (Reference Salinger, Dalla-Marta, Dalu, Messeri, Baldi, Messeri, Vallorani, Morabito, Orlandini, Altobelli and Verdi2020) discussed teleconnections between large-scale patterns of climate variability and these are briefly summarized here (Table 2). For temperate variability, the NAO and SNAO were naturally correlated significantly for July, and July/August. In the tropics, both WAM and Saharian HeatLow (SHL) contribute to the positioning of the ITF, with a major role played by SHL during the period 1979–2010. This is when the SHL intensity increased the temperature gradient between the Gulf of Guinea and the Sahara (Lavaysse et al., Reference Lavaysse, Flamant, Evan, Janicot and Gaetani2016). For temperate/tropical interactions, there is a very strong relationship between the July ITF position and the SNAO (1% significance).
Weather regimes and SAN types
Table 4 shows relationships between large-scale teleconnections and temperature weather types. Generally, with temperate teleconnections, WT1, WT2 WT5 and WT6, being all in the troughing regime, did not affect Italy during the growing season. Only in June did the ITF have a negative relationship with WT2. A negative NAO index in June and July produces easterly circulation with below average temperature. But this was balanced by more WT7 with warmer conditions. The presence of the SNAO during August produced more WT9 with much above average temperature. Of the tropical scale teleconnections, no relationships occurred with WAM. Lack of north African blocking (WT4) in July was associated with a more northerly located ITF. When the zonal regime was prevalent the ITF for the season was further north with above average temperatures from WT3 for the summer season.
Table 4. Simulated annealing (SAN) relationships between North Atlantic Oscillation (NAO), Summer North Atlantic Oscillation (SNAO), the West African Monsoon (WAM) and the Intertropical Front (ITF)
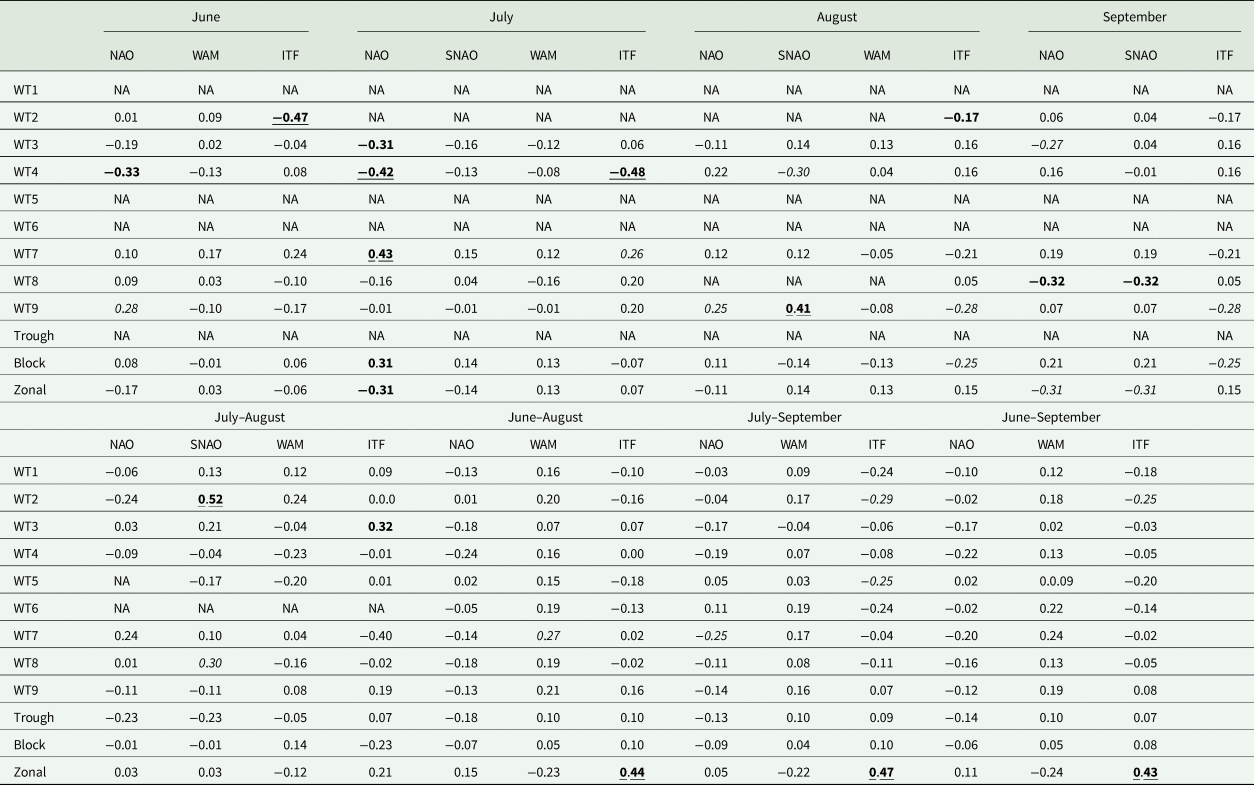
WT1, WT2, WT5 and WT6, cyclonic SAN temperature weather types; WT4, WT7 and WT9, blocking SAN temperature weather types; WT3 and WT8, zonal SAN temperature weather types; NA, not applicable.
Correlation values significant at the 10% level italicized, 5% in bold and 1% bold underlined.
PCT types
Circulation regimes and weather types that reveal significant linkages for PCT precipitation weather types are discussed by Salinger et al. (Reference Salinger, Dalla-Marta, Dalu, Messeri, Baldi, Messeri, Vallorani, Morabito, Orlandini, Altobelli and Verdi2020, Table 3), and are briefly outlined here Supplementary Figures 1-6. Those with temperate modes of variability were strong. The links of NAO with blocking, especially over central Europe (WT5 and WT3) in June, July and August (JJA), were significantly high. Anticyclones over central Europe were prominent during positive NAO events, but not further west (WT1). Zonal westerlies (WT6) tended to be absent especially in the late summer (July, August and September (JAS)). Similarly, with positive SNAO episodes, although lack of zonal flow (WT6) occurred with easterly circulation over the western central Mediterranean.
The tropical ITF teleconnections occurred only in late summer JAS. This was amazingly strong in August (r = 0.89) with WT7, when the ITF was at its northernmost position, indicating more cyclonic circulation regimes (troughing) over southern central Europe when the ITF was further south than normal. In this same month WT1 was more prevalent when the ITF was displaced northward. For JJA troughing had a tendency towards highly frequencies when the ITF was displaced south. When the WAM was strong, blocking was prevalent over western central Europe (WT1) compared with central Europe (WT5), and sometimes more zonal flow in early summer (WT6).
Direct links between climate variability and maize yields in Veneto
For temperate variability, the NAO and SNAO were naturally correlated significantly for July, and July/August (Table 5).
Table 5. Relationships (all positive) between large-scale circulation and maize yields
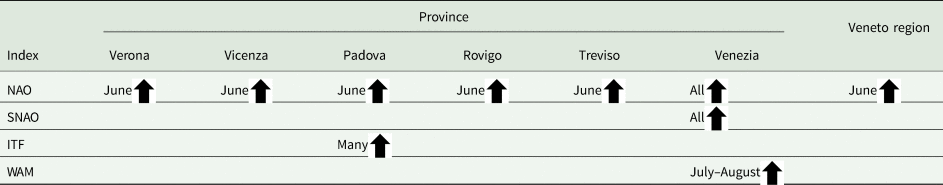
NAO, North Atlantic Oscillation; SNAO, Summer North Atlantic Oscillation; ITF, Intertropical Front; WAM, West African Monsoon.
Correlation values significant at the 5% level unfilled, and those at the 1% level filled arrows. Up arrows positive correlations, and down arrows negative.
In the tropics, relationships between ITF position and the WAM were non-existent. This could be owing to the confounding effects of the SHL. During the period 1979–2010 the intensity of the SHL has increased with a potential increase of its influence on the WAM system by increasing the temperature gradient between the Gulf of Guinea and the Sahara.
For temperate/tropical interactions the ITF and the WAM have no association with the NAO. However, there is a very strong relationship between the July ITF position and the SNAO (1% significance). With a positive SNAO the location of higher sea level pressures over northern Europe allows a more northern location of the ITF.
Large-scale circulation features impact directly on maize yields in Veneto (Table 5). The positive phase of the NAO impacts by increasing yields in June, and throughout the entire June–September period in Venezia. Similarly, the SNAO-positive phase enhanced yields also in Venezia. When the ITF is further north yields are also increased from June to September in the province of Padova.
Effects of circulation regimes and weather types on crop yields
San (temperature) weather types
From April to June (Table 6) if troughs occurred over northern Italy (WT6) in most provinces maize yields were decreased owing to below average temperatures. Similarly, more blocking in the western Mediterranean with warmer conditions also decreases yields. For the late summer period (July–August) WT7 decreased and WT9 increased maize yields in the provinces of Vicenza and Venezia. For the entire April–August period the occurrence of troughs over northern Italy (WT6) with below average temperatures decreased yields in all provinces.
Table 6. Simulated annealing (SAN) correlations with maize yields in the region of Veneto and its provinces with temperature

WT1, WT2, WT5 and WT6, cyclonic SAN temperature weather types; WT4, WT7 and WT9, blocking SAN temperature weather types; WT3 and WT8, zonal SAN temperature weather types.
Correlation values significant at the 5% level unfilled, and those at the 1% level filled arrows. Up arrows positive correlations, and down arrows negative.
PCT (precipitation) weather types
For the April to June period (Table 7) zonal westerlies with WT6 produced dry conditions over the Veneto region, leading to reduced maize yields. Generally, troughing increased yields in the province of Vicenza. Later in the season in July and August WT8 producing near average precipitation generally increased maize yields over the region. For the entire season from April to August WT6 with below average precipitation was the dominant weather type in reducing maize yields in several provinces of Veneto, as did zonal flow.
Table 7. Principal component transversa (PCT) correlations with maize yields in the region of Veneto and its provinces with precipitation
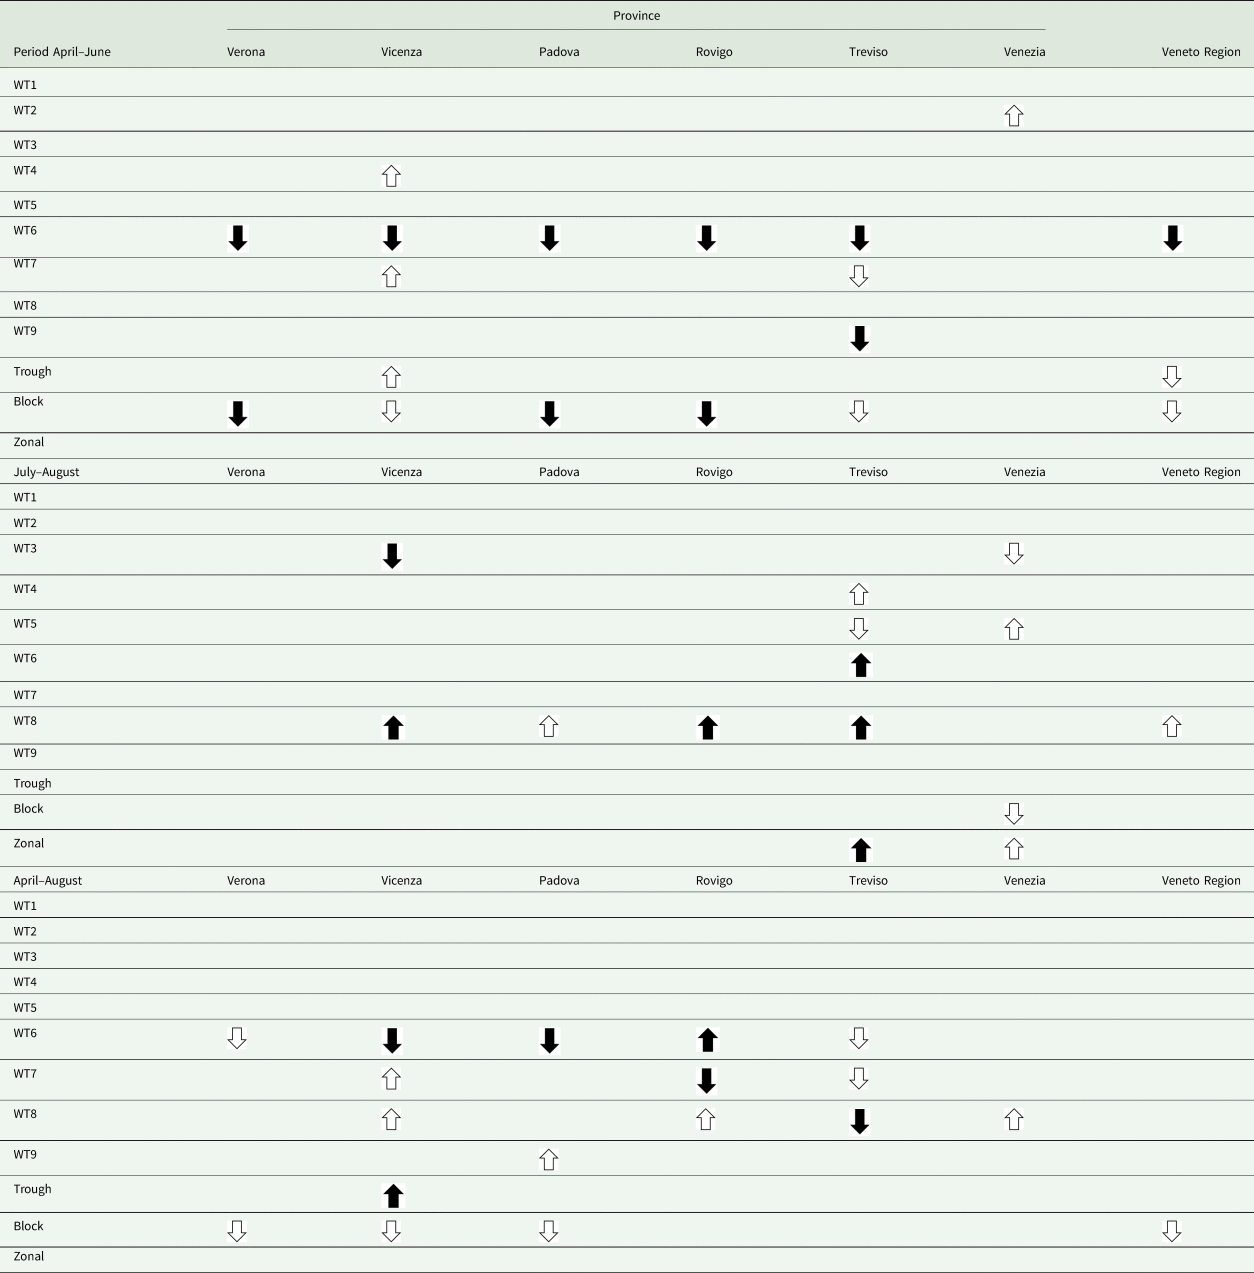
WT1, WT2, WT5 and WT6, cyclonic SAN temperature weather types; WT4, WT7 and WT9, blocking SAN temperature weather types; WT3 and WT8, zonal SAN temperature weather types.
Correlation values significant at the 5% level unfilled, and those at the 1% level filled arrows. Up arrows positive correlations, and down arrows negative.
Discussion
Climate variability in the Mediterranean has significant effects on crop yields (Salinger et al., Reference Salinger, Dalla-Marta, Dalu, Messeri, Baldi, Messeri, Vallorani, Morabito, Orlandini, Altobelli and Verdi2020). The results of this study have highlighted how maize production in the provinces of Veneto was also influenced by circulation regimes. In Veneto, wetter and cooler conditions occur during the summer when the NAO is positive while opposite conditions happen when it is negative.
A positive (negative) SNAO produces above (below) normal JA precipitation, and below (above) average JA temperature in northern Italy (Bladé et al., Reference Bladé, Liebmann and Fortuny2012). When ITF moves north, hot air masses are displaced from the Libyan dessert and moves over Italy, bringing hot and dry conditions in Tuscany. In short, when the WAM is strong, the ITF reaches its northernmost position, and blocking is prevalent over north west (WT1) in contrast to central Europe (WT5), with lack of troughing over Italy.
SAN
During the April–August growing season, the presence of trough circulation regime, according to SAN classification, and in particular WT6 determined a decrease in maize yields in most of the provinces of the Veneto. Even opposite conditions, and in particular blocking regimes with very warm conditions for the crops (in particular WT7 according to SAN classification) also decreased yields.
Focusing on the spring period, April–June the trough regime causes relevant yield losses on maize (Table 5). Below average temperatures show a negative impact on emergence and stem elongation phases causing relevant delays on the timing of growing cycle due to photosynthetic efficiency reduction (Antony et al., Reference Antony, Kirkham, Todd, Bean, Wilson, Armstrong PR, Maghirang and Brabec2019). Generally, below the threshold of 15–16°C (daily temperature) during plant emergence, significant damage occurs (Cutforth and Shaykewich, Reference Cutforth and Shaykewich1990). Previous studies reported significant modifications in growing cycle length in correspondence to negative temperatures anomalies (Warrington and Kanemasu, Reference Warrington and Kanemasu1983). At optimal temperature conditions 3 days are needed for seed emergence for maize. This period is extended until 16 days, from sowing to seed emergence, when 16/6°C (day/night) conditions occur. Reduced development of plants during the first phases determines a delay in the cycle making of the flowering phase, one of the most sensitive, coinciding with the hot-dry periods (Zinselmeier et al., Reference Zinselmeier, Westgate, Schussler and Jones1995; Dolferus et al., Reference Dolferus, Ji and Richards2011). Nevertheless, the analysis of results shows that the most sensitive period to below average temperatures in Veneto is April, during the germination phase of maize (Table 1). According to the SAN classification, higher temperatures are generally correlated to atmospheric circulation types, according to PCT classification, characterized by limited precipitations. The absence of precipitation during the first phenological phases (May–June) of maize has negative effect on plant growth (Cairns et al., Reference Cairns, Sonder, Zaidi, Verhulst, Mahuku, Babu, Nair, Das, Govaerts, Vinayan, Rashid, Noor, Devi, San Vicente and Prasanna2012). Similarly, a negative effect of relevant temperature increases (WT7) occurs on maize yields during the flowering and grain filling stages (July–August) (Zinselmeier et al., Reference Zinselmeier, Westgate, Schussler and Jones1995; Dolferus et al., Reference Dolferus, Ji and Richards2011; Cairns et al., Reference Cairns, Sonder, Zaidi, Verhulst, Mahuku, Babu, Nair, Das, Govaerts, Vinayan, Rashid, Noor, Devi, San Vicente and Prasanna2012). The relevant negative effect of WT7 is due to the high frequency with which it occurs during July and August period (59.9 and 65.6%, respectively) than the other WTs. The higher yields in Vicenza and Venezia provinces are due to WT9, showing negative thermal anomalies during July and August reducing temperature sensitivity of plants during flowering and grain filling stages (Campos et al., Reference Campos, Cooper, Habben, Edmeades and Schussler2004; Meza et al., Reference Meza, Silva and Vigil2008). Though circulations, especially WT6, cause yield losses due to relevant negative temperature anomalies during the first phenological phases of maize. Differently, same circulation types show positive impact on maize yields when they occur in the late phenological phases reducing the sensitivity of plants to temperature in the flowering and grain filling stages (Campos et al., Reference Campos, Cooper, Habben, Edmeades and Schussler2004).
In the present study we focused on the impacts of climate on crop yields without taking into account further factors as agricultural management strategies, pests and diseases, pedological conditions and variability that play a key role on agricultural productivity as well. Further research should be focused on these factors. Including greater number of crop varieties with different characteristics and pedoclimatic requirements may provide more accurate information for better predictions of yields based on circulation regimes. Similarly, considering different environments would allow to improve the predictability of circulation regimes impacts at wider scale. Moreover, the analysis of long-term yield data would allow the obtaining of stronger correlations as well as better evaluation of circulation regimes impacts on time. This is crucial considering the effect of climate change on precipitation and temperature alterations at local and global scale.
PCT
Zonal circulation (PCT WT6) was the most significant in decreasing maize yields as it produced decreased precipitation in Veneto. This is in contrast to WT8, also zonal flow, but weak, which increased maize crop yields. On the contrary, zonal circulations provide, during July and August period, higher maize yields, especially for WT6, only in western provinces (Venezia and Treviso) (Table 6). This is mainly due to the higher than average precipitation occurring during two of the most sensitive phases, stem elongation and flowering, differently to the other provinces. This is confirmed by Sah et al. (Reference Sah, Chakraborty, Prasad, Pandit, Tudu, Chakravarty, Narayan, Rana and Moharana2020) reporting a positive effect of high water availability during stem elongation and flowering phases of maize. Nonetheless, zonal circulations, according to PCT classification, cause yield losses when they occur during the late stage of the growing cycle (August). This is principally due to below average precipitation in all the considered provinces. Water deficiencies during August, at grain filling stage, is the main cause of yield losses in Veneto (Fig. 5) following grains weight losses (Sah et al., Reference Sah, Chakraborty, Prasad, Pandit, Tudu, Chakravarty, Narayan, Rana and Moharana2020).
Conclusions
The analysis of relationship between circulation regimes and WT, and maize yields was a valuable approach for the estimation of agricultural production trends. Both temperature and precipitation showed correlation elements with maize yields in Veneto. Circulatory regimes and the weather types that determine unfavourable conditions from a thermal and precipitative point of view in the key phenological phases of the crop, determine a drastic decrease in yields. Therefore, knowing the dominant circulatory regimes and weather types in advance (seasonal forecasts), can allow us to estimate the possible yields.
If this will also be accompanied by an improvement in the skills of seasonal forecasts would allow to anticipate crop yield with a good level of reliability. This kind of tool could represent an effective strategy for farmers to anticipate adverse climatic conditions and reduce yield losses. Likewise, similar tools can provide information for policymakers about climatic risks and the need to arrange supporting actions following extreme events.
Supplementary material
The supplementary material for this article can be found at https://doi.org/10.1017/S0021859622000545.
Acknowledgements
The authors thank the project SYSTEMIC (ERA-NET ERA-HDHL No 696295) for the support in the research activity.
Author contributions
J. S., G. M., G. D., A. M., S. O., L. V. conceived and designed the study. A. D., M. M., F. A. and B. G. conducted data gathering. R. V., J. S., A. C. performed statistical analyses. A. M., L. V., M. B. wrote the article.
Financial support
This research received no specific grant from any funding agency, commercial or not-for-profit sectors.
Conflict of interest
Not applicable.
Ethical standards
Not applicable.


 Open access