


1. Introduction and policy context
The United Nations Sustainable Development Goals (SDGs) are comprehensive, seeking as much as possible to eliminate extreme poverty and hunger, improve health and education, and reduce gender and economic inequalities, while also increasing economic growth and addressing climate change. There are 17 broad SDGs, with each comprising a series of targets. Many of these targets may be addressed in some fashion through the subject matter of this paper, which is focused on the benefits and costs of higher international mobility of skilled labor. For example, greater labor migration can establish more channels for information flows, directly contributing to faster economic growth (Goal 8) and improved innovation and work (Goal 9). It can also expand international remittances, which can be invested by recipient households in home countries in education (Goal 4), entrepreneurship (Goal 9), and improved and sustainable agricultural technologies (Goal 12). At the same time, increased emigration of medical professionals and technical workers from poor countries can reduce quality of local services, innovation, health status, and productivity. There are numerous economic tradeoffs, making the issue of global migration an important subject for benefit-cost analyses.
Skilled migrants move across borders largely to achieve higher incomes, assuming they get to work in their chosen professions (Grogger & Hanson, Reference Grogger and Hanson2011). Salary increases and improved living standards are the primary benefit to these migrants and their families. Moreover, skilled migration can expand innovation and economic opportunities in destination countries, which is well established by studies of developed economies (Hunt & Gauthier-Loiselle, Reference Hunt and Gauthier-Loiselle2010; Kerr, Reference Kerr2013). They also relieve critical labor shortages in technical and professional fields. These outcomes, in turn, color the debate in such countries about immigration policy, which tends to favor higher-skilled immigrants over the less skilled. Scholarship about developing countries focuses heavily on the potentially negative economic implications of the brain drain from outward migration (Docquier & Rapoport, Reference Docquier and Rapoport2012). Less studied are the effects of skilled migration from poorer to richer nations on reverse productivity gains because emigrants also establish additional channels for trade, investment, and production networks, which can enhance productivity gains in their home countries (Elo, Reference Elo, Larimo, Nummela and Mainela2015).
Such considerations underlie the analysis in this report, which is aimed at answering this question: What would be the economic benefits and costs of permitting an immediate increase in the bilateral migration of skilled workers among the 54 nations of the African Continental Free Trade Area (AfCFTA) and, more broadly, among all regions of the world? The impetus for studying Africa arises from a growing interest in greater labor mobility among African nations. The members of the African Union (AU) adopted a Free Movement Protocol in 2018 as a component of Africa Agenda 2063.Footnote 1 Its objective is to “provide for the progressive implementation of free movement of persons, right of residence, and right of establishment in Africa.” These rights, along with the market-opening measures of AfCFTA, are seen as essential for the economic integration of the continent and a driver of future economic development.Footnote 2 While to date relatively little migration policy reform has happened in national capitals, interest in greater movement of skilled persons remains high, as expressed in a recent framework draft.Footnote 3
While potentially important in Africa, the gains from skilled-labor migration on a global scale are likely magnitudes higher. From the standpoint of economic growth and poverty reduction across the developing world, therefore, an extended analysis of a marginal increase in global labor integration is in order. Moreover, despite some political reservations, pressures are building that will raise the demand for international movement of skilled labor. This is true for several reasons but arises especially due to demographic trends. Richer and higher-income emerging economies continue to experience sharp declines in their fertility rates and are aging rapidly, raising the need for skilled workers from abroad in such advanced occupations as medical care, finance, information technologies, and other knowledge-intensive industries.
Thus, the present analysis builds spreadsheet models of the key impacts of greater international flows of skilled workers in various categories (physicians, engineers or science, engineering, technology, and mathematics (STEM) workers, and other persons with advanced educations), both across Africa and 25 global regions. The benchmark change is a 10% increase in the bilateral migrant stocks of skilled workers, using 2020 data but implemented in 2022, considered to be permanent migration over the workers’ careers abroad of 25 years on average. The computations build on constructed bilateral matrices of 2020 migrant stocks among 12 countries and regions in Africa and 25 regions across the globe. Data on some variables and relationships are scarce, forcing several assumptions to be made to construct these matrices.
Skilled international migrants are defined as movers that have completed an advanced education, using UNESCO’s ISCED categorization. Specifically, the included categories are those with a tertiary education (Groups 5 and 6), an MA degree or equivalent (Group 7), and a doctoral degree or equivalent (Group 8). The analysis deploys separate data inputs for the prevalence of physicians in the population and those with degrees in STEM, in order to break out those types of skills. This is important, given the significance of losing their services in source countries while gaining them in destination countries. Quantifiable economic benefits arise for three actors in the model. First, there are higher migrant incomes abroad, which are substantial in the case of migration from low-income to high-income economies. Second, there are welfare gains in destination countries associated with higher economic efficiency, spillover productivity gains, and an improved ability of the younger and more skilled working force to support the needs of the wider population, resulting in higher national production. Benefits in source countries include productivity enhancements from two sources: (a) greater access to knowledge associated with more bilateral trade and investment and (b) the ability of local households to invest remittances in productivity-enhancing activities. Welfare losses in source nations include static efficiency reductions and a worsened demographic support capability. Benefits and costs are discounted at an 8% rate to compute their net present values.
1.1. Initial summary of results
Table 1 summarizes the aggregated results for the African and global models. Detailed results broken down by region are presented later in the report. The broader the skill classification, the greater are the volumes of benefits and costs because there are more migrants involved. There are notable variations in the benefit-cost ratios (BCRs) across skill categories. In Africa, the BCRs range from 3.71 for the broadest skill class (labeled “other skilled labor”) to 6.87 for greater migration of physicians and 4.37 for STEM workers. The gains for the latter two highly skilled categories largely arise from higher wages earned by those who migrate, the gains from investing remittances sent back to source countries, and better demographic ratios in the destination nations. STEM migration involves large positive technology spillovers. The origin countries suffer their largest losses in diminished demographic support ratios. Notably, if migration were limited to physicians and STEM workers, the BCR would be 4.57, markedly higher than that for other skilled labor categories.
Table 1. Overview of B/C ratios.

Note: In millions of dollars at an 8% discount rate.
These BCRs are well above unity, suggesting that perhaps four or five dollars would be returned per dollar of cost. However, they are relatively small compared to those from global migration, shown in the second panel of Table 1. A primary reason for the low BCRs is that within-Africa skilled migrants do not receive large gains in wages abroad, given the relatively narrow range in salaries across nations. Further, as noted later, some African regions experience relatively large losses from lower demographic support capabilities. Nonetheless, the estimated BCRs suggest that there are substantive net gains available to African countries through a marginal increase in skilled labor on the continent.
There are far larger volumes of migration in the global model, of course. The major point at this stage is that the BCRs are considerably higher, achieving levels above 10, suggesting truly notable potential net gains. These ratios are over 38 for physician migration and 17 for STEM workers, reaching 20 for the combination of those flows. There are four primary reasons for the markedly higher growth in benefits over costs between Africa and the world analysis. First, migrants from lower-income to higher-income economies receive considerably higher wage gains in the global model. Second, these gains generate significantly higher remittances back to source nations, which may be used by residents there to invest in productivity-increasing activities, such as more education and entrepreneurship. Third, there are greater positive productivity spillovers associated largely with migration from richer to poorer countries.Footnote 4 Fourth, the arrival of skilled immigrants generates relatively large demographic support gains in destination economies.
This policy would permit a 10% increase in bilateral skilled migrant stocks through migration according to 2020 estimated skilled migrant stock shares. Workers would work abroad for 25 years.
1.2. Theory and model
I develop spreadsheet-based models that capture important welfare impacts of a marginal increase in skilled-labor mobility within Africa and across the globe. In principle, workers can move in any direction, but to discipline the analysis, I tie the migration changes to estimates of existing bilateral stocks of skilled migrants, using 2020 figures for Africa and the world. The models are virtually identical in structure, save for the treatment of international productivity spillovers.
The models are constructed and calibrated to aggregate data, to estimate key economic impacts of a 10% rise in bilateral migrants of physicians, STEM workers (each broken down separately), and other skilled labor. In total, skilled labor is defined as those aged 15–64 who have completed an advanced education, ranging from short-cycle tertiary to doctoral degrees.
The impacts modeled and quantified include the following.Footnote 5
-
• The number of new migrants in each bilateral direction, plus the totals of skilled emigrants and immigrants by country or region.
-
• The implied changes in wages of skilled workers in these categories in source and destination countries, allowing for some convergence over time in wages between low-wage countries and high-wage countries. Pre-migration salaries for physicians and STEM workers are taken from an online global survey source, while proportionate wage premia for other skilled workers are assumed the same across regions.
-
• The gains in wage income for migrants, which depend on wage differences between source and destination and the ability (productivity) of immigrants, which determines the portion of the post-migration destination wage they earn over time after migrating. Because the migrants are skilled, a relatively rapid convergence of their salaries to destination levels is modeled. I assume migrants will not accept a lower wage in a destination country than they earned at home. These gains in migrant incomes over 25 years are a benefit in the model.
-
• The increase in remittances paid by the skilled migrants to their families remaining in the source countries. Remittances per se are not a welfare gain; rather, they are a transfer from migrants to home locations. However, they support investments, as noted below.
-
• The losses in static economic efficiency in source countries as skilled emigrants leave and the gains in static economic efficiency in destination nations as skilled immigrants arrive. These elements are in the welfare calculations. Note that these are welfare triangles in the standard economic sense. Even small changes in source-country and destination-country wages generate large aggregate compensation changes for remaining (source) and native (destination) workers. However, these changes are welfare rectangles that reflect income transfers between workers and capital owners or other factors and are not included in the welfare computations.
-
• The international migration of skilled workers brings positive productivity spillovers to their destination regions that arise from greater diversity in teams, more innovation and creativity, and improved techniques (Ortega & Peri, Reference Ortega and Peri2014). These are modeled simply and counted as destination benefits.
-
• There are similar productivity spillover benefits for source regions associated with the expansion of bilateral or multilateral trade and investment flows and greater production networks within cross-border migration associated with people from similar regional origins.
-
• Next, there are source-region welfare gains associated with increased inflows of labor remittances from skilled emigrants. The gains arise from the ability of source households and firms to invest a portion of these remittances in education, health, and entrepreneurship. The overall returns to such investments are high in developing countries.
-
• Finally, migration of skilled workers has important demographic effects, exemplified by the improvement (deterioration) of health status in destination (source) regions associated with physician migration. More broadly, skilled workers embody a higher ability to support the needs of the population through fiscal transfers and other processes than do unskilled workers. In principle, one could attempt to model these impacts within each skill category, accounting for the dynamic costs and benefits among regions with varying demographic profiles. The data required for this purpose are scarce, while projections of such needs are inherently difficult. Thus, I adapt the dynamic estimates in Marchiori et al. (Reference Marchiori, Shen and Docquier2013) of the impacts of a considerably larger hypothesized increase in skilled emigration on the long-term labor support ratios in aggregated regions of emerging and developing source regions. These ratios are translated into declines in per-capita GDP, taken as a welfare loss. However, there are corresponding improvements in these ratios in destination regions.
To clarify, this final element is an effort to capture an important dimension of the “brain drain” of skilled emigration in source regions and the corresponding immigration benefits in addressing the evolving skilled labor shortages in recipient nations. Migrating physicians, for example, likely generate larger gains in rich countries with aging populations and low birth rates. As Marchiori et al. (Reference Marchiori, Shen and Docquier2013) point out, there are additional impacts, including the potential for “brain gain” as remaining young people in source countries choose to invest in human capital as their prospective wages rise over time. I leave those effects aside.
With that overview, certain elements of the model parameters and equations, as listed in Appendix A, can be considered. The matrices of bilateral immigration and emigration shares are constructed from existing estimates of international migrant stocks, described in the data section below. The benchmark labor-demand elasticities in both destination and source regions are set at –0.5, which is close to the upper end of the confidence interval established in an extensive meta-analysis of published estimates of this parameter (Lichter et al., Reference Lichter, Peichl and Siegloch2014). The role of these parameters in the model is to compute the implied rise in source wages and drop in destination wages due to the migration of different skill classes. Note that higher elasticities would expand these wage impacts, with offsetting effects on benefits and costs. Specifically, for a given increase in migration, the lower destination wage would reduce the net wage gains of migrants and diminish remittances, even as it raises the destination net efficiency gains. Experimentation with higher demand elasticities had little impact on the ultimate BCRs.
There is little systematic information on the age at which the typical skilled migrant leaves one country to work abroad. Because a focus of this report is the effects of skilled migration on lower-income economies, I chose to calibrate the foreign career roughly to the anticipated foreign career of an African-trained doctor or engineer. Emigrant African doctors tend to complete their degrees in their early 30s and work for a few years at home before going abroad at perhaps 35 years of age. Given lower life expectancies in Africa, the typical retirement age is around 60. Thus, an emigrant would deprive the source country of the fruits of its educational investment for perhaps 25 years. To be sure, retirement ages are higher in richer destination countries, meaning this procedure underestimates the investment and productivity benefits available to those locations.
The next parameter, an annual macroeconomic wage convergence factor, attempts to capture the fact that, for the last few decades, real wages have tended to rise faster in poor and emerging economies than in richer ones, associated with such elements as technology diffusion and offshoring. Failure to account for this factor would overstate the time-related wage gains to migrants. Based on evidence from the convergence literature, I set this catch-up parameter conservatively at 2% (0.02) per year.Footnote 6
More consequential for the model are estimates of how quickly the wages (via productivity) of immigrants catch up to native wages of similar professionals. There is a large literature on this issue, which finds, for example, that even lower-skilled immigrants into the USA and Europe tend to catch up within a relatively short portion of their working life, conditional on the quality and substitutability of their training and skills.Footnote 7 It is likely that such convergence is relatively quick for physicians and STEM workers, while somewhat slower for other skilled labor. Thus, I permit the convergence factors to rise linearly from 80% to 100% in 3 years for the former and in 5 years for the latter.
The next parameter is the rate at which the additional skilled migrants might be expected to remit back to source countries a share of their income gains. In 2020, personal remittances in the world amounted to US$ 425 billion, which came to around US$ 1600 per person, given the total international migrant stock estimate from the United Nations Department of Economic and Social Affairs (UN DESA) of 265.6 million. It is likely that skilled migrants remit more per person but at a lower rate, which is consistent with the fact that, on average, migrants in Organization for Economic Cooperation and Development (OECD) countries remitted 4.7% of their gross incomes (measured as GDP per capita), compared to 15.3% in non-OECD nations.Footnote 8 The rate chosen here is 7.5% (0.075) of wage gains (rather than gross wages or GDP per capita) by the skilled migrants, which is consistent with the weighted average of these OECD versus non-OECD rates.
The succeeding set of parameters relate to potential productivity spillovers in destination countries from international migration of skilled workers. Numerous channels have been identified in the economics literature for such effects. First, as noted above, skilled immigration has a positive causal impact on real productivity per capita in a wide range of countries and is associated with intellectual diversity and high innovation propensities (Ortega & Peri, Reference Ortega and Peri2014). Second, such migration can stimulate growth in trade and inward foreign direct investment (FDI). These flows are, to some degree, channels for transferring advanced technologies to advantageous production locations (Markusen, Reference Markusen2002). Thus, there are significant productivity spillovers from inward FDI and technology licensing, emerging through multiple channels, including implementation of higher quality standards, demonstration effects, and local business startups (Keller, Reference Keller, Hall and Rosenberg2010).
The question here is the extent to which an increase in skilled immigration would support such technology spillovers and result in real GDP gains in destination countries. There are few reliable direct estimates of how flows of skilled workers generate such impacts. Rather, the influences are indirectly measured through trade, FDI, patenting, and the like. In this context, I make the following assumptions. First, suppose that each dollar of high-technology imports, FDI, and licensing is capable of raising local total factor productivity by US$ 0.03, a conservative estimate (Coe et al., Reference Coe, Helpman and Hoffmaister1997; Keller, Reference Keller, Hall and Rosenberg2010). Second, assume that increased flows of skilled workers facilitate additional inward technology transactions sufficient to capture half this impact, or US$ 0.015. Because these externalities must be measured in USD terms, I apply the associated parameters to the income gains earned (adjusted for productivity differentials) by movers at the destination because these gains are the appropriate measure of increased human capital. Specifically, for movers from lower-wage to higher-wage locations the destination GDP gain is the relevant spillover parameter times the adjusted wage differential multiplied by the number of movers. For movers from higher-wage to lower-wage locations, the GDP impact is just the spillover rate times the source wage multiplied by the number of movers. Put simply, for each US$ 1 billion in wages earned by skilled immigrants there is a spillover of US$ 15 million real GDP gains at the destination.Footnote 9
It is reasonable to assume that the effective spillover rates would vary depending on whether the migration is North–North, North–South, South–North, or South–South, where North refers to high-income economies and South to lower-income developing and emerging countries. Thus, I scale the North–North parameter at 0.015 as the benchmark. Presumably, North–South migrants embody greater differences in knowledge, and I take that parameter to be 0.06. In contrast, I set the South–North spillover at half the benchmark, or 0.0075. Finally, there is certainly information content in South–South labor flows, and I set the parameter to be 0.04, reflecting the rapid learning that takes place in countries with lagging technologies.Footnote 10 These spillovers are counted as real GDP gains in the welfare calculations.
The next parametric questions concern potential gains in source nations from similar productivity spillovers arising from skilled emigration on the one hand and domestic investment of remittances on the other. Regarding the former, I simply replicate the benchmark spillover parameter of 1.5% (0.015) discussed above. As for the latter, two additional parameters matter along with the remittances rate determined above. First, what proportion of incoming remittances are invested productively in education, health status, and the like? I could find no information on this question and simply take the parameter to be 25% (0.25). One justification is that remittances on permanent wage gains abroad presumably reflect a permanent increase in income for the recipient households in source countries. As such, we would expect a significant share going to investment activities. Second, what are the returns to such investments in terms of real productivity gains? Here, I appeal to a recent review of studies of returns to education in over 100 countries, typically performed using a Mincerian approach, which finds an average social plus private return to education of 32% (Patrinos & Psacharapoulos, Reference Patrinos and Psacharapoulos2020). Thus, I assign a parameter of 30% (0.3) as the return on investment of incoming remittances in source countries.
Turning to the model equations, they are generally straightforward implementations of the logical steps described above. Two points should be emphasized, however. First, the database begins with extensive estimates from UN DESA of bilateral migrant stocks across countries, which does not have a breakdown by skill categories. These migrants may have arrived in destination locations at any time in the past and therefore do not necessarily reflect current pressures for migration. Nonetheless, as described in the next section, I apply estimates of each region’s labor forces (also essentially stock estimates) in the three skill categories to total emigrant stocks to approximate the propensity to move abroad. In turn, these propensities are used to predict the distribution of where the 10% additional skilled migrants will locate. In brief, I assume that the existing bilateral migrant shares determine the allocation of the flows of new skilled migrants. Second, as mentioned earlier, there are substantial numbers of migrants in the UN DESA data who have resettled from higher-wage economies in lower-wage locations, which could happen for numerous reasons. In terms of economic pressures, however, it is unlikely that skilled professionals would choose to do so and accept lower wages abroad. Thus, I implement the assumption that physicians, STEM workers, and other skilled workers moving abroad keep their home wages rather than accept lower destination wages.
In principle, of course, workers could accept lower wages abroad under at least two important circumstances. One is that they gain altruistic benefits that make them better off but are essentially unmeasurable. Another is that real wages may be higher abroad due to lower costs of living. Indeed, comparisons of GDP per capita made with purchasing power parity (PPP) adjustments generally show that the gaps in real living standards between rich and poor countries are smaller than nominal wages would suggest. Such adjustments rarely reverse real income comparisons, meaning that migrants from high-wage economies presumably wish to retain their higher living standards associated with higher home wages, making this assumption reasonable. However, using PPP adjustments would reduce the real wage gains accruing to migrants and lower the computed BCRs somewhat.
The final element is the adaptation of Marchiori et al.’s (Reference Marchiori, Shen and Docquier2013) dynamic estimates of changes in support ratios. Their policy experiment is a series of increases in skilled migration of 20% each decade over 50 years. Their definition of skilled labor corresponds to the broadest category here: those workers with at least a secondary education. This experiment is first scaled downward to reflect the smaller size of skilled migration envisioned in the present analysis. Next, their estimates of changes in support ratios over the first 25 years of their projection period are taken to indicate what might happen in the timeframe considered here. These impacts vary across the seven regions in their analysis due to differences in demographic profiles, emigration propensities, and other factors. I apply these scaled parameters by region to corresponding regions in the African and global models here, assigning the smallest impacts in the high-income regions in order to be conservative on the benefits side regarding high-wage destinations. This vector of regional impacts on per-capita GDP losses is then translated into dollar-based impacts in source and destination regions using population data for 2020.
1.3. Data sources
As noted, the benchmark data matrix is built from bilateral estimates of migrant stocks in 2020 from UN DESA. African countries are aggregated into the 12 regions and individual countries (see Appendix B) and nearly all countries of the world into the 25 global regions (including India as a single country) in Appendix C. Note that in the UN DESA data for Africa, regional categories are defined differently from those in the AU. For example, Zambia and Zimbabwe are placed in Eastern Africa by the UN but in Southern Africa by the AU. For consistency with the migration data, I use the UN definition, but this element should be kept in mind as results are examined. The list of countries assigned to UN regions in the global model is comprehensive. However, some very small nations and territories were excluded, as were North Korea, and Taiwan, China Province because the UN matrix did not report migration data for them.
Organizing the raw data in this way, the basic matrix accounted for 256.6 million individuals among bilateral migrant stocks. The full UN DESA matrix claims there were 280.6 million migrants. The difference of around 24 million was either from UN “other” sources, which were undefined, or from the excluded small countries and non-reporters. The benchmark matrix in the model therefore contains 91% of the estimated global migrant stocks.
This matrix was then scaled in steps to achieve a reasonable estimate of the matrix of bilateral stocks of skilled migrants. First, the raw matrix was reduced by 30% to reflect the fact that about that percentage of migrants are outside the working age range of 15–64 years, which is the definition used in this analysis. Second, estimates of the proportion of each source country’s population with an advanced degree were developed, as described next. I applied these proportions to the bilateral cells in the working-age matrix, assuming that emigrants among advanced workers had the same share of the source labor force as domestic advanced labor. These adjustments resulted in an estimated 23.8 million migrants with advanced education or 13.9% of working-age migrants. Approximately 14.7 million are located in OECD countries. However, the World Economic Forum estimates that there are 25.2 million educated migrants in OECD countries, or 42% more than accounted for so far. Further, the AU estimates suggest that there were about 29% more skilled migrants in African countries than the 1.01 million found (African Union, 2019). Therefore, to be consistent with available independent estimates, the figures in the OECD destination cells were adjusted upward by 42%, and those for non-OECD countries were raised by 29%. These procedures produced a global bilateral matrix totaling 36.7 million migrants with advanced education. That matrix is reproduced in Table 2.
Table 2. Final estimated matrix of global bilateral migrant stocks with advanced education in persons: 2020.

ANZD, Australia and New Zealand; CCAM, Caribbean and Central America; CNAS, Central Asia; CHNM, China and Mongolia; EAFR, Eastern Africa; HIEA, High-Income East Asia; HISEA, High-Income Southeast Asia; HIWA, High-Income West Asia; INDIA, India; LISEA, Low-Income Southeast Asia; LIWA, Low-Income West Asia; MAFR, Middle Africa; MOIL, Mid-Eastern Oil Producers; NOAM, North America; NAFR, Northern Africa; NEUR, Northern Europe; OSAM, Other South America; OSAS, Other South Asia; PACI, Pacific Islands; SAFR, Southern Africa; SEUR, Southern Europe; SSAM, Southern South America; WAFR, Western Africa; WEUR, Western Europe.
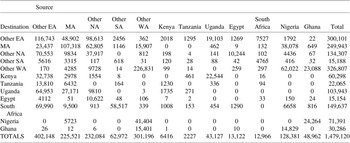
Similar procedures were applied to compute the estimated bilateral matrix of migrant stocks in Africa, which is given in Table 3. There were an estimated 1.479 million migrants with advanced education, which is consistent with AU estimates. In both tables, it is evident that migration decisions are driven to a large degree by gravity-based factors: there is a strong geographical concentration of migration between regions (and within regions) in close proximity and between regions of larger size. However, some regions display lower immigrant stocks than such factors would suggest, indicating their relative closure to labor mobility.
Table 3. Final estimated matrix of African bilateral migrant stocks with advanced education in person: 2020.

Other NA, Other Northern Africa; Other SA, Other Southern Africa; Other WA, Other Western Africa.
The next task was to estimate the numbers of physicians, STEM workers, and other skilled laborers who make up these bilateral cells of migrants with advanced education. That is, of the educated workers from, say, low-income Southeast Asia, who reside in Australia and New Zealand, how many can be reasonably assigned to each of the three skill classes? For this purpose, estimates of the domestic labor forces in each country with advanced education were compiled, along with estimates of the number of doctors and STEM workers. For the first estimation, I relied on the Barro and Lee (Reference Barro and Lee2013) dataset of educational attainment, which lists for most countries of the world figures capturing the proportion of the population over age 25 that have completed secondary and tertiary education.Footnote 11 These data exist at 5-year intervals, with the latest year being 2015. Thus, the figures for tertiary education rates in each country from 2010 and 2015 were extrapolated forward to estimate 2020 rates, making appropriate adjustments where there were unreasonably large jumps or reductions in prior attainment. These rates were then multiplied by the 2020 total population ages 15–64 to approximate the labor force with advanced education. Note that the Barro-Lee definition of tertiary completion is somewhat broader than the UNESCO definition of advanced education, but this is the best approximation method available.
The estimate of the number of physicians in each country was straightforward. Data for many countries on the number of doctors per 1000 people in the population are available in the World Bank’s World Development Indicators Database.Footnote 12 For developing and emerging economies, the data are reported erratically by year, and the most recent estimate available after 2015 was used. Most such ratios were from 2019 or 2020. Again, applying these rates to total population generated estimates for total physicians in domestic labor forces.
The procedure for STEM workers was similar but less direct because there are no systematic international estimates of their proportional representation in national workforces. However, the UNESCO UIS database reports annual percentages of graduates from science, technology, engineering, and mathematics programs in tertiary education.Footnote 13 The original goal was to focus on engineers alone in the migration study, but the UIS data include engineering students in a broad category including manufacturing and construction, too extensive a category for the purposes here. However, all STEM workers are potential contributors to growth, innovation, and spillovers, making them an appropriate aggregated category to study. Again, the most recent proportions available were used, most of which were for 2019 or 2020 for countries with such data. I then multiplied these STEM rates by the Barro-Lee rates of tertiary education in the working-age population to attain estimates of the numbers of STEM workers in each country with data. Finally, the category of other skilled labor is just the difference between workers with advanced education and the sum of physicians and STEM workers.
To allocate skilled workers to bilateral migrant status, I followed these steps. First, under the assumption that current (2020) labor forces with an advanced education are as likely to emigrate as past labor forces, I computed their propensity to emigrate as the ratio of each region’s total skilled migrants abroad to its 2020 total skilled labor. This propensity was applied also to doctors, STEM workers, and other skilled labor to estimate foreign emigrant stocks of those categories. Finally, using the final matrix of bilateral skilled migrant stocks described above, each category was assigned to cells of skill-specific migration matrices according to the bilateral emigration shares between each region pair, that is, I assume that overall skilled bilateral migrant stocks determine the same shares in each category of skilled migration.
Armed with these estimates for domestic and foreign emigration propensities among skill categories, it was next necessary to compute salaries in source and destination countries. In the African model, a simple rule, which seemed to capture rough estimates of wage premia by skill category, was applied. Specifically, the wage of skilled workers was taken to be 1.6 times GDP per capita, reflecting the low end of the skill premia reported by the World Bank (2020) in their analysis of AfCFTA. To capture the higher ranges, the wage of STEM workers was set at 2.75 times GDP per capita and of physicians at 7.5 times GDP per capita.
While this approach produced reasonable figures for African skilled wages by category, it proved untenable for the global model, especially in richer countries. For example, 7.5 times 2020 per-capita GDP in the USA and Germany yielded figures for the average physician salary far larger than survey-based estimates. Thus, I collected data on average physician and engineer salaries available online from a private firm offering information to potential professional migrants about compensation rates in nearly all countries.Footnote 14 These 2022 data are reported in local currencies, requiring conversion with market exchange rates in that year, which were downloaded from the IMF International Financial Statistics, using period-average rates across the first three quarters. These to 2020 prices were deflated using country consumer price indexes from the WDI, which currently extend only through 2021. Finally, salaries for other skilled workers were computed as engineering salaries divided by 1.724, based on an inspection of some other, less-skilled, categories of educated workers in the salary survey. These national salary figures were applied to all countries in the global model, including in Africa. It should be noted that these salaries are pre-tax and, in principle, should be adjusted in each region to an after-tax basis. However, available data on statutory personal-income tax rates are not universal, and they can be misleading given the large range of exemptions and deductions across nations. Thus, the model relies on pre-tax wage differences to compute wage gains. It is likely that such gains would be somewhat lower on an after-tax basis.
Finally, as anticipated, many of the variables mentioned were unavailable, or unreliably reported, in numerous countries, especially smaller economies and developing regions. This is one reason, beyond simple tractability, for conducting the benefit-cost analysis at the regional level, rather than on a cross-country basis. Thus, variables involving rates or ratios were aggregated to the regional level, using weights for countries with reliable data based either on population measures or GDP as the situation suggested. This weighting scheme permitted filling in the data requirements for both the African and global models.
1.4. Results for the African model
Again, the policy analyzed here is a one-time, 10% increase in bilateral skilled migration, relative to 2020 levels, across the countries and regions of Africa, beginning in 2022. This could be considered the result of a mutual decision among AU members to relax their immigration restrictions against foreign skilled workers based on prior migration patterns. Alternatively, one could imagine a 10% relaxation in overall barriers and the response mirrors past migration patterns, which could reflect underlying equilibrium conditions. The model assumes that the higher limits are met with immediate increases in bilateral migration, so that none of the permitted increases go unfilled.
Implementing the model with the data for African countries and regions generates the welfare results presented in Table 4 through Table 7. Per guidelines of the Copenhagen Consensus Project, future benefits and costs are discounted at 8%. In this context, recall that the program period is 25 years after the initial increase in skilled migration. Specifically, the migrants move to foreign locations and work the bulk of their careers there, earning destination-level incomes if wages there are higher or source-level incomes otherwise.
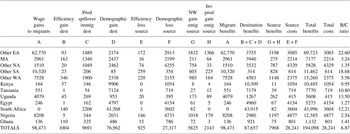
Table 4. Benefits and costs of a 10% increase in bilateral physician migration in Africa.

Note: In US$ thousands at an 8% discount rate.
Other EA, Other Eastern Africa; MA, Middle Africa; Other NA, Other Northern Africa; Other SA, Other Southern Africa; Other WA, Other Western Africa.
The model predicts an overall gain in physician migrant salaries (see Table 4) of US$ 98.473 million, which may seem modest in light of the scope of the policy change. There are three primary reasons for this. First, the initial migrant stocks in this category were small and a 10% increase amounts to just 2531 doctors overall. Second, the salary gaps between regions are relatively modest, generating small gains to migrants.Footnote 15 Third, a considerable amount of migration happens within regions. For example, 29% of the new physician migrants move within Other Eastern Africa, Middle Africa, Other Northern Africa, and Other Southern Africa. Because only one wage for physicians is defined within a region, these migrants generate no income gains. Nonetheless, the average salary increase for migrants in the model is US$ 38,271, a notable gain on source levels. Carrying through Table 4, the efficiency gain in destination countries is just over US$ 1 million, while productivity spillovers amount to US$ 9.7 million. The largest source of welfare gains in the destination countries and regions is the GDP gain from improved demographic support ratios, amounting to about US$ 77 million. Total destination benefits amount to US$ 87.7 million. In contrast, source countries suffer a small efficiency loss of US$ 925,000 and a significant demographic loss of US$ 27.3 million. Offsetting these losses somewhat are gains from diaspora-related network effects and the ability to invest a portion of inward remittances. Together these benefits total around US$ 8 million.
Across the continent, the BCR from physician migration is 6.87, a notable ratio in the context of development policy. However, these BCRs vary widely across countries and regions. The smallest are in Egypt, Ghana, Nigeria, and Other North Africa. In the cases of Egypt and Nigeria, this is due to a small increase in predicted immigration. Within the three regions, there are larger migrant flows, but no scope for wage increases due to the single regional wage. Thus, to some extent, the distribution of costs and benefits is an artifact of the model, in that within-region migrants presumably would gain some compensation increases. In contrast, larger net benefits are predicted for Kenya and South Africa, which attract large numbers of immigrant physicians and enjoy large GDP gains from improved support ratios. This finding highlights the substantial benefit from being a destination country for highly skilled professionals. Finally, the largest BCRs are registered for Other Eastern Africa and Other Southern Africa, both of which saw large out-migrations of physicians to other countries where they earned significantly higher wages.
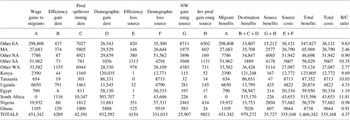
There are more STEM migrants than physicians, resulting in a larger scope of benefits and costs, but the costs rise faster, resulting in a lower BCR of 4.37 for Africa overall. Again, there are small BCRs in some countries (Other North Africa, Egypt, Nigeria, Ghana, and Other West Africa) for similar reasons. In addition to South Africa and Other Southern Africa, large BCRs are recorded for Uganda, Tanzania, Kenya, and Other East Africa, pointing to substantial increases in migration to and from those locations. Again, Ghana and Nigeria stand out as places where there are limited productivity spillovers and relatively high losses from reduced support ratios due to emigration (Table 5).
Table 5. Benefits and costs of a 10% increase in bilateral stem worker migration in Africa.

Note: In US$ thousands at an 8% discount rate.
Other EA, Other Eastern Africa; MA, Middle Africa; Other NA, Other Northern Africa; Other SA, Other Southern Africa; Other WA, Other Western Africa.
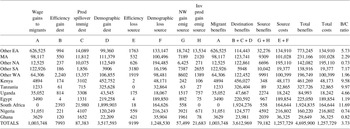
The other tables may be read analogously. The scale of migration of other skilled workers is considerably larger but the overall continental BCR of 3.73 is lower than that of STEM migration (Table 6). This is true also when all three types of migration are combined in Table 7. Total program benefits rise to US$ 6.36 billion and total costs to US$ 1.62 billion.
Table 6. Benefits and costs of a 10% increase in bilateral other skilled worker migration in Africa.

Notes: In US$ thousands at an 8% discount rate.
Other EA, Other Eastern Africa; MA, Middle Africa; Other NA, Other Northern Africa; Other SA, Other Southern Africa; Other WA, Other Western Africa.
Table 7. Benefits and costs of a 10% increase in bilateral all categories of skilled migration in Africa.

Note: In US$ thousands at an 8% discount rate.
Other EA, Other Eastern Africa; MA, Middle Africa; Other NA, Other Northern Africa; Other SA, Other Southern Africa; Other WA, Other Western Africa.
There are at least four lessons to be drawn from this African exercise. First, the primary beneficiaries of emigration are the migrants themselves who earn higher foreign wages even within Africa. Second, the limited data available for many countries, which forced them to be included in broad regions with single professional wages, mask some of the benefits that would exist in a more finely grained approach. In that context, the analysis understates somewhat the true BCRs for migrants from those countries. Third, despite that shortcoming, it is reasonable to infer that more open migration policies within Africa, while beneficial for each region overall, are not likely to be major sources of net development benefits in the smaller and poorer countries. They tend to be sources of net emigration, thereby losing on the demographic side and not acquiring many spillovers from immigration. Fourth, the largest net beneficiaries among individual countries in the data tend to be those with significant increases in net immigration, such as South Africa and Kenya.
1.5. Results for the global model
Although an important question in its own right, a global analysis of skilled migration is useful because of the shortcoming noted in the African model. Regional aggregation of data into single measures of investment costs and wages considerably limited the scope for net benefits to migration from poor countries, especially within regions. A global model offers scope for more regions with highly varying cost and salary conditions, along with greater scope for technology spillovers from technologically advanced countries to developing economies.
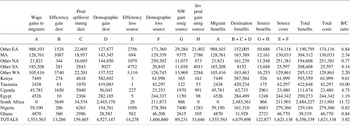
Therefore, turning to the results of the global model, presented in Table 8 through Table 11, again, the policy experiment is an immediate 10% increase in bilateral migration of three types of skilled labor, which could reflect a marginal relaxation of global migration barriers. Obviously, the far larger scale of global migration generates much greater program benefits and costs. Overall, benefits from all types of migration, shown in Table 11, amount to US$ 1.094 trillion, while costs come to US$ 87 billion. The essential point is the substantial rise in the BCR, from 3.92 in Africa to 12.57 in the global model for all categories combined. Indeed, this ratio rises to 38.29 for the migration of physicians. This expansion of opportunities for skilled migration to the world scale therefore qualifies as a highly effective policy choice for increasing global incomes.
Table 8. Benefits and costs of a 10% increase in bilateral physician migration globally.

Note: In US$ millions at an 8% discount rate.
ANZD, Australia and New Zealand; CCAM, Caribbean and Central America; CNAS, Central Asia; CHNM, China and Mongolia; EAFR, Eastern Africa; HIEA, High-Income East Asia; HISEA, High-Income Southeast Asia; HIWA, High-Income West Asia; INDIA, India; LISEA, Low-Income Southeast Asia; LIWA, Low-Income West Asia; MAFR, Middle Africa; MOIL, Mid-Eastern Oil Producers; NOAM, North America; NAFR, Northern Africa; NEUR, Northern Europe; OSAM, Other South America; OSAS, Other South Asia; PACI, Pacific Islands; SAFR, Southern Africa; SEUR, Southern Europe; SSAM, Southern South America; WAFR, Western Africa; WEUR, Western Europe.
The primary reason for the larger growth in benefits than in costs is that many skilled migrants from lower-income and middle-income economies are now permitted to move to richer countries, where physician, STEM, and other salaries are far higher than in their source nations. Thus, for example, in the calculations for physicians in Table 8, income gains to migrants come to US$ 72 billion, or 86% of total program benefits. Combining all three skill types, migrant income gains account for 75% of global benefits.Footnote 16 Clearly, such migration opportunities can generate wage gains in massive proportions. Moreover, these increases favor skilled workers from poor countries where migration opportunities would expand considerably. Consider, for example, the gains to physicians from the Caribbean and Central America (CCAM), most of whom would migrate to North America. Those doctors would gain US$ 26.2 billion in income. Furthermore, those income gains would support more investable remittances and network spillovers, generating significant net welfare gains in the CCAM source countries. Similar results pertain in India, Other Southern Asia (OSAS), Low-Income Western Asia (LIWA), Eastern Europe, and Northern Africa (NAFR), among others. Including the gains to their net emigrants, these regions register BCRs in excess of 30 and go far higher (Tables 8–10).
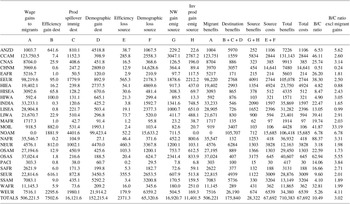
Table 9. Benefits and costs of a 10% increase in bilateral STEM worker migration globally.

Note: In US$ millions at an 8% discount rate.
ANZD, Australia and New Zealand; CCAM, Caribbean and Central America; CNAS, Central Asia; CHNM, China and Mongolia; EAFR, Eastern Africa; HIEA, High-Income East Asia; HISEA, High-Income Southeast Asia; HIWA, High-Income West Asia; INDIA, India; LISEA, Low-Income Southeast Asia; LIWA, Low-Income West Asia; MAFR, Middle Africa; MOIL, Mid-Eastern Oil Producers; NOAM, North America; NAFR, Northern Africa; NEUR, Northern Europe; OSAM, Other South America; OSAS, Other South Asia; PACI, Pacific Islands; SAFR, Southern Africa; SEUR, Southern Europe; SSAM, Southern South America; WAFR, Western Africa; WEUR, Western Europe.
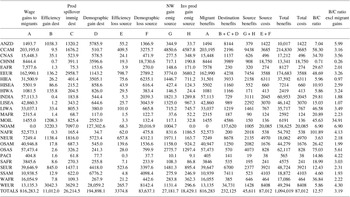
Table 10. Benefits and costs of a 10% increase in bilateral other skilled worker migration globally.

Note: In US$ millions at an 8% discount rate.
ANZD, Australia and New Zealand; CCAM, Caribbean and Central America; CNAS, Central Asia; CHNM, China and Mongolia; EAFR, Eastern Africa; HIEA, High-Income East Asia; HISEA, High-Income Southeast Asia; HIWA, High-Income West Asia; INDIA, India; LISEA, Low-Income Southeast Asia; LIWA, Low-Income West Asia; MAFR, Middle Africa; MOIL, Mid-Eastern Oil Producers; NOAM, North America; NAFR, Northern Africa; NEUR, Northern Europe; OSAM, Other South America; OSAS, Other South Asia; PACI, Pacific Islands; SAFR, Southern Africa; SEUR, Southern Europe; SSAM, Southern South America; WAFR, Western Africa; WEUR, Western Europe.
Some additional findings stand out. There are exceptionally high BCR ratios from the increase in STEM migration in the cases of India, low-income Southeast Asia (LISEA), other South Asia, Eastern Africa (EAFR), and Southern Africa (SAFR), among others. Again, these are largely income gains to emigrants, but this fact generates enough spillovers and remittance-based investment gains to give the source regions considerable net welfare gains. In Table 11, incorporating all types of skilled-labor movements, BCRs of 15 or higher exist in each of the African regions and some other developing regions, including the Pacific Islands, accounting for income gains to migrants. While the sources of these net gains vary, it seems the spillover benefits as destinations and the investment gains as sources dominate the reduced support-ratio demographic problems as skilled workers emigrate. This common finding in the tables challenges the conventional wisdom that skilled emigration is harmful through brain-drain effects.
Table 11. Benefits and costs of a 10% increase in bilateral all categories of skilled migration globally.

Note: In US$ millions at an 8% discount rate.
ANZD, Australia and New Zealand; CCAM, Caribbean and Central America; CNAS, Central Asia; CHNM, China and Mongolia; EAFR, Eastern Africa; HIEA, High-Income East Asia; HISEA, High-Income Southeast Asia; HIWA, High-Income West Asia; INDIA, India; LISEA, Low-Income Southeast Asia; LIWA, Low-Income West Asia; MAFR, Middle Africa; MOIL, Mid-Eastern Oil Producers; NOAM, North America; NAFR, Northern Africa; NEUR, Northern Europe; OSAM, Other South America; OSAS, Other South Asia; PACI, Pacific Islands; SAFR, Southern Africa; SEUR, Southern Europe; SSAM, Southern South America; WAFR, Western Africa; WEUR, Western Europe.
To highlight the dominance in the results of migrant income gains the final column in Table 8 through Table 11 reports BCRs for regions, excluding the benefits to migrants. While these are not measures of overall program effects, which appear in the primary BCR columns, they do indicate the balance of benefits and costs for specific regions as net recipients or net senders of skilled workers. While these ratios are much smaller, they remain well above one and some are notably high.Footnote 17 For example, among developing regions, there are high ratios in the case of physicians for the CCAM, Eastern Europe, and the Pacific Islands (PACI), among others. Other regions are prominent in this context in the case of STEM migration, while several developing regions stand out when all three skill categories are permitted to migrate. In brief, for developing countries the major impact of greater opportunities for skilled labor mobility is to raise emigrant incomes considerably in their destinations. However, the other gains, arising from productivity spillovers, network effects, and additional investment resources arriving through remittances, are sufficient to more than overcome the losses from diminished support ratios, leaving substantive net benefits.
The computed impacts for developed regions, such as North America (NOAM), Western Europe (WEUR), and Northern Europe (NEUR), are quite different. Because they send relatively few migrants abroad and those workers do not gain much foreign income, the overall BCRs in those rows are generally smaller than those for developing regions, although still high for NOAM and Australia-New Zealand (ANZD). However, removing the gains to migrants in the final column does not reduce the BCRs much, meaning some richer regions are sizeable net beneficiaries. This outcome is mostly due to improved demographic conditions, along with productivity spillovers from arriving migrants. These findings highlight the importance for richer countries of permitting more immigration of skilled labor, who can fill critical professional needs. The richest European region, Northern Europe (NEUR), however, registers relatively small BCRs. This is due largely to the fact that their emigrants, coming from high-salary regions, do not achieve much income gain in the model. Here is another case where the need for regional aggregation, forcing a single wage within an area of active intercountry professional migration, understates the potential net benefits. In contrast, the lower-income European regions, including Eastern Europe (EEUR) and Southern Europe (SEUR), capture significantly larger net benefits from an increase in skilled migration.
A final case is the set of Middle Eastern Oil Producers (MOIL), which register consistently high BCRs, including when gains to their emigrants are excluded. These are economies with relatively high salaries, so inward migrants gain substantial incomes there. Immigration of skilled labor generates notable benefits in terms of productivity gains and GDP increases associated with improved demographic support ratios.
1.6. Concluding remarks
The analysis in this report supports the following conclusions. First, the opportunity for higher international migration of physicians, STEM workers, and other skilled labor offers considerable scope for net global benefits. Accounting for all modeled benefits and costs, the BCRs range from around 4.6 in Africa to 20 on a global scale, and yet higher for physicians and STEM workers. Many individual regions, mostly made up of poor developing countries, register much higher BCRs.
Second, the primary source of these large gains is the higher incomes earned abroad by skilled emigrants. Their income gains are program benefits, even if they accrue only to the migrants. Thus, the substantial gains registered here refer largely to the fact that skilled immigrants from poor countries tend to earn much higher salaries abroad.
Third, skilled migrants do send to their home countries significant volumes of personal remittances. These are not welfare benefits per se; rather, they reflect decisions to transfer income gains abroad. However, remittances offer recipient households the wherewithal to invest in education, improved healthcare, entrepreneurship, and other activities that can permanently raise their productivity and incomes. This, along with spillover productivity gains learned from both immigrants and network effects abroad, is signal gains for poor countries from migration, especially of skilled labor. These gains, in virtually all cases modeled, are enough to overcome the demographic costs.
Developed economies are generally smaller net beneficiaries (in relative terms) from enhanced skilled migration. However, there are real gains arising from importing the services of skilled professionals who materially improve demographic support conditions while generating large spillover gains. These benefits are accentuated by the clear and growing need for more immigration as populations age in richer countries.
Combining these factors, enhanced migration of skilled workers should be seen as a win–win proposition among countries and the migrants themselves. Note that the income gains to migrants from lower-wage economies reflect the real productivity gains they achieve in destination locations, which raise global growth. The suggestion from this analysis is, therefore, to place a high priority on finding means to relax immigration barriers to international skilled-labor migration. This conclusion applies with considerable force in the case of physicians and STEM workers, the migration of which establishes the highest net benefits.
Acknowledgments
The author would like to thank Danielle Parks for her assistance in compiling the data for this project. John Beghin of University of Nebraska-Lincoln, Cassandra Zimmer of Center for Global Development, David Vanzetti of University of Western Australia, Nancy Dubosse, and Bjorn Lomborg of Copenhagen Consensus Center for their valuable comments that supported this analysis. All responsibility for the content remains with the authors.
A. Appendix A: Structure of the Global Model

B. Appendix B: Allocation of Countries to Regions in the Africa Model
Countries entering individually: Kenya, Tanzania, Uganda, Egypt, South Africa, Nigeria, Ghana
Regions:
-
• Other East Africa: Burundi, Comoros, Djibouti, Eritrea, Ethiopia, Madagascar, Malawi, Mauritius, Mozambique, Rwanda, Seychelles, Somalia, Tanzania, Uganda, Zambia, Zimbabwe
-
• Middle Africa: Angola, Cameroon, Central African Republic, Chad, Congo Democratic Republic, Congo Republic, Equatorial Guinea, Gabon, Sao Tome & Principe
-
• Other Northern Africa: Algeria, Libya, Morocco, Sudan, Tunisia
-
• Other Southern Africa: Botswana, Eswatini, Lesotho, Namibia
-
• Other Western Africa: Benin, Burkina Faso, Cape Verde, Côte dʼIvoire, The Gambia, Guinea, Guinea-Bissau, Liberia, Mali, Mauritania, Niger, Senegal, Sierra Leone, Togo
C. Appendix C: Allocation of Countries to Regions in the Global Model
Region or country
-
1. Northern Africa (NAFR): Algeria, Egypt, Libya, Morocco, Sudan, Tunisia
-
2. Eastern Africa (EAFR): Burundi, Comoros, Djibouti, Eritrea, Ethiopia, Kenya, Madagascar, Malawi, Mauritius, Mozambique, Rwanda, Seychelles, Somalia, Sudan, Tanzania, Uganda, Zambia, Zimbabwe
-
3. Middle Africa (MAFR): Angola, Cameroon, Central African Republic, Chad, Congo Democratic Republic, Congo Republic, Equatorial Guinea, Gabon, Sao Tome & Principe
-
4. Southern Africa (SAFR): Botswana, Eswatini, Lesotho, Namibia, South Africa
-
5. Western Africa (WAFR): Benin, Burkina Faso, Cabo Verde, Cote d’Ivoire, The Gambia, Ghana, Guinea, Guinea-Bissau, Liberia, Mali, Mauritania, Niger, Nigeria, Senegal, Sierra Leone, Togo
-
6. Central Asia (CNAS): Kazakhstan, Kyrgyzstan, Tajikistan, Turkmenistan, Uzbekistan
-
7. China and Mongolia (CHNM): PR China, Mongolia
-
8. High-Income East Asia (HIEA): China Hong Kong, Japan, Republic of Korea
-
9. Low-Income Southeast Asia (LISEA): Cambodia, Indonesia, Laos, Myanmar, Philippines, Thailand, Timor-Leste, Viet Nam
-
10. High-Income Southeast Asia (HISEA): Malaysia, Singapore, Brunei
-
11. India
-
12. Other South Asia (OSAS): Afghanistan, Bangladesh, Bhutan, Iran, Maldives, Nepal, Pakistan, Sri Lanka
-
13. High-Income West Asia (HIWA): Cyprus, Israel
-
14. Low-Income West Asia (LIWA): Armenia, Azerbaijan, Georgia, Iraq, Jordan, Lebanon, Syrian Arab Republic, Turkey, Yemen
-
15. Middle Eastern Oil Producers (MOIL): Bahrain, Kuwait, Oman, Qatar, Saudi Arabia, United Arab Emirates
-
16. Eastern Europe (EEUR): Belarus, Bulgaria, Czechia, Hungary, Poland, Moldova, Romania, Russian Federation, Slovakia, Ukraine
-
17. Northern Europe (NEUR): Denmark, Estonia, Finland, Iceland, Ireland, Latvia, Lithuania, Norway, Sweden, United Kingdom
-
18. Southern Europe (SEUR): Albania, Andorra, Bosnia and Herzegovina, Croatia, Greece, Italy, Malta, Montenegro, North Macedonia, Portugal, San Marino, Serbia, Slovenia, Spain
-
19. Western Europe (WEUR): Austria, Belgium, France, Germany, Luxembourg, Netherlands, Switzerland
-
20. Caribbean and Central America (CCAM): Antigua & Barbuda, Aruba, Bahamas, Barbados, Cayman Islands, Cuba, Curacao, Dominica, Dominican Republic, Grenada, Haiti, Jamaica, Puerto Rico, St Kitts & Nevis, Saint Lucia, Trinidad & Tobago, Turks & Caicos, Belize, Costa Rica, El Salvador, Guatemala, Honduras, Mexico, Nicaragua, Panama
-
21. Southern South America (SSAM): Argentina, Brazil, Chile, Uruguay
-
22. Other South America (OSAM): Bolivia, Colombia, Ecuador, Guyana, Paraguay, Peru, Suriname, Venezuela
-
23. North America (NOAM): Bermuda, Canada, United States
-
24. Australia and New Zealand (ANZD): Australia, New Zealand
-
25. Pacific Islands (PACI): Fiji, New Caledonia, Papua New Guinea, Solomon Islands, Vanuatu, Kiribati, Marshall Islands, Federated States of Micronesia, Nauru, Palau, French Polynesia, Samoa, Tonga, Tuvalu


 Open access