

1. Introduction
Social and emotional (SE) skills are increasingly recognized as important for child development (Weissberg, Kumpfer & Seligman, Reference Weissberg, Kumpfer and Seligman2003; Zins, Weissberg, Wang & Walberg, Reference Zins, Weissberg, Wang and Walberg2004). These skills, which include competencies such as self-awareness, self-management, social awareness, relationship skills, and responsible decision-making, may help students progress further in their education and may also enhance personal well-being. In recent reviews of the evidence on interventions to develop SE skills, Durlak, Weissberg, Dymnicki, Taylor and Schellinger (Reference Durlak, Weissberg, Dymnicki, Taylor and Schellinger2011, Table 2) and Sklad, Diekstra, De Ritter, Ben and Gravestein (Reference Sklad, Diekstra, De Ritter, Ben and Gravestein2012) identify durable and substantively important gains in SE skills, attitudes, positive social behavior, conduct problems, emotional distress, and academic performance. These gains should lead to improvements in personal, economic, and social well-being.
According to Durlak et al. (Reference Durlak, Weissberg, Dymnicki, Taylor and Schellinger2011), social and emotional learning (SEL) combines youth development with the promotion of particular competencies, with the aim of enabling students to respond appropriately to environmental demands and fully take advantage of opportunities. Ultimately, SE competencies encourage a shift to an internal locus of control, allowing individuals’ choices and actions to better accord with their own values. These competencies relate to “soft skills” and personality traits that, according to Heckman and Kautz (Reference Heckman and Kautz2012), predict success in school, the labor market, and life. Notably, SE competencies do not just raise academic achievement and educational attainment. They also foster personal satisfaction and growth, help individuals become better citizens, and reduce risky behaviors like violence and drug use (Durlak, Weissberg & Pachan, Reference Durlak, Weissberg and Pachan2010; Collaborative for Academic, Social, & Emotional Learning, 2013).
Despite substantial research attention on mechanisms and impacts, the economic value of gains in these skills has received little attention. Yet, within a resource-constrained education system, instructional activities in SE skills must compete with instruction directed toward test score improvements and increases in educational attainment. To date, most education research has focused on these last two objectives, with the presumption that this will have important economic consequences. For attainment, this focus makes clear sense: the evidence on the high economic value of graduating from high school or completing college is substantial. For achievement, the focus may also be justified (Bartik, Gormley & Adelstein, Reference Bartik, Gormley and Adelstein2012), although other studies find fade-out of cognitive gains (Levin, Reference Levin2012). Moreover, whatever influences are driving the high returns to attainment, they are only partially mediated through improvements in cognitive functioning (Heckman & Kautz, Reference Heckman and Kautz2012). A suggestive and plausible option to these foci is to look at social and emotional development such as effort, motivation, curiosity, empathy, caring, and the many other dimensions that can be encompassed by SE skills. These skills may drive attainment or achievement, which then become the focus for educational investments, but they merit direct analysis. On balance, it is likely that both SEL and cognitive learning are efficient investments. But the former domain has received very little attention from economists, and the policy debate instead emphasizes cognitive gains and test score accountability. In this environment, it is critical to identify and enumerate the value of SE skills.
In this paper, we review the economics of SEL (hereafter SEL or SE skills). Following Borghans, Duckworth, Heckman and ter Weel (Reference Borghans, Duckworth, Heckman and ter Weel2008, 974), we consider interventions that primarily influence “personality traits, defined as patterns of thought, feelings, and behaviors” (as opposed to those directed toward boosting academic achievement); also, the interventions must have been included in the two major reviews of SEL by Durlak et al. (Reference Durlak, Weissberg, Dymnicki, Taylor and Schellinger2011) and Sklad et al. (Reference Sklad, Diekstra, De Ritter, Ben and Gravestein2012). First, we set out a framework that includes both the economic principles and the methodological approaches for estimating the value of SE skills. This framework builds on standard benefit-cost analyses (BCAs) but adapts it for SEL in several key ways. Next, we review the evidence on the development of SE skills and examine how these skills might be given shadow prices directly using benefit-transfer approaches (in terms of earnings or proxied by education level). We then apply this framework to a set of school-age SE interventions to calculate their costs, benefits, and net benefits. The intention is not to rank these interventions in terms of their efficiency: as our estimates show, the studies identify different impacts and hence benefits. Instead, our intent is to demonstrate how BCA of SEL interventions should be undertaken and to see if benefits exceed costs under current research protocols and evidence. We draw explicit attention to the deficiencies of these protocols and evidence and make transparent the assumptions needed to perform these BCAs. Overall, the benefit-cost ratios are very high. Hence, rather than emphasize the calculated ratios, we instead pay considerable attention to methodological challenges in estimating costs and calculating benefits; in turn, these challenges highlight broader research issues in evaluating SE interventions. In our conclusion, we emphasize important conceptual, empirical, and methodological questions that need to be answered in future research on the economic value of SEL.
2. Foundations for economic evaluation of SEL
2.1. Economic framework
Most educational interventions can be evaluated using conventional BCA, which has been well-established for decades (Levin & McEwan, Reference Levin and McEwan2001; IOM/NRC, 2014; Karoly, Reference Karoly2012). However, when applied to SEL this analysis requires particular adaptation (see also Belfield & Levin, Reference Belfield and Levin2015).
The conventional approach is to identify the resources required to implement an SEL intervention net of business as usual (Levin, Reference Levin, Guttentag and Struening1975; Belfield et al., Reference Belfield, Bowden, Klapp, Levin, Shand and Zander2015). These costs should be based on the opportunity cost of the resources required and expressed in present values (McEwan, Reference McEwan, Levin and McEwan2002, p.39). This ingredient costing method is generally applicable across educational interventions. For SEL interventions the challenge is how to specify incremental costs relative to the business as usual provision in achieving a particular goal. Where an SEL intervention is delivered as an after-school program, the incremental costs are measured straightforwardly; if the within-school curriculum is altered to emphasize SEL, it may be more difficult to identify incremental costs. Incremental costing is conventional in BCA; the challenge arises because school-based SEL interventions are directed to enhance SE skills and so other learning is potentially being traded off. Logically, when time and resources are reallocated to a new goal (e.g., SEL), other outcomes (e.g., cognitive achievement) obtain less time and resources and so are impaired.
However, achievement and SEL may not be independently determined. Teaching SE skills might reduce time for instruction intended to boost achievement. Alternatively, teaching SE skills might boost achievement if high achievement is partly determined by behavior (as argued by Heckman and Kautz Reference Heckman and Kautz2012). An intervention that boosts SE skills and also raises achievement is Pareto-optimal and so clearly preferred. Yet, an intervention that boosts SE skills but lowers achievement might still be preferred if the value of SE skills outweighs the loss in achievement. The only way to determine this trade-off is through BCA and placing a money value on SE skills and achievement gains. Hence, it is essential to explicitly measure achievement together with SEL outcomes.
All the outcomes must then be assigned shadow prices and expressed as benefits in dollars. These benefits should be expressed in present values so as to be comparable with the costs and allow for calculation of the net present value or benefit-cost ratio.Footnote 1
The economic benefits of SE interventions need to be separated into four components. This separation is necessary for two reasons. One is temporal: some interventions may work immediately (perhaps through control of behaviors); others may work more slowly (perhaps through changing attitudes). The other is general: SEL interventions are likely to generate positive externalities for other students, that is, benefits to students who are not the direct recipients of the interventions. We contrast this separation with standard economic evaluations of academic gains. First, there are immediate economic benefits $B_{D}$
– those occurring as the intervention is being delivered. As SEL interventions affect behavior, we might anticipate that some behavioral modification is immediate or at least reasonably expedited, even if it fades out later. For example, an anti-bullying program can stop bullying and prevent bullying from re-emerging. Second, there are postintervention economic benefits during youth
$B_{D}$
– those occurring as the intervention is being delivered. As SEL interventions affect behavior, we might anticipate that some behavioral modification is immediate or at least reasonably expedited, even if it fades out later. For example, an anti-bullying program can stop bullying and prevent bullying from re-emerging. Second, there are postintervention economic benefits during youth $B_{Y}$
– those occurring after the intervention has been delivered but while the participants are still in school. For example, an anti-bullying norm may have been established within the school. Third, there are postintervention economic benefits during adulthood
$B_{Y}$
– those occurring after the intervention has been delivered but while the participants are still in school. For example, an anti-bullying norm may have been established within the school. Third, there are postintervention economic benefits during adulthood $B_{A}$
– those benefits that occur after the participants have left school. For example, a student who has not been bullied in school may be more confident in the labor market. For the immediate benefits, the issue is how rapidly the benefits accrue once the intervention has begun; we refer to this as the “ratchet function”
$B_{A}$
– those benefits that occur after the participants have left school. For example, a student who has not been bullied in school may be more confident in the labor market. For the immediate benefits, the issue is how rapidly the benefits accrue once the intervention has begun; we refer to this as the “ratchet function” $(r_{i})$
. For the postintervention benefits
$(r_{i})$
. For the postintervention benefits $B_{Y}$
and
$B_{Y}$
and $B_{A}$
, the critical issue is their durability; we refer to this as the “fade-out function”
$B_{A}$
, the critical issue is their durability; we refer to this as the “fade-out function” $(f_{i})$
. Fourth, SEL interventions are often motivated to improve school climate or externalizing behavior; these interventions will generate important spillover benefits beyond the individual student.
$(f_{i})$
. Fourth, SEL interventions are often motivated to improve school climate or externalizing behavior; these interventions will generate important spillover benefits beyond the individual student.
Hence, estimates of the economic benefits of SEL interventions should address both the temporal impacts and the spillover effects. (In light of these many benefits, sensitivity analyses also need to be significantly expanded.) Critically, all benefits should be counted and discounted: otherwise interventions with immediate effect will not be prioritized and – tautologically – evaluations that include more benefits will make an intervention appear more beneficial.
Application of this framework – consistent measurement of costs and impacts (including achievement), full consideration of all benefits, reporting of standardized metrics – should yield meaningful estimates of the economic value of interventions to boost SE skills. This framework gains even greater salience in light of current practice in SEL evaluations. As shown below, the current evidence base is far from sufficient to provide guidance to policymakers and practitioners as to the economic value of SEL interventions.
3. Evidence on the economics of SEL
3.1. Program-based evidence
There is substantial evidence on positive impacts of SEL interventions (SCDRC, 2010; Durlak et al., Reference Durlak, Weissberg, Dymnicki, Taylor and Schellinger2011; Sklad et al., Reference Sklad, Diekstra, De Ritter, Ben and Gravestein2012). These impacts include large gains in SE skills, attitudes, positive social behavior, and academic performance, as well as reduced conduct problems of student disruption, emotional distress, substance abuse, mental health disorders, and achievement. The impacts are substantively large (with effect size gains of 0.2 to 0.6) and, when based on teacher reports, are consistently statistically significant (Durlak et al., Reference Durlak, Weissberg, Dymnicki, Taylor and Schellinger2011, Table 2). However, SEL interventions vary significantly in application and mission. Some are integrated into regular classroom instruction, some are directed at a specific adverse behavior, and others are intended to have a general effect (e.g., on school climate) rather than an individualized one (on each student). SEL interventions can be targeted to specific grades or be applied across the full span of grades. They vary in lesson content, classroom strategies, and professional development (SCDRC, 2010, Table 1.1, Panels 1–3; and Sklad et al., Reference Sklad, Diekstra, De Ritter, Ben and Gravestein2012, Tables 3 and 4). Potentially, the interventions require very different amounts of resource and yield a varied set of benefits. This heterogeneity increases the need for a more comprehensive form of BCA.
Some BCAs of SEL interventions have been performed.Footnote 2 Applied to the context in Washington state, Lee et al. (Reference Lee, Aos, Drake, Pennucci, Miller, Anderson and Burley2012) have calculated costs, benefits, and net benefits for three well-known SEL interventions: Promoting Alternative Thinking Strategies program (PATHS); the Seattle Social Development Project (SSDP); and Life Skills Training (LST).Footnote 3 For the SSDP, the participant costs are $3030 and the benefits are $5800; the net benefits are strongly positive at $2770. For LST, the costs are $30 and the benefits are $1290; the net benefits are therefore $1260. At the national level, Jones, Bumbarger, Greenberg, Greenwood and Kyler (Reference Jones, Bumbarger, Greenberg, Greenwood and Kyler2008) estimate net benefits of $810 per student in LST. Looking at how SEL interventions ameliorate substance abuse by youth, Miller and Hendrie (Reference Miller and Hendrie2008) perform BCA for three interventions. For LST, they estimate costs of $290, benefits of $5960, and therefore net benefits of $5670. For SSDP, they estimate costs of $3200, benefits of $19,000, and therefore net benefits of $15,800. For the Social Competence Program, they estimate costs of $350, benefits of $2500, and therefore net benefits of $2150. These analyses show that SEL interventions can yield positive, sometimes substantial, economic returns. However, since the studies were carried out independently, they use different approaches to both cost and benefit measurement and so are not directly comparable.
The broader literature on youth behavior includes BCAs of programs to combat delinquency (Weimer & Vining, Reference Weimer and Vining2009). Many of these programs are intended to modify some SE skills (such as student conduct, educational progress, and externalizing behaviors). But their main focus is on a narrow class of behaviors, such as teenage pregnancy or juvenile crime; few are intended to affect a broad array of outcomes simultaneously. Nonetheless, these programs are typically found to have benefits that exceed their costs. Miller and Hendrie (Reference Miller and Hendrie2008, Table 12) estimate net benefits for 17 general substance abuse programs and find that almost all have positive net benefits. In their review for Washington State of programs for children and adolescents, Lee et al. (Reference Lee, Aos, Drake, Pennucci, Miller, Anderson and Burley2012) find positive net benefits for seven.
Despite these studies on the economic value of SEL, the literature and evidence base are limited in that they fail to apply the comprehensive approach described above. Few studies report costs in detail; even fewer use the ingredients method, relying on budgetary data or estimates by the program developers; and most do not clearly specify business as usual. There are significant differences in how the programs are evaluated in terms of benefits, including the number of impacts that are converted into monetary benefits; the method by which benefits are calculated (i.e., how impacts are translated into dollar amounts); and the time horizon for analysis (with some studies including only immediate benefits while others only long-term benefits).Footnote 4 Also, these programs cannot easily be compared either to each other or to the broader class of delinquency prevention interventions, not least because of significant programmatic differences with respect to the students targeted, the size of the program, and the outcomes intended for improvement (SCDRC, 2010, Table 1.1, Panel 6).
3.2. Shadow pricing SE skills in the labor market
One approach to establishing the benefits of SE skills is to calculate shadow prices for specific behaviors. These can then be applied to interventions that enhance these specific behaviors. The most obvious shadow price is the value of SE skills in the labor market. If there is a clear SE metric that can be linked to earnings, it may be possible to derive a consistent value of the benefits of SEL interventions.
The literature on the association between SE skills and earnings is growing (Murnane, Willett, Braatz & Duhaldeborde, Reference Murnane, Willett, Braatz and Duhaldeborde2001; Waddell, Reference Waddell2006; Drago, Reference Drago2011). This evidence indicates strong positive impacts on earnings when SE skills are enhanced. Research evidence consistently finds strong associations between SE skills – broadly defined – and earnings. Using NLSY79, de Araujo and Lagos (Reference de Araujo and Lagos2013, p.1987) estimate that a “one standard deviation increase in [self-reported] self-esteem leads to a 30.46% increase in real wages.” This increase is mostly mediated through attainment, which is estimated to be 1.5 years greater for those with higher self-esteem. If we assume baseline returns to attainment at 10% per year, the estimated gain in earnings from a one standard deviation increase in self-esteem is therefore 15%, which is a very large gain in earnings. However, Drago (Reference Drago2011), also using NLSY79, finds smaller estimates of self-esteem (at 4%). Using NELS88, Segal (Reference Segal2013, p. 767) reports a one standard deviation increase in “[teacher-reported] misbehavior is associated with a 4% decrease in earnings” at age 28. Eren and Oxbeklik (Reference Eren and Oxbeklik2013), also using NELS88, employ the Rosenberg and Rotter scales in 10th grade and estimate that a one standard deviation increase in noncognitive ability is associated with an increase of 9% in earnings.Footnote 5
However, a number of definitional and methodological challenges remain. As noted above, SE skills can be defined in terms of psychological traits, behaviors, attitudes toward others, and performance on specific tasks. In turn, these constructs can be measured in different contexts (e.g., school vs. home) and using different instruments. Thus far, labor market research relies almost exclusively on the Rosenberg scale of self-esteem and Rotter scale for locus of control. These scales are rarely used in evaluations of particular interventions. It is therefore not possible to directly translate any impacts into gains in earnings.
There are also methodological challenges to identifying earnings gains from SE skills. First, typically only one measure of SE skills is applied; other traits – correlated with SE skills – may also be driving the association. de Araujo and Lagos (Reference de Araujo and Lagos2013) examine how earnings are influenced by self-esteem (their construct for SE skill); they find that self-esteem has no influence after controlling for locus of control. Second, SE skills are often measured simultaneously with earnings. Yet it seems plausible that someone with high earnings might infer they have high SE skills (or may have “bought” higher SE skills). In fact, de Araujo and Lagos (Reference de Araujo and Lagos2013) find that high self-esteem is jointly determined with wages.
A third challenge is to separate out the earnings gains from cognitive achievement or attainment and those from noncognitive attributes. Two related approaches are the Oaxaca–Ransom decomposition or factor structure analysis (see the summary in Thiel & Thomsen, Reference Thiel and Thomsen2013). Widely used in labor market studies, these approaches can separate out the returns to cognitive and noncognitive characteristics and they typically find some separable influence of noncognitive skills on earnings (Thiel & Thomsen, Reference Thiel and Thomsen2013, Table 4). However, the prior influence of noncognitive skills on cognitive skills also needs to be modeled in order to identify the full effect. An alternative is to compare individuals with very similar attributes. Fletcher (Reference Fletcher2013a ) estimates the returns to noncognitive skills using sibling fixed effects models but the results are not robust to model specification or sample subgroups. Applied more comprehensively using recent data, these models may reduce double-counting.
Therefore, the evidence does not, at present, yield a precise association between SE skills and earnings. Nevertheless, it is suggestive of powerful labor market returns to SE skills. To illustrate, we approximate the present value of lifetime earnings gain from a one standard deviation increase in SE skills. (We use one standard deviation for illustrative purposes; most interventions cannot yield effects this large.) Based on current lifetime earnings profiles from the American Community Survey and the Current Population Survey, the average present value lifetime earnings of a child who is currently in third grade would be $575,000.Footnote 6 These amounts represent how much a lifetime’s earnings are worth at third grade. Given the above evidence, if SEL (here measured as self-esteem) goes up by one standard deviation, earnings go up by 4% to 15% (net of additional schooling). A conservative estimate – using the weakest correlation between SE skills and earnings – would therefore yield earnings gains of $23,000. In other words, if an intervention raised a child’s SE skills at that age, this would be worth $23,000 in terms of gains in future productivity alone. These figures suggest a large benefit of SE skills although the actual estimate is only approximate and it is unlikely that many interventions can yield such large effects in practice.
3.3. Shadow pricing SE skills by education
Alternatively, it may be possible to calculate a shadow price based on how SE skills affect education levels; the researcher can then draw on the extensive research on the economic returns to education. Overall, research evidence typically shows a positive association between SE skills and education. In their review of 35 SEL interventions, Durlak et al. (Reference Durlak, Weissberg, Dymnicki, Taylor and Schellinger2011, Table 2) report an average effect size gain in achievement of 0.27. This achievement gain may in turn be assigned a shadow price.
Yet, associating SE skills with achievement is similarly problematic. Using achievement gains as the mediator of earnings gains is likely to undervalue SEL. As discussed above, SE skills almost certainly convey more diffuse and long-term behavioral and attitudinal benefits than achievement. Often, academic achievement gains fade-out within a short period. More emphatically, academic achievement per se may not be especially important for future lifetime outcomes and at some levels may even be inversely related to SE skills (as established in studies of high-school dropouts who pass the GED, see Heckman and LaFontaine (Reference Heckman and LaFontaine2006)). Recent research using longitudinal data by Heckman and Kautz (Reference Heckman and Kautz2012) describes a weak association between achievement and future life outcomes; Castex and Dechter (Reference Castex and Dechter2014) find that cognitive ability has actually declined as a determinant of wages over the last two decades. Heckman and Kautz (Reference Heckman and Kautz2012) also argue that SE skills and achievement as measured by standardized test scores are strongly confounded: because SE skills are expressible as behavior on tasks and taking an achievement test is a task, the higher achievement scores must also reflect higher SE skills. From an economic perspective, distinguishing (and hence avoiding double counting) the two constructs is challenging.
Ironically, focus on the cognitive gains of SEL programs might reinforce the idea that schools teach only “knowledge,” undermining the idea that schools ought to develop broader SE skills. Ideally, the educational value of SE skills should be measured more broadly than through individual achievement gains. This measurement should include students’ school behaviors and school attitudes (Zins, Bloodworth, Weissberg & Wahlberg, Reference Zins, Bloodworth, Weissberg and Wahlberg2007, Figure 1.4) as well as positive externalities in both the classroom (such as peer effects, teacher efficacy, or teacher retention) and school (such as school quality or school climate). Currently, these valuations are not available.Footnote 7
Despite these caveats, we approximately estimate the economic value of SE skills mediated through higher achievement for the individual student.Footnote 8 We adapt calculations of the earnings gains due to higher achievement from three separate sources (Hanushek, Reference Hanushek2006; Belfield & Levin, Reference Belfield and Levin2009; Chetty et al., Reference Chetty, Friedman, Hilger, Saez, Whitmore Schanzenbach and Yagan2011). These calculations are provided in our Web Appendix. The three sources yield different estimates of the returns to achievement but all amounts are significant. For a 0.27 standard deviation increase in achievement in third grade (the best estimate from Durlak et al. (Reference Durlak, Weissberg, Dymnicki, Taylor and Schellinger2011)), we estimate the present value earnings gain at $12,850. This estimate is the average from the three sources: the range is between $9550 and $18,620. If the achievement grade gain of 0.27 standard deviations is in eighth grade, the earnings gain is valued at $15,250. Hence, the economic benefits of SE skills, mediated through achievement gains, may be substantial.
3.4. Shadow prices for specific SE attributes
Other shadow prices may be applicable to BCA of SE interventions. One option is to derive a unit value for general youth delinquency that subsequently leads to adult delinquency. Published studies have estimated the shadow prices of an array of social “ills,” such as smoking, teenage pregnancy, child abuse, asthma, and being a career criminal (Maynard & Hoffman, Reference Maynard and Hoffman2008; Cohen & Piquero, Reference Cohen and Piquero2009, Table 12; and Cohen, Piquero & Jennings, Reference Cohen, Piquero and Jennings2010, Table 8); for shadow prices of ADHD during the intervention years, see Jones and Foster (Reference Jones and Foster2009).
However, these shadow prices need to be recalibrated to specific impacts before they can be applied to SEL interventions; the challenge is how to translate SE skills into any particular youth delinquency status. For example, Cohen and Piquero (Reference Cohen and Piquero2009, Table 12) have calculated the lifetime social burden per career criminal, one-time offender, high-school dropout, and drug user over the lifetime. But it is unclear how SE skills relate to criminal activity or how externalizing behaviors relate to drug use, for instance. In addition, this approach focuses only on the long-term consequences of SE skills; any immediate impacts would therefore have to be added in separately. Overall, this approach requires significant extrapolation and inference to produce accurate shadow prices.
Other shadow prices are not available. We identify two such prices that would help with BCA of SEL interventions. First, at this time, there is no mechanism for converting the Teacher Rating Scale (TRS) of the Behavioral Assessment System for Children (BASC) into economic metrics. The BASC-TRS is a widely used, validated scale for child behavior (Reynolds & Kamphaus, Reference Reynolds and Kamphaus2002, Chapter 3). Also, there is evidence on the fade-out function for BASC scores: studies have shown how aggressive and disruptive behavior in primary school predicts aggressive behavior through middle and high school and how different trajectories of aggressive and disruptive behavior are associated with negative life outcomes in youth and early adulthood.Footnote 9 The economic implications of BASC scores have not been investigated at all to our knowledge.
Second, there is limited evidence on the resource implications within schools from low SE skills (especially negative social behavior or student conduct problems). If SE skills are low and create disruptions and learning problems, both schools and public welfare agencies will require more resources: to hire more counselors or social services personnel; to compensate current personnel who are working with more delinquent students; and to cover other related expenses such as injuries, sick pay, insurance payments, and recruitment costs due to increased quits (Pouliakis & Theodossiou, Reference Pouliakis and Theodossiou2013). Students with low SE skills are more likely to be retained in grade, placed in special education, suspended, or expelled from school. All of these consequences impose additional costs, some of which might be averted if SE skills are enhanced.
3.5. Estimating the costs and benefits of SEL
In summary, standardized shadow prices would greatly help in making BCAs of SE interventions comparable. Yet, the use of a single SEL index – in terms of earnings, or mediated through education, or a general delinquency index – poses a number of methodological challenges.
Given this evidence base, BCAs will have to proceed by estimating shadow prices specific to each impact that have been enumerated in an impact evaluation (Lee et al., Reference Lee, Aos, Drake, Pennucci, Miller, Anderson and Burley2012). This approach at least ensures that each intervention is evaluated with respect to its intended objectives.Footnote 10 However, this approach undermines policymakers’ ability to compare across interventions and it increases saliency and prevalence risk.Footnote 11 It is possible to shadow price SE skills leading to higher labor market productivity either directly or via increased education. But it is very difficult to price out positive social behavior, conduct problems, emotional distress, and attitudes, all of which are identified as benefits of SEL. For behaviors and student conduct, it might be possible to derive shadow prices where these actions have clear economic consequences (e.g., a specific juvenile crime). Yet, research on the economic value of reducing emotional distress or on shaping attitudes is limited (see the discussions in Heckman & Kautz, Reference Heckman and Kautz2012; Borghans et al., Reference Borghans, Duckworth, Heckman and ter Weel2008). The saliency risk is that policymakers will go from no consideration of the economic value of SE to consideration of only those impacts which can be plausibly shadow priced. The prevalence risk is that interventions that itemize more impacts will generate more shadow prices and hence larger benefits. These risks are in addition to the risk of inaccurate shadow pricing.
4. Benefit-cost analysis of SEL interventions
4.1. Case study interventions
To advance the method and practice of BCA of SEL, we selected four school-level interventions as case studies. These interventions are summarized in Table 1. Full information on these four, as well as two additional interventions, is given in Belfield et al. (Reference Belfield, Bowden, Klapp, Levin, Shand and Zander2015). The primary criterion for selecting these interventions was that they had established impacts based on rigorous research studies (Durlak et al., Reference Durlak, Weissberg, Dymnicki, Taylor and Schellinger2011). In addition, interventions were selected with the expectation that costs data could be obtained and that benefits could be assigned shadow prices. Finally, interventions operating across a range of dimensions were selected, so as to illustrate the variation in efforts to enhance SEL. As such, the case studies are not necessarily representative of the entire set of effective SE interventions.
Table 1 Selected social and emotional learning interventions.
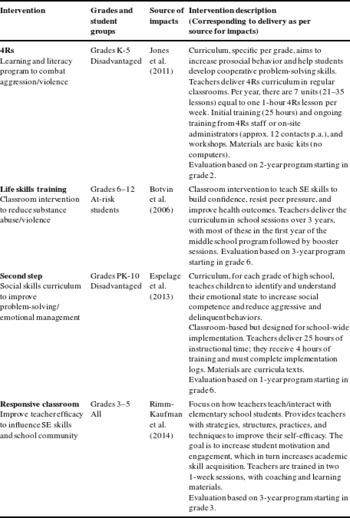
We distinguish two purposes for BCA of social programs. One is to identify the most efficient social investment from the set of options. The other is to calculate the “best estimate” of net present value for each program, according to the program’s objectives and outcomes. We emphasize that our purpose is the latter: we calculate the expected net present value for each program based on our knowledge of its likely impacts. The former purpose – comparative BCA – would necessitate harmonized assumptions with regard to length of intervention, program scale, duration of impacts, and shadow prices. This harmony is not practicable; as shown in Table 1, the interventions are delivered to different grades, for different durations, and with different resources.Footnote 12 This heterogeneity has implications for the cost per participant as well as the scale at which the interventions can be delivered.
More importantly, the benefits of these interventions are highly distinct. Indeed, we believe such distinctiveness is an under-investigated aspect of BCA for social programs. To address this issue, we propose the use of “benefit maps” showing the array of impacts, how these are measured and whether these impacts can be given shadow prices. (As we show below, these benefit maps can then be linked to our economic framework.) Table 2 shows the benefit maps for the four selected interventions. Outcomes are grouped into four categories: understanding and handling feelings; delinquency; health-related; and educational. Within these categories, the interventions were evaluated across a range of specific outcomes. The class of respondents to each instrument for measuring outcomes are reported, along with an indicator for whether they can be shadow priced. (The instruments used to measure these outcomes were not consistent across studies.) All outcomes are reported, regardless of statistical significance. Notably, few of these outcomes can be monetized (indicated by asterisks); and more than half of the outcomes of each intervention cannot be calculated. Looking across the interventions, the outcomes vary significantly and in fact there is no single common outcome across all four interventions. Overall, benefit maps illustrate the extent to which social interventions in general and these SE interventions in particular can legitimately either be evaluated or compared with BCA.
Table 2 Benefits maps for four SEL interventions.
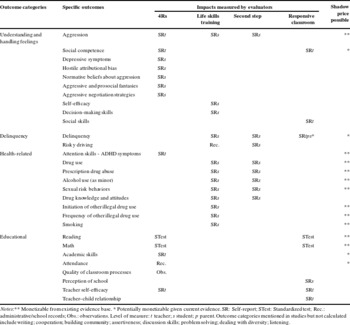
Notes:** Monetizable from existing evidence base. * Potentially monetizable given current evidence. SR: Self-report; STest: Standardized test; Rec.: administrative/school records; Obs.: observations. Level of measure: $t$
teacher;
$t$
teacher; $s$
student;
$s$
student; $p$
parent. Outcome categories mentioned in studies but not calculated include writing; cooperation; building community; assertiveness; discussion skills; problem solving; dealing with diversity; listening.
$p$
parent. Outcome categories mentioned in studies but not calculated include writing; cooperation; building community; assertiveness; discussion skills; problem solving; dealing with diversity; listening.
Hence, these BCAs are best estimates of the NPV for each intervention given the existing evidence.Footnote 13 (Information on the calculations is given in the Table Notes; detailed information on the costs and benefit calculations are given in a web appendix.Footnote 14 ) However, we recognize that harmonized assumptions are helpful and so we report results in a standard way. All dollar amounts are reported as present values from the year in which the intervention began with a discount rate of 3.5% and in 2013 dollars. We report costs and benefits as if each program was delivered to 100 students. Also, unless otherwise stated, the general ratchet function is assumed to be zero (i.e., the impacts of the program only occur in the year in which they are measured), and the fade-out function is zero (i.e., the benefits are assumed to persist through youth and adulthood).Footnote 15
Finally, we perform a standardized set of sensitivity analyses across the interventions. For each intervention, these analyses apply: an alternative estimate of costs; an upper/lower estimate of impacts; an upper/lower estimate of benefits; and an alternative fade-out rate. For these sensitivity tests, we focus on the distribution of net present values. These sensitivity tests can in general mitigate the methodological and empirical challenges.
4.2. 4Rs
The 4Rs Program (Reading, Writing, Respect, & Resolution) focuses on SEL and literacy development in grades K-5, with an overall goal of ameliorating aggression and violence at an early age by integrating SE skills into language arts instruction. 4Rs has been found to be effective at reducing aggression. In a recent longitudinal evaluation of relatively disadvantaged third-grade children, Jones et al. (Reference Jones, Brown and Lawrence Aber2011) found improvements of 4Rs compared to “business-as-usual” elementary schooling on: student self-reports on hostile attributional bias, aggressive interpersonal negotiation strategies and depression; teacher reports of attention skills, aggressive and socially competent behavior; and on math/reading achievement. We apply these results to calculate the costs and benefits of 4Rs.
Costs. We estimate the incremental costs of introducing the 4Rs program into existing school activities. These estimates are adapted from Long, Brown, Jones, Aber and Yates (Reference Long, Brown, Jones, Aber and Yates2014, Tables 3 and 4).Footnote 16 The analysis by Long et al. (Reference Long, Brown, Jones, Aber and Yates2014) used the ingredients method and high-quality data to calculate a whole school costs analysis of 4Rs across grades.
As noted above, a critical feature of costs analysis is that the costs must be measured in relation to outcomes. For 4Rs, the issue is whether or not to include teaching time as part of the program’s incremental costs. The program was intended to fit into the standard literacy block of the school curriculum in an equivalent classroom space and serve as a partial substitute for regular literacy instruction. The teaching time – and classroom space – for 4Rs is therefore not incremental; the only difference was in how students were taught. However, this assumption depends on how the impacts of 4Rs are measured: if only SE skills are measured, then we might expect a big impact (because the control group is not being taught SE skills); but we should also net out any gains to the control group (in learning other skills). We report resource costs both with and without instructional time (and the related instructional facilities costs). Including instructional time assumes that 4Rs only influences SE skills and not other skills. Excluding instructional time completely implies that 4Rs manages to enhance SE skills whilst sustaining all other skills at the same standard as the business-as-usual approach.
For the 2-year program providing 4Rs to a cohort of 630 participants in third and fourth grade, the present value total cost is $262,300 if instructional costs are excluded; and $426,600 if instructional costs are included. This is a cost differential of 38%. The cost per student is $680 including instructional time/facilities ; and $420 excluding instructional time/facilities.
Benefits. As shown in the benefit map in Table 2, there are many impacts from 4Rs but only a few can be potentially translated into money benefits. Here we are only able to consider three behaviors. To correspond with the costs analysis, we measure these behaviors at the end of 2 years of the intervention, that is, in spring of fourth grade. Our focus is on teacher reports of ADHD symptoms, social competence, and aggressive behavior, all of which yield statistically significant effects after two years (Jones et al., Reference Jones, Brown and Lawrence Aber2011, Table 3).Footnote 17 The effect sizes are 0.12, for reduced ADHD symptoms; 0.14, for social competence; and 0.13, for reduced aggression. These effect size changes are equivalent to moving from the median position to the 44th to 45th percentile of outcomes (i.e., fewer adverse outcomes). For the baseline estimates, we apply the average burden assuming only one behavioral outcome; we do not count each of the three separate outcomes as they are almost certainly identifying overlapping behavioral conditions (and so would lead to significant double counting).
Shadow prices for conduct problems (behavior, social competence, and aggression) are derived using the cost-of-illness or defensive expenditures method. That is, the shadow prices are based on what society currently spends on these conditions through the health care and educational system.Footnote 18 For the burden of social competence and aggression, we take the average of spending on oppositional defiant disorder (ODD), conduct disorder (CD), and other deviant conduct; these shadow prices are from Foster et al. (Reference Foster and Jones2005). These prices are not perfect: they are based on defensive expenditures to alleviate delinquency, when the appropriate basis is the expenditure to eliminate delinquency; also, these prices do not include the educational burden of school delinquency (e.g., on the teacher or other students). However, both these caveats suggest that the true burden of delinquency is higher than these shadow prices and so our estimates are conservative (for a discussion of under-estimation using the defensive expenditures method see Boardman, Greenberg, Vining & Weimer, Reference Boardman, Greenberg, Vining and Weimer2011, Chapters 5, 11). Applying this price, adjusted for the incidence of delinquency, yields a benefit per 4Rs participant of $1770.
We apply a series of sensitivity tests to both impacts and benefits. Specifically, we assume that the benefits of 4Rs fade out at a rate of 10% per annum after the intervention is ended. To check the benefits, we apply the estimate of the lifetime costs per at-risk youth from Cohen and Piquero (Reference Cohen and Piquero2009), again adjusted for the incidence of such youth in the general population.Footnote 19 This yields a much higher benefit. In contrast, assuming a lower shadow price for conduct disorder (using the less burdensome estimate of such disorder from Foster et al., Reference Foster and Jones2005), the benefits of 4Rs are considerably lower. Finally, we derive upper and lower estimates of the impacts of 4Rs. Assuming that 4Rs only affects ADHD, the benefits are lower (because of the lower incidence of ADHD across the student population). Finally, the benefits are considerably larger if we assume that the ratchet effect of 4Rs is 50%. That is, the impacts found at the end of the second year would have also been found at the end of the first year (at half the size, i.e., proportionately so).Footnote 20
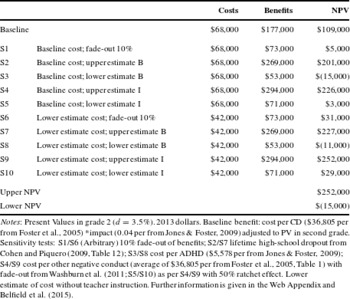
Benefit-Cost Results for 4Rs. The benefit-cost comparisons for delivering 4Rs to 100 students are given in Table 3. To be conservative, the cost estimate including instructional time is used as the baseline. Therefore, the net gain per 100 students expressed in present values in second grade is $109,000. This NPV is very large.
Table 3 Benefit-cost results for 4Rs per 100 students.
Notes: Present Values in grade 2 ( $d=3.5\%$
). 2013 dollars. Baseline benefit: cost per CD ($36,805 per from Foster et al., Reference Foster and Jones2005) *impact (0.04 per from Jones & Foster, Reference Jones and Foster2009) adjusted to PV in second grade. Sensitivity tests: S1/S6 (Arbitrary) 10% fade-out of benefits; S2/S7 lifetime high-school dropout from Cohen and Piquero (Reference Cohen and Piquero2009, Table 12); S3/S8 cost per ADHD ($5,578 per from Jones & Foster, Reference Jones and Foster2009); S4/S9 cost per other negative conduct (average of $36,805 per from Foster et al., Reference Foster and Jones2005, Table 1) with fade-out from Washburn et al. (Reference Washburn, Acock, Vuchinich, Snyder, Li, Ji, Day, DuBois and Flay2011; S5/S10) as per S4/S9 with 50% ratchet effect. Lower estimate of cost without teacher instruction. Further information is given in the Web Appendix and Belfield et al. (Reference Belfield, Bowden, Klapp, Levin, Shand and Zander2015).
$d=3.5\%$
). 2013 dollars. Baseline benefit: cost per CD ($36,805 per from Foster et al., Reference Foster and Jones2005) *impact (0.04 per from Jones & Foster, Reference Jones and Foster2009) adjusted to PV in second grade. Sensitivity tests: S1/S6 (Arbitrary) 10% fade-out of benefits; S2/S7 lifetime high-school dropout from Cohen and Piquero (Reference Cohen and Piquero2009, Table 12); S3/S8 cost per ADHD ($5,578 per from Jones & Foster, Reference Jones and Foster2009); S4/S9 cost per other negative conduct (average of $36,805 per from Foster et al., Reference Foster and Jones2005, Table 1) with fade-out from Washburn et al. (Reference Washburn, Acock, Vuchinich, Snyder, Li, Ji, Day, DuBois and Flay2011; S5/S10) as per S4/S9 with 50% ratchet effect. Lower estimate of cost without teacher instruction. Further information is given in the Web Appendix and Belfield et al. (Reference Belfield, Bowden, Klapp, Levin, Shand and Zander2015).
The results for the ten sensitivity tests are given in the lower panel of Table 3. Five tests are based on one set of costs; five based on the other set of costs. We focus on the range of NPVs rather than each test. So, under a very conservative assumption about the benefits of 4Rs, it is possible that the net present value is negative. However, it is also possible that the net present value is as high as $252,000 (if we assume that the intervention has durable effects into adulthood). Given the narrow way in which the economic value of 4Rs has been calculated, it is likely that the net present value is closer to the upper range of the results in Table 3.
4.3. Life skills training
Life Skills Training is a school-based classroom intervention to reduce substance abuse and violence amongst at-risk students in middle and/or high school. LST teaches SE skills to generally improve SE competence to reduce anxiety and improve a range of health outcomes. A series of impact evaluations of LST have examined a range of effects, including reductions in crime, smoking initiation, substance abuse, and risky behaviors (Botvin et al., Reference Botvin, Griffin and Nichols2006; Spoth, Randall, Trudeau, Shin & Redmond, Reference Spoth, Randall, Trudeau, Shin and Redmond2008; Griffin, Samuolis & Wiliams, Reference Griffin, Samuolis and Wiliams2011; Griffin, Botvin & Nichols, Reference Griffin, Botvin and Nichols2006). For each impact, LST is statistically significantly associated with lower delinquency. As discussed above, two BCAs of LST have already been conducted and although these analyses differ significantly in method, both report very high benefit-cost ratios.Footnote 21
Costs. Based on descriptive reports of LST, we calculate the costs by adapting the ingredients identified by Miller and Hendrie (2008).Footnote 22 Personnel ingredients are based on time spent teaching LST, as well as time on training. We explicitly include costs for personnel time for program delivery. Other ingredients include materials and subsistence for teachers.Footnote 23 We estimate the cost of 3 years of LST at $130 per student. If the training costs for LST are in person rather than online, the cost per student is $160. These costs are very low because LST is a very light-touch program.
Benefits. Our estimate of benefits is derived from impacts reported in Botvin et al. (Reference Botvin, Griffin and Nichols2006). This study identified a statistically significant reduction in delinquency and fighting after 1 year of LST for sixth-grade students. At baseline, 53% of the combined intervention and control groups displayed any of these delinquent behaviors, with no statistically significant differences between the groups. After LST, the delinquency rate fell by 25% (to 39% of the LST group).
We shadow price the immediate monetary consequences (as the program is only 1 year, there is no ratchet effect). We then estimate lifetime impacts assuming that these impacts persist through high school. We apply the estimated burdens in Foster et al. (Reference Foster and Jones2005) per student with conduct disorder, adjusted for the incidence of students who exhibit this conduct.Footnote 24 Assuming this disorder rate falls by 25%, the expected value benefit is $57,000.
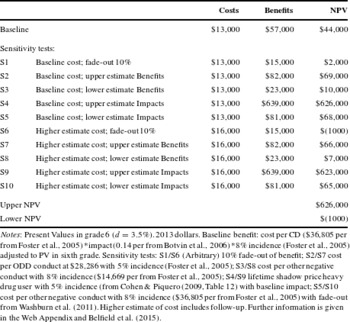
We apply the ten sensitivity tests for fade-out, benefits, and impacts as for the prior intervention. (Details are provided in the Web Appendix.) As shown in the bottom panel of Table 4, the benefits of LST are sensitivity to fade-out: if the intervention fades out at a rate of 10% per year, the benefits are valued at $15,000. However, if we assume an upper value estimate of impacts, the benefits are extremely large (at $639,000).Footnote 25
Table 4 Benefit-cost results for LST per 100 students.
Notes: Present Values in grade 6 ( $d=3.5\%$
). 2013 dollars. Baseline benefit: cost per CD ($36,805 per from Foster et al., Reference Foster and Jones2005) *impact (0.14 per from Botvin et al., Reference Botvin, Griffin and Nichols2006) *8% incidence (Foster et al., Reference Foster and Jones2005) adjusted to PV in sixth grade. Sensitivity tests: S1/S6 (Arbitrary) 10% fade-out of benefit; S2/S7 cost per ODD conduct at $28,286 with 5% incidence (Foster et al., Reference Foster and Jones2005); S3/S8 cost per other negative conduct with 8% incidence ($14,669 per from Foster et al., Reference Foster and Jones2005); S4/S9 lifetime shadow price heavy drug user with 5% incidence (from Cohen & Piquero (Reference Cohen and Piquero2009, Table 12) with baseline impact; S5/S10 cost per other negative conduct with 8% incidence ($36,805 per from Foster et al., Reference Foster and Jones2005) with fade-out from Washburn et al. (Reference Washburn, Acock, Vuchinich, Snyder, Li, Ji, Day, DuBois and Flay2011). Higher estimate of cost includes follow-up. Further information is given in the Web Appendix and Belfield et al. (Reference Belfield, Bowden, Klapp, Levin, Shand and Zander2015).
$d=3.5\%$
). 2013 dollars. Baseline benefit: cost per CD ($36,805 per from Foster et al., Reference Foster and Jones2005) *impact (0.14 per from Botvin et al., Reference Botvin, Griffin and Nichols2006) *8% incidence (Foster et al., Reference Foster and Jones2005) adjusted to PV in sixth grade. Sensitivity tests: S1/S6 (Arbitrary) 10% fade-out of benefit; S2/S7 cost per ODD conduct at $28,286 with 5% incidence (Foster et al., Reference Foster and Jones2005); S3/S8 cost per other negative conduct with 8% incidence ($14,669 per from Foster et al., Reference Foster and Jones2005); S4/S9 lifetime shadow price heavy drug user with 5% incidence (from Cohen & Piquero (Reference Cohen and Piquero2009, Table 12) with baseline impact; S5/S10 cost per other negative conduct with 8% incidence ($36,805 per from Foster et al., Reference Foster and Jones2005) with fade-out from Washburn et al. (Reference Washburn, Acock, Vuchinich, Snyder, Li, Ji, Day, DuBois and Flay2011). Higher estimate of cost includes follow-up. Further information is given in the Web Appendix and Belfield et al. (Reference Belfield, Bowden, Klapp, Levin, Shand and Zander2015).
Benefit-Cost Results for LST. The net benefits of LST – assuming the program is delivered to 100 participants – are reported in Table 4. The costs are $13,000 and the benefits are $57,000. Thus, consistent with earlier studies, we find a strongly positive return to LST.
The lower panel of Table 4 shows the results from the ten sensitivity tests. In one scenario – with the upper estimate of costs and the fade-out of 10% p.a. – the net present value for LST is negative. Hence, despite being inexpensive, the aggregate economic value of LST depends on how durable its effects are. However, LST potentially has a very high yield if it diverts at-risk youth from juvenile and adult crime: the upper estimate of the net present value is $626,000. Overall, we note that the results from these sensitivity tests are not very precise. Of course, given the very low cost of LST and its targeting of at-risk students, the program does not have to be especially effective in order to generate a positive economic value.
4.4. Second Step
Second Step is a classroom-based social skills curriculum for preschool through the junior year of high school, with a distinct curriculum for each grade. The program builds on cognitive behavioral intervention models and consists of interactive lessons that relate to problem-solving and emotional management. The overall goal is for children to identify and understand their emotional state and to manage and communicate these emotions appropriately and so increase social competence and reduce aggressive and delinquent behaviors. Here we draw on the impacts in Espelage et al. (Reference Espelage, Low, Polanin and Brown2013).Footnote 26 This study presents first-year results from a 3-year school-randomized controlled trial in 36 schools. This study utilizes a sample of sixth-grade students who received the 15-lesson sixth-grade curriculum. Espelage et al. (Reference Espelage, Low, Polanin and Brown2013) identified a substantial reduction in self-reported physical aggression after 1 year.
Costs. We estimate the costs of replicating this implementation of the Second Step program based primarily on descriptions of the program.Footnote 27 All cost estimates exclude any costs associated with the conduct of research activities and reflect only program implementation costs throughout the course of the first year of implementation. As described in Espelage et al. (Reference Espelage, Low, Polanin and Brown2013), Second Step requires 4 hours of training, and teachers also completed implementation logs to see what parts of the curriculum had been implemented. Given hourly rates for teacher salaries as well as trainer costs, we estimate the cost of Second Step implementation at $50 per year per student when instructional time is not accounted for. If instructional time is included, costs are significantly higher. Second Step involves up to 25 instructional hours per year, which amounts to $390 per student. Overall, therefore, the total resource requirement for Second Step, including instructional costs, is $440. As with other SEL interventions, the critical costing issue is whether instructional time is displaced or supplemented.
Benefits. The array of outcomes and benefits of Second Step are shown in the benefits map (Table 2). These outcomes encompass substance abuse, delinquency, and changes in sexual health status although the extent to which they overlap or confound each other is unknown. Therefore, we calculate a shadow price for a single, specific behavior for which a plausible shadow price exists: aggression. Espelage et al. (Reference Espelage, Low, Polanin and Brown2013) identified a 42% reduction in self-reported physical aggression. Using estimates from Foster et al. (Reference Foster and Jones2005) for the medical resources required to address cases of aggression, this outcome yields benefits of $3200.Footnote 28
Sensitivity testing illustrates the range of possible net present values for Second Step. The first test assumes the program fades out at a rate of 10% each year. Subsequent tests assume higher and lower benefits and impacts (based on shadow prices and the range of impacts reported in Espelage et al. (Reference Espelage, Low, Polanin and Brown2013)). Details of these tests are given in the Web Appendix.
Benefit-Cost Results for Second Step. The costs and net benefits for Second Step are reported in Table 5. Assuming that the costs of instruction are counted, the program costs for 1 year are $440. The benefits in terms of reduced aggression are $3200. The baseline estimate therefore yields a net benefit of $276,000 per 100 participants.
Table 5 Benefit-cost results for second step per 100 students.
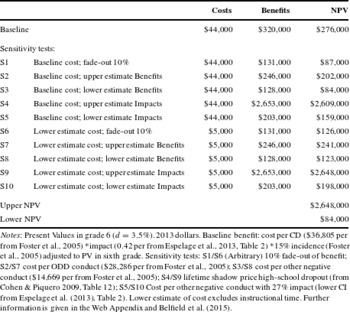
Notes: Present Values in grade 6 ( $d=3.5\%$
). 2013 dollars. Baseline benefit: cost per CD ($36,805 per from Foster et al., Reference Foster and Jones2005) *impact (0.42 per from Espelage et al., Reference Espelage, Low, Polanin and Brown2013, Table 2) *15% incidence (Foster et al., Reference Foster and Jones2005) adjusted to PV in sixth grade. Sensitivity tests: S1/S6 (Arbitrary) 10% fade-out of benefit; S2/S7 cost per ODD conduct ($28,286 per from Foster et al., Reference Foster and Jones2005); S3/S8 cost per other negative conduct ($14,669 per from Foster et al., Reference Foster and Jones2005); S4/S9 lifetime shadow price high-school dropout (from Cohen & Piquero Reference Cohen and Piquero2009, Table 12); S5/S10 Cost per other negative conduct with 27% impact (lower CI from Espelage et al. (Reference Espelage, Low, Polanin and Brown2013), Table 2). Lower estimate of cost excludes instructional time. Further information is given in the Web Appendix and Belfield et al. (Reference Belfield, Bowden, Klapp, Levin, Shand and Zander2015).
$d=3.5\%$
). 2013 dollars. Baseline benefit: cost per CD ($36,805 per from Foster et al., Reference Foster and Jones2005) *impact (0.42 per from Espelage et al., Reference Espelage, Low, Polanin and Brown2013, Table 2) *15% incidence (Foster et al., Reference Foster and Jones2005) adjusted to PV in sixth grade. Sensitivity tests: S1/S6 (Arbitrary) 10% fade-out of benefit; S2/S7 cost per ODD conduct ($28,286 per from Foster et al., Reference Foster and Jones2005); S3/S8 cost per other negative conduct ($14,669 per from Foster et al., Reference Foster and Jones2005); S4/S9 lifetime shadow price high-school dropout (from Cohen & Piquero Reference Cohen and Piquero2009, Table 12); S5/S10 Cost per other negative conduct with 27% impact (lower CI from Espelage et al. (Reference Espelage, Low, Polanin and Brown2013), Table 2). Lower estimate of cost excludes instructional time. Further information is given in the Web Appendix and Belfield et al. (Reference Belfield, Bowden, Klapp, Levin, Shand and Zander2015).
The sensitivity tests show that Second Step is likely to yield positive net benefits under a range of scenarios. Even the most conservative assumption yields a net present value of $84,000; the upper range net present value is $2.7 million. As with other interventions, these net present values are very imprecise. They also appear very large given the size of the investment in Second Step. This is especially evident if we assume that achievement and other school outcomes are unchanged – even as the level of aggression is much lower – then the appropriate cost measure should exclude instructional costs. To the degree that a calmer environment reduces the need for discipline and disruption and makes the school safer, it is even conceivable that academic achievement could increase. In this case, the net resource requirement for Second Step is very small and the net present value extremely large. Fundamentally, the shadow price of delinquent behavior is so high that it appears that any intervention – even one that is only modestly effective – will have a high net present value.
4.5. Responsive classroom
Responsive Classroom is a pedagogic approach that focuses on how teachers both teach and interact with elementary school students. The goal is to provide teachers with strategies, structures, practices, and techniques to improve their self-efficacy, to impact student SE and other outcomes, and to build a strong school community. Early research found that the program improved social skills and reduced problem behaviors (Elliot, Reference Elliot1999). More recently, a quasi-experimental evaluation of Responsive Classroom found that the program positively impacted academic performance, teacher self-efficacy, children’s social skills, and children’s perception of school (Rimm-Kaufman, Fan, Chiu & You, Reference Rimm-Kaufman, Fan, Chiu and You2007; Rimm-Kaufman & Chiu, Reference Rimm-Kaufman and Chiu2007; see also CASEL, 2013). For our benefit-cost evaluation we use evidence from a recent randomized control trial by Rimm-Kaufman et al. (Reference Rimm-Kaufman, Larsen, Baroody, Curby, Ko, Thomas, Merritt, Abry and DeCoster2014). The sample included 24 schools and 1,467 third-grade students. Overall, the evaluation was not able to detect a statistically significant impact on fifth-grade achievement (Rimm-Kaufman et al., Reference Rimm-Kaufman, Larsen, Baroody, Curby, Ko, Thomas, Merritt, Abry and DeCoster2014: Table 4). However, there were statistically significant achievement gains when the program was implemented with fidelity, with effect size gains of 0.26 in math and 0.30 in reading (Rimm-Kaufman et al., Reference Rimm-Kaufman, Larsen, Baroody, Curby, Ko, Thomas, Merritt, Abry and DeCoster2014: Table 5). Therefore, we perform BCA only for the schools in which the program was faithfully implemented, with the express caution that our findings should not be viewed as representative of typical or average schools.
Costs. We estimated the ingredients needed to replicate a faithful implementation of Responsive Classroom using data provided by the impact evaluators.Footnote 29 In addition, supplementary information was collected from the developers regarding the training provided and how the program has evolved over time. (We were unable to interview school-level staff.) The largest input category was personnel, including summer training sessions for teachers (and principals), along with coaching, online support, and workshops provided by the developer. Facilities and materials costs were also included (Belfield et al., Reference Belfield, Bowden, Klapp, Levin, Shand and Zander2015). The total cost of Responsive Classroom relative to business as usual is estimated at $1.61 million over 3 years across the 1,467 participants. This yields an average program cost of $1100.
As an alternative estimate of costs we include resource time and classroom space for the morning meeting component of Responsive Classroom. The morning meeting is a 20-minute class meeting designed to build community, teach social skills, and reinforce academic skills and is intended to be held daily. Although these meetings are only one aspect of the program, their frequency strongly influences costs. Including these meetings increases the cost to $2,160 per participant.Footnote 30
Benefits. The benefits map in Table 2 shows that, based on evidence from several studies, there are potentially many important outcomes from Responsive Classroom. These include understanding and handling of feelings (measured as social skills, social competence, and school perception) and delinquency, as well as corollary outcomes for teachers (self-efficacy and relationship with the child). However, it is not possible to monetize these impacts either because they are outside the evaluation by Rimm-Kaufman et al. (Reference Rimm-Kaufman, Larsen, Baroody, Curby, Ko, Thomas, Merritt, Abry and DeCoster2014) or because no shadow prices are currently available. Therefore, and despite the reservations noted above, we estimate the economic value of achievement gains assuming the program is faithfully implemented.Footnote 31 .
The present value earnings gain from Responsive Classroom is calculated as per Section 3: we take the average gain from three separate studies of the achievement-earnings gradient and apply this to an effect size gain of 0.26 in fifth grade (the lower bound of gains in math and reading). This present value earnings gain equals $13,320 per participant. This value assumes that the gains from Responsive Classroom are permanent (until age 18), even though some interventions experience test score fade-out (e.g., Heckman & Kautz, Reference Heckman and Kautz2012). For sensitivity tests, we apply a 10% fade-out rate, use an upper/lower bound earnings gain, and alternative impacts from Rimm-Kaufman et al. (Reference Rimm-Kaufman, Larsen, Baroody, Curby, Ko, Thomas, Merritt, Abry and DeCoster2014, Table 3). These tests yield benefits per participant in the range of $6660 to$22,050.
Benefit-Cost Results for Responsive Classroom. Table 6 shows the benefit-cost results for Responsive Classroom per 100 students. With costs of $110,000 and benefits of $1,332,000, the net present value is $1.22 million.
Table 6 Benefit-cost results for responsive classroom per 100 students.
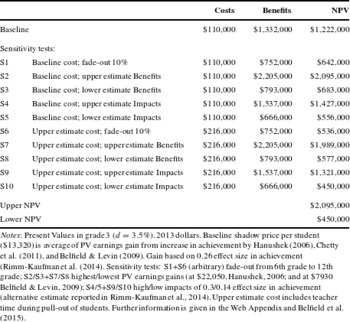
Notes: Present Values in grade 3 ( $d=3.5\%$
). 2013 dollars. Baseline shadow price per student ($13,320) is average of PV earnings gain from increase in achievement by Hanushek (Reference Hanushek2006), Chetty et al. (Reference Chetty, Friedman, Hilger, Saez, Whitmore Schanzenbach and Yagan2011), and Belfield & Levin (Reference Belfield and Levin2009). Gain based on 0.26 effect size in achievement (Rimm-Kaufman et al. (Reference Rimm-Kaufman, Larsen, Baroody, Curby, Ko, Thomas, Merritt, Abry and DeCoster2014). Sensitivity tests: S1+S6 (arbitrary) fade-out from 6th grade to 12th grade; S2/S3+S7/S8 highest/lowest PV earnings gains (at $22,050, Hanushek, Reference Hanushek2006; and at $7930 Belfield & Levin, Reference Belfield and Levin2009); S4/5+S9/S10 high/low impacts of 0.3/0.14 effect size in achievement (alternative estimate reported in Rimm-Kaufman et al., Reference Rimm-Kaufman, Larsen, Baroody, Curby, Ko, Thomas, Merritt, Abry and DeCoster2014). Upper estimate cost includes teacher time during pull-out of students. Further information is given in the Web Appendix and Belfield et al. (Reference Belfield, Bowden, Klapp, Levin, Shand and Zander2015).
$d=3.5\%$
). 2013 dollars. Baseline shadow price per student ($13,320) is average of PV earnings gain from increase in achievement by Hanushek (Reference Hanushek2006), Chetty et al. (Reference Chetty, Friedman, Hilger, Saez, Whitmore Schanzenbach and Yagan2011), and Belfield & Levin (Reference Belfield and Levin2009). Gain based on 0.26 effect size in achievement (Rimm-Kaufman et al. (Reference Rimm-Kaufman, Larsen, Baroody, Curby, Ko, Thomas, Merritt, Abry and DeCoster2014). Sensitivity tests: S1+S6 (arbitrary) fade-out from 6th grade to 12th grade; S2/S3+S7/S8 highest/lowest PV earnings gains (at $22,050, Hanushek, Reference Hanushek2006; and at $7930 Belfield & Levin, Reference Belfield and Levin2009); S4/5+S9/S10 high/low impacts of 0.3/0.14 effect size in achievement (alternative estimate reported in Rimm-Kaufman et al., Reference Rimm-Kaufman, Larsen, Baroody, Curby, Ko, Thomas, Merritt, Abry and DeCoster2014). Upper estimate cost includes teacher time during pull-out of students. Further information is given in the Web Appendix and Belfield et al. (Reference Belfield, Bowden, Klapp, Levin, Shand and Zander2015).
The ten sensitivity tests in the lower panel of Table 6 illustrate how the net present value varies. The average net present value across the ten tests is close to the baseline but more important is the range, which varies from $0.45 million to $2.1 million. Thus, across these tests the net present value appears to be strongly positive, even allowing for the omission of a large set of benefits and relying on an imprecise metric (achievement) for calculating benefits.
4.6. Benefits and costs of SE interventions
We draw several conclusions from these case study BCAs. We emphasize that these interventions are not representative of SEL generally.
On the cost side, we note that these are inexpensive interventions, both in absolute terms and relative to the SE challenges they attempt to address. The interventions are in part low cost because they are of short duration. Yet, the resource requirements depend critically on whether the interventions displace or supplement regular classroom instruction. If they are displacements, the costs are very low, but there is an important question as to what outcomes are being sacrificed when resources are transferred away from other interventions. On the benefit side, we find that most impacts are very valuable even as the shadow prices are very imprecise. This conclusion is reinforced by looking at the benefit maps: these show how few impacts can be monetized, either immediately or over the long term.
When costs and benefits are combined together, these SEL interventions easily pass a benefit-cost test. However, it is not appropriate to compare the net present values among the interventions. Leaving aside heterogeneity in the populations served, the interventions measure different impacts and it is not obvious that the most important impacts have been shadow priced.
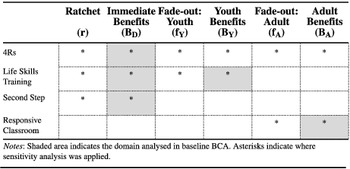
Table 7 illustrates the application of the BCA framework to the four interventions. To emphasize, the ultimate goal is to provide a policymaker with the best available BCA given the existing evidence base. Our methodological goal was to show how well this could be done and whether interventions can be compared. As shown in Table 7, to meet the ultimate goal requires application of the BCA framework in different ways for each intervention. For 4Rs, our baseline estimate rests on the immediate benefits, with sensitivity testing applied to the ratchet function, immediate benefits, and both youth/adult fade-out function and benefits. For LST, our baseline estimate include both immediate and youth benefits, with sensitivity testing of these components and the ratchet function. For Second Step, only the immediate benefits are counted and are subject to sensitivity testing. Finally, for Responsive Classroom, the BCA is based off the adult benefits. Ideally, each intervention would be evaluated based on evidence for all three classes of benefits and with consistent assumptions about the ratchet and fade-out functions. We hope that these examples, in conjunction with the framework and benefit maps, will help guide further research on the economic value of SEL interventions.
Table 7 Application of BCA framework to SEL interventions.
5. Developing methods and evidence for economic evaluations of SEL
Our analyses highlight the substantial amount of research – both methodological and empirical – that is needed in order to validate SEL as an economic investment. First, the BCA method needs to be applied rigorously and in an expanded form: estimation of both the costs and benefits of SEL raises substantial empirical and methodological challenges. Second, more empirical evidence is needed on the benefits of SEL. More evidence would allow for more confidence in the overall conclusions – do SEL interventions pass a BCA test? – and in comparative analysis – which interventions yield the highest returns?
On the costs side, the ingredients method of calculation is straightforward (although we have noted that it is rarely applied to SE interventions). As with other educational interventions, cost comparisons are hampered by differences in program scale and where implementation fidelity is a concern. However, few evaluations give descriptions in comparative terms, that is, how the intervention differs from business as usual, and this is especially critical for SE interventions. If treatment contrast is not well-documented, it is very difficult to calculate incremental costs with respect to a given set of outcomes. The primary example where this difficulty arises is with in-class treatments and the extent to which these are a substitute for, or an addition to, regular classroom instruction that is intended to boost achievement. The link between achievement and SE skills is complex and potentially confounding. High achievement may cause high SE skills, for example, by raising self-respect and a sense of control; the opposite association may hold (as argued by Heckman & Kautz, Reference Heckman and Kautz2012); or they may be mutually determined (Garcia, Reference Garcia2014). The trade-off between teaching SE skills and achievement needs to be explicitly modeled. Otherwise, it is unclear whether to calculate the costs of boosting achievement alongside or net of the costs of boosting SE skills.
On the benefits side, we note several challenges. Fundamentally, if studies do not identify changes in SE skills using a valid method, then we cannot assume any change in SE skills or subsequent behaviors. Even some of the highest quality research can be questioned. But we assume that this research does genuinely identify changes in SE skills and that these skills are substantively meaningful and predictive of behaviors beyond the duration of the intervention. Also, we have to make the most plausible assumptions, recognizing that if these assumptions are not correct then the results of the BCAs will not be correct. Certainly, across SE interventions, outcomes are rarely measured in a consistent way. As our case studies illustrate, evaluations vary in how many domains are measured and what scales are used for measurement. This increases the saliency and prevalence risk, as well as increasing the potential for mismeasurement. It also means that, instead of applying consistent or harmonized shadow pricing techniques, the analyst must build each economic case in idiosyncratic fashion. In addition, evaluations are often not clear how persistent the outcomes are. Some programs may affect outcomes in a very “fast-acting” way. Some programs may have effects that endure over a long time period. Both types of programs will be much more beneficial than where effects are delayed or transitory. At present, these ratchet and fade-out attributes cannot be easily identified from the available evidence.
We recommend the use of benefit maps for each evaluation. These maps show which impacts are measured; whether these impacts are measured consistently; and if there is overlap or confounding across impacts. In turn, we can identify which impacts can be assigned shadow prices, which might be assigned shadow prices, and which cannot. Our summary benefit map highlights differences across evaluations, and these differences are sufficiently large that we strongly caution against any comparison of benefit-cost ratios across the field of SEL. Yet, the solution is not to focus on a narrow but consistent set of benefits. Instead, we recommend more attention to the wider benefits of SEL. Unavoidably, given the current evidence, studies focus on the individual-level benefits of SEL. But there is a strong case that SEL benefits are dispersed through a school or community and so economic value should be measured at that level. A better understanding of the economic value of school climate or classroom behavior would help bring this idea to the forefront.Footnote 32
More impacts need to be thoroughly classified and clarified such that more shadow prices could be estimated and more BCA performed. One promising avenue is to calculate a shadow price for the BASC; this would help harmonize evidence by allowing SE researchers to translate scores into dollars. Another is to shadow price in-school and in-class disruptions caused by low SE skills. As disruptions impose immediate burdens and so have a high present value, improving SE skills might yield sizeable cost savings particularly when the intervention has immediate effect (a fast ratchet effect). Therefore, as yet, the dollar amounts of these behaviors are unknown.
In addition, existing shadow prices need to be validated. Even in two areas where some progress has been made – on the association between SE skills and earnings or education – the need for substantial further investigation remains. For earnings, alternative scales need to be applied to identify the labor market gains from SE skills more precisely and to model how these gains and skills are mutually determined (Heckman, Stixrud & Urzua, Reference Heckman, Stixrud and Urzua2006). For education, more emphasis should be put on the impact of SE skills on attainment (such as graduation from high school and college) rather than achievement. However, even here, the economic value of these long-term impacts of enhanced SE skills can only be calculated under restrictive assumptions: (a) these constructs (self-esteem, misbehavior, self-control, etc.) accurately and fully reflect SE skills (b) SE skill differences are stable over childhood (such that SE skills in one grade reflect SE skills throughout the school years); and (c) that the effects of cognitive and SE skills can be distinguished. Although some progress has been made in each area, the validity of these assumptions represents important areas for future research.
Despite all these caveats, the limited analyses currently available show SEL interventions can easily pass a benefit-cost test and this conclusion is robust to sensitivity testing. Importantly, this conclusion gains validity because most of the challenges to BCA of SEL are likely to cause downward bias to the benefits of SEL. First, by ignoring the ratchet effect, estimates of benefits are likely to be conservatively estimated. Second, as illustrated by the benefit maps, only a fraction of the overall benefits are being calculated. If immediate benefits were properly modeled and all benefits were included, the present value benefits of SEL interventions would likely exceed costs by even larger magnitudes. These promising conclusions suggest that more attention should be paid to SEL interventions relative to achievement gains.
Supplementary material
To view supplementary material for this article, please visit http://dx.doi.org/10.1017/bca.2015.55.
Acknowledgments
Funding for this research was provided by the NoVo Foundation (novofoundation.org). The authors greatly appreciate comments and support from Steve Aos, John Bridgeland, Mark Greenberg, Damon Jones, Stephanie Lee, Annie Pennucci, and Roger Weissberg. We appreciate detailed comments from the Editor and reviewers.


