

Introduction
International development agencies and policymakers are working increasingly to assure that developing countries achieve a demographic dividend (Bloom et al., Reference Bloom, Canning and Sevilla2003; Canning et al., Reference Canning, Raja and Yazbeck2015). A demographic dividend refers to the economic growth that ensues when countries experience lower mortality and fertility rates, decreasing the ratio of working-age adults to child dependants, and increasing the economic investment per person (Bloom et al., Reference Bloom, Canning, Fink and Finlay2009; Gribble & Bremner, Reference Gribble and Bremner2012). While many developing nations have reaped the benefits of a demographic dividend, particularly countries of East Asia, many countries still require much needed attention before they too are able to experience the economic and health benefits associated with a demographic dividend (Bloom & Finlay, Reference Bloom and Finlay2009; Canning et al., Reference Canning, Raja and Yazbeck2015).
Central to the achievement of a demographic dividend is achieving reductions in fertility. While child mortality rates have declined substantially in developing countries, high fertility rates remain in many parts of the world (Lozano et al., Reference Lozano, Wang, Foreman, Rajaratnam, Naghavi and Marcus2010; Bongaarts & Casterline, Reference Bongaarts and Casterline2012). The global fertility rate declined from 4.7 births in the early 1970s to 2.6 births in the late 2000s (Ahmed et al., Reference Ahmed, Li, Liu and Tsui2012), but this decline has been region-specific. Fertility rates remain at two-to-three times the replacement level (2.1 children per woman) in many resource-poor settings, particularly in countries of sub-Saharan Africa (Canning et al., Reference Canning, Raja and Yazbeck2015). Targeting reductions in fertility, particularly unwanted fertility, is a key developmental goal, and is central to many of the current Sustainable Development Goals (SDGs) (United Nations, 2015; Starbird et al., Reference Starbird, Norton and Marcus2016).
However, critical to the success of gaining reductions in fertility is the ability to understand the factors that are shaping fertility, and to understand the factors that are acting to keep fertility levels high. While many policies and programmes have focused on addressing the broader socioeconomic factors that have indirect effects on fertility, for example economic development, it remains necessary to assess which factors are immediately driving changes in fertility, and how these factors compare within and across world regions. The Bongaarts proximate determinants of fertility model provides a simple framework for decomposing the factors driving fertility. Based on the seminal work of Davis and Blake (Reference Davis and Blake1956), Bongaarts highlighted the eight quantifiable factors responsible for fertility variation: age at marriage, contraceptive use and effectiveness, induced abortion, postpartum infecundability, fecundability, spontaneous abortion, sterility and duration of the fertile period (Bongaarts, Reference Bongaarts1978). The latter four, known as the biological factors, are considered secondary because their variation has less of an impact on fertility levels. The prior four, on the other hand, vary over time and when measured accurately can explain 96% of the variation in fertility (Bongaarts, Reference Bongaarts1978). While there has been a wealth of literature that has applied the Bongaarts framework to understanding fertility in single resource-poor countries, or often contrasting the proximate determinants of fertility across multiple countries, absent from the literature is a comprehensive understanding of how the proximate determinants of fertility have transitioned in low- and middle-income countries over the past ten to twenty years.
While the proximate determinants model remains conceptually sound, some of the model’s original simplifying assumptions have become less accurate in recent decades. The original model assumes that only women within marriage, or consensual union, are sexually active (Bongaarts, Reference Bongaarts1978; Stover, Reference Stover1998). As extramarital sexual activity has increased in recent years, the original model underestimates the proportion of women at risk of sexual exposure (Stover, Reference Stover1998; Bongaarts, Reference Bongaarts2015). Additionally, there are regions of the world where women’s contraceptive use has increased and breast-feeding periods have remained long (Stover, Reference Stover1998). In these regions, it is likely that women’s contraceptive use and postpartum insusceptibility overlap (Bongaarts, Reference Bongaarts2015). Ignoring this overlap, as is done in the original model, can result in measurement error. To address these sources of error, Bongaarts developed an adjusted proximate determinants of fertility model (Bongaarts, Reference Bongaarts2015). The adjusted model accounts for extramarital sexual activity when measuring the Index of Sexual Exposure, formerly known as the Index of Marriage (Bongaarts, Reference Bongaarts2015). The adjusted model also accounts for the overlap in contraceptive use and postpartum insusceptibility when calculating the Index of Contraception (Bongaarts, Reference Bongaarts2015). These refinements have resulted in an improved model fit and affirm the importance of considering changing behaviours when explaining fertility.
The four behavioural proximate determinants of fertility – abortion, contraceptive use, postpartum infecundability and sexual exposure (either through marriage or extramarital sex) – are inherently shaped by distal social, cultural and economic factors (Bongaarts, Reference Bongaarts2015). Yet, any variation in these proximate determinants will have an immediate, quantifiable impact on fertility, and identifying which of these factors are, or indeed are not, changing over time, offers the potential for the targeting of fertility-reduction interventions. Understanding relative temporal changes in the proximate determinants of fertility over time has the potential to provide new insight into where significant shifts in the factors driving fertility are occurring, and how these vary by context. Assessing the temporal patterns in these determinants can also identify how countries are progressing along the demographic transition. These determinants can serve as a guide to where policy and programmatic attention has been successful and indicate areas where additional attention is required. To contribute to this understanding, this study analysed the Bongaarts (Reference Bongaarts2015) adjusted proximate determinants of fertility model to examine how fertility rates, and the four immediate drivers of fertility, have changed since 2000 in 33 low- and middle-income countries.
Methods
The Demographic and Health Surveys (DHS) provide nationally representative data for men and women in low- and middle-income countries. This study used data from the women’s questionnaire, which collects data from women of reproductive age (15–49 years). In the first stage of data collection, each country’s most recent census is used to create Primary Sampling Units (PSUs), which are geographic areas of similar size – comparable to census enumeration tracts. The second stage consists of selecting and interviewing women from 20–30 households for each PSU. The surveys are highly standardized, allowing for comparison across countries. The DHS questionnaires have changed substantially since those employed in the first phase of the DHS conducted in the 1980s, which poses potential limitations in longitudinal analysis. A full description of the methodology, survey contents and all DHS data are publicly available at www.measuredhs.com.
The sampling frame for the study consisted of 82 countries with DHS data. Of these, 37 did not meet the first inclusion criterion, which required the availability of at least two DHS, with the most recent survey dated between 2010 and 2015. Of the remaining 45, four countries (Indonesia, Jordan, Pakistan and Yemen) were eliminated because the sample did not include women who had never been married. Eight additional countries were eliminated – Bangladesh, Burundi, Comoros, Cote D’Ivoire, Egypt, Gabon, Kyrgyz Republic and Togo – because at least one of the two surveys did not provide information on women’s recent sexual activity. Information on women’s recent sexual activity, irrespective of marital status, is necessary for accurately calculating the effect of sexual exposure on a country’s fertility rate. There were 87 countries with DHS data available. Of these, 33 countries were selected for analysis (Table 1). The countries that met the inclusion criteria had at least two DHS, with the most recent survey year falling between 2010 and 2015, provided data for both married and unmarried women and provided data on women’s recent sexual activity – specifically whether women reported having had sex within the last 4 weeks. If more than two DHS datasets were available, the earliest survey containing all necessary variables was selected for the initial period. This would then probably capture the greatest change in the proximate determinants of fertility. The remaining 33 countries were then divided into their respective sub-regions: sub-Saharan Africa (collectively), Eastern Africa, Western Africa, Central Africa, Southern Africa, Latin America & Caribbean and Asia. The initial survey year for these countries fell between 2000 and 2008, and the recent survey year fell between 2010 and 2016. The countries and survey years are provided in Table 1.
Table 1 Study countries organized by regions and years of initial and recent DHS
The Bongaarts proximate determinants of fertility model
To quantify the fertility-inhibiting effects of the principal proximate determinants, four indices were developed: the Index of Sexual Exposure, C m , the Index of Contraception, C c , the Index of Induced Abortion, C a and the Index of Postpartum Infecundability, C i . Each index takes on a value between 0 and 1 in the model, depending on its degree of fertility inhibition. Estimating the observed fertility level (Total Fertility Rate, TFRo) in a population can be achieved through the multiplication of the four indices and the Total Fecundity Rate (TF).
According to the adjusted model:
 $${\rm TFR}_{{\rm o}} \,\approx\,{\rm TFR}_{{\rm e}} \,{\equals}\,C_{m} {\times}C_{c} {\times}C_{a} {\times}C_{i} {\times}{\rm TF}$$
where TFRo is the observed total fertility rate and TFRe is the estimated total fertility rate.
The Index of Sexual Exposure, C m , estimates the number of women who are exposed to the risk of childbearing as the sum of married women, women in consensual unions and unmarried women who are pregnant, report sex in the last month, use contraception or are abstaining postpartum. The age-specific equation for this index is:
 $$C_{m} \left( a \right)\,{\equals}\,m\left( a \right){\plus}{\rm }ex\left( a \right)$$
where m(a) represents the proportion of women in union, and ex(a) represents the proportion of sexually exposed, unmarried women. The DHS variable ‘current marital status’ (v501), was used to estimate m(a) and the following were used to estimate ex(a): currently pregnant (v213), recent sexual activity (v536), current contraceptive method (v312) and currently abstaining (v406). To calculate the country-level estimate of the Index of Sexual Exposure, the following aggregate equation was used:
 $$C_{m} \,{\equals}\,\mathop{\sum}{C_{m} \left( a \right)w_{m} \left( a \right)} $$
where w m (a) is the weighted average of sexual exposure. To calculate w m (a), the following equation was employed:
 $$w_{m} \left( a \right)\,{\equals}\,{{f_{m} \left( a \right)} \over {\mathop{\sum}{f_{m} \left( a \right)} }}$$
where f m (a) represents the age-specific fertility rate among sexually exposed women.
The Index of Contraception, C c , estimates the proportion of women using contraceptives while also considering the effectiveness of the contraceptive method and the overlap of women who are both postpartum insusceptible (whether it be due to breast-feeding or abstinence) and using contraceptives. The age-specific equation is:
 $$C_{C} \left( a \right)\,{\equals}\,1{\minus}r\left( a \right)\left( {u\left( a \right){\minus}o\left( a \right)} \right)e\left( a \right)$$
where u(a) is the contraceptive prevalence of sexually exposed women, o(a) represents the overlap of contraceptive use and postpartum infecundability, e(a) represents the average effectiveness of contraceptive methods and r(a) represents the fecundity adjustment. The variables u(a) and o(a) can be calculated using the DHS variables ‘current contraceptive method’ (v312) and ‘currently amenorrhoeic’ (v405), respectively. Bongaarts (Reference Bongaarts2015) provided the fecundity adjustment, r(a), and the following average contraceptive effectiveness values were used to calculate e(a): not using (0), pill (0.9), IUD (0.95), sterilization (1) and other (0.7). The method effectiveness levels were adapted from Bongaarts and Potter (Reference Bongaarts and Potter1983, p. 84). To calculate the country-level estimate of the Index of Contraception, the following aggregate equation was used:
 $$C_{c} \,{\equals}\,\mathop{\sum}{C_{c} \left( a \right)w_{c} \left( a \right)} ,$$
where w c (a) represents the weighted average of contraceptive use. To calculate w c (a), the following equation was used:
 $$w_{c} \left( a \right)\,{\equals}\,{{f_{n} \left( a \right)} \over {\mathop{\sum}{f_{n} \left( a \right)} }}\,\approx\,{\rm }{{f_{f} \left( a \right)} \over {\mathop{\sum}{f_{f} \left( a \right)} }}$$
where f n (a) represents the age-specific natural exposed fertility and f f (a) represents the age-specific fecundity rate. Estimates of f f (a) are provided below.
The Index of Induced Abortion, C a , is a function of the number of births averted by an abortion. The age-specific equation is:
 $$C_{a} \left( a \right)\,{\equals}\,{{f\left( a \right)} \over {f\left( a \right){\plus}b\left( {ab\left( a \right)} \right)}}$$
where f(a) is the age-specific fertility rate, b is the number of births averted by abortion and ab(a) is the age-specific abortion rate. The number of births averted by abortion, b, was estimated using the equation:
 $$b\,{\equals}\,{{14} \over {18.5{\plus}i\left( a \right)}}$$
where i(a) represents the average duration of postpartum infecundability. The age-specific fertility rate, f(a), and the average duration of postpartum infecundability, i(a), are provided for each country by the DHS at www.statcompiler.com (ICF International, 2013). Bongaarts (Reference Bongaarts2015) provides a thorough explanation of how to calculate the age-specific abortion rate ab(a). To calculate the country-level estimate of the Index of Abortion, the following aggregate equation was used:
 $$C_{a} \,{\equals}\,\mathop{\sum}{C_{a} \left( a \right)w_{a} \left( a \right)} \,\approx\,{{{\rm TFR}} \over {{\rm TFR}{\plus}b{\times}{\rm TAR}}}$$
where w a (a) is the weighted-average of induced abortions, and TAR is the Total Abortion Rate. In previous applications of the Bongaarts (Reference Bongaarts2015) adjusted proximate determinants of fertility model, the TAR for countries was derived from regional estimates routinely measured by the Alan Guttmacher Institute/World Health Organization (Sedgh et al., Reference Sedgh, Singh, Shah, Hman, Henshaw and Bankole2012). For this analysis, the following equation, developed by Charles F. Westoff, was used to calculate the TAR for each of the 33 countries (Westoff, Reference Westoff2008).
 $${\rm TAR}\,{\equals}\,2.94-0.033{\times}{\rm MOD}-0.252{\times}{\rm TFR}{\plus}0.091{\times}{\rm YRSEDUC }$$
where MOD is the percentage of sexually active women using a modern method of birth control, and YRSEDUC is the average number of years of education for women 15 years and older. Rather than applying the regional estimates to countries, country-level regression estimates were employed to capture intraregional variation in abortion rates. While the Westoff (Reference Westoff2008) regression estimate has demonstrated reliability in predicting the TAR in more developed settings, the model estimates, while plausible, are nearly unverifiable in less-developed settings.
The Index of Postpartum Infecundability, C i , estimates the degree to which postpartum abstinence and lactational amenorrhoea inhibit fertility. The age-specific equation is:
 $$C_{i} \left( a \right)\,{\equals}\,{{20} \over {18.5{\plus}i{\rm }\left( a \right)}}$$
where i(a) represents the average duration of postpartum infecundability. To calculate the country-level estimate of the Index of Postpartum Infecundability, the following aggregate equation was used:
$C_{i} {\equals}\mathop{\sum}{C_{i} \left( a \right)w_{i} \left( a \right)\,\approx\,C_{i} } $
where w i (a) represents the weighted average of postpartum infecundability.
The age-specific fertility rate can be calculated by the following equation:
 $$f\left( a \right)\,{\equals}\,C_{m} \left( a \right)C_{c} \left( a \right)C_{i} \left( a \right)C_{a} \left( a \right)f_{f} \left( a \right)$$
Estimates of the age-specific fecundity rate were calculated with the following equation:
 $$f_{f} \left( a \right)\,{\equals}\,{\rm }{{f(a)} \over {C_{m} \left( a \right)C_{c} \left( a \right)C_{i} \left( a \right)C_{a} \left( a \right)f_{f} (a)}}$$
The country-level fertility rate can be estimated by the following aggregate equation:
 $${\rm TFR}_{e} \,{\equals}\,\mathop{\sum}{C_{m} \left( a \right)C_{c} \left( a \right)C_{i} \left( a \right)C_{a} \left( a \right)f_{f} \left( a \right)} \,{\equals}\,C_{m} C_{c} C_{i} C_{a} {\rm TF}$$
The country-level estimate of TF was estimated using the following equation:
 $${\rm TF}\,{\equals}\,{{{\rm TFR}} \over {C_{m} C_{c} C_{i} C_{a} }}$$
The TF (Total Fecundity Rate) was estimated for all countries and averaged for the analysis. The average TF value was 15.8 in the initial period and 15.3 in the recent period. To check the accuracy of the model, the estimated TFR, TFRe, was compared with the observed TFR, TFRo, provided by the DHS (Table 2).
Table 2 Country-level estimated and observed Total Fertility Rates (TFR) for initial and recent DHS
TFRo represents the observed Total Fertility Rate reported by the DHS programme; TFRe represents the estimated Total Fertility Rate calculated using the Bongaarts (Reference Bongaarts2015) adjusted proximate determinants of fertility model. The error represents the difference in TFRo and TFRe (TFRe−TFRo).
Decomposition analysis
To quantify the contribution of each proximate determinant to a given change in fertility between two time points, Bongaarts and Potter (Reference Bongaarts and Potter1983) developed a decomposition technique (Bongaarts & Potter, Reference Bongaarts and Potter1983, p. 107). The contribution of each proximate determinant towards the observed change in fertility between two time points can be obtained by the following equation:
 $${{\rm {TFR}_{2} } \over {\rm {TFR}_{1} }}\,{\equals}\,\left\{ {{{C_{{m2}} } \over {C_{{m1}} }}} \right\}{\times}\left\{ {{{C_{{c2}} } \over {C_{{c1}} }}} \right\}{\times}\left\{ {{{C_{{i2}} } \over {C_{{i1}} }}} \right\}{\times}\left\{ {{{C_{{a2}} } \over {C_{{a1}} }}} \right\}{\times}\left\{ {{{{\rm TF}_{2} } \over {{\rm TF}_{1} }}} \right\}$$
where 1 represents the value from the initial period, and 2 represents the value from the recent period. This equation can be arranged as
 $$P_{f} \,{\equals}\,P_{m} {\plus}P_{c} {\plus}P_{i} {\plus}P_{r} {\plus}I$$
where: $P_{f} {\equals}\big[ {{{\rm {TFR}_{2} } \over {\rm {TFR}_{1} }}} \big]{\minus}1{\equals}$
proportional change in TFR between the initial period and the recent period;
$P_{f} {\equals}\big[ {{{\rm {TFR}_{2} } \over {\rm {TFR}_{1} }}} \big]{\minus}1{\equals}$
proportional change in TFR between the initial period and the recent period; $P_{m} {\equals} \big[ {{{C_{{m2}} } \over {C_{{m1}} }}} \big]{\minus}1{\equals}$
proportional change in TFR between the initial period and the recent period due to change in sexual exposure;
$P_{m} {\equals} \big[ {{{C_{{m2}} } \over {C_{{m1}} }}} \big]{\minus}1{\equals}$
proportional change in TFR between the initial period and the recent period due to change in sexual exposure; $P_{c} {\equals} \big[ {{{C_{{c2}} } \over {C_{{c1}} }}} \big]{\minus}1{\equals}$
proportional change in TFR due to change in contraception;
$P_{c} {\equals} \big[ {{{C_{{c2}} } \over {C_{{c1}} }}} \big]{\minus}1{\equals}$
proportional change in TFR due to change in contraception; $P_{i} {\equals} \big[ {{{C_{{i2}} } \over {C_{{i1}} }}} \big]{\minus}1{\equals}$
proportional change in TFR due to change in postpartum infecundability;
$P_{i} {\equals} \big[ {{{C_{{i2}} } \over {C_{{i1}} }}} \big]{\minus}1{\equals}$
proportional change in TFR due to change in postpartum infecundability; $P_{a} {\equals} \big[ {{{C_{{a2}} } \over {C_{{a1}} }}} \big]{\minus}1{\equals}$
proportional change in TFR due to change in induced abortion; and
$P_{a} {\equals} \big[ {{{C_{{a2}} } \over {C_{{a1}} }}} \big]{\minus}1{\equals}$
proportional change in TFR due to change in induced abortion; and $P_{r} {\equals} \big[ {{{C_{{r2}} } \over {C_{{r1}} }}} \big]{\minus}1{\equals}$
proportional change in TFR due to changes in the remaining proximate variables (sterility, fecundability, intrauterine mortality and duration of the fertile period).
$P_{r} {\equals} \big[ {{{C_{{r2}} } \over {C_{{r1}} }}} \big]{\minus}1{\equals}$
proportional change in TFR due to changes in the remaining proximate variables (sterility, fecundability, intrauterine mortality and duration of the fertile period).
The interaction factor I is a complex function of P m , P c , P i , P a and P r , which can be estimated by subtracting the sum of P m , P c , P i , P a and P r from P f.
Regional and longitudinal analysis
The observed and estimated TFR and the proximate determinants were calculated for individual countries. These countries were organized by geographical regions using the format provided by the United Nations Statistics Division. To determine whether there has been a significant shift for geographical regions in the TFRo, TFRe, C m , C c , C i and C a , a paired t-test was used to compare the average. Data analysis was done using STATA version 14.0 software.
Results
Total fertility rate
The observed Total Fertility Rate (TFRo), estimated Total Fertility Rate (TFRe) and error (TFRe−TFRo) are provided for each country in Table 2. On average, the countries of sub-Saharan Africa, Latin America & Caribbean and Asia have all seen a decrease in both the observed TFR and the estimated TFR. While many of the sub-Saharan countries have experienced a decrease in their TFRo, the TFRo for these countries ranges from 3.3 to 7.6, with nearly all of them continuing to have fertility rates two to three times the replacement fertility rate. The exceptions to this trend are Kenya (with a recent TFRo of 3.9), Zimbabwe (recent TFRo 4.0), Lesotho (recent TFRo 3.3) and Namibia (recent TFRo 3.6). In comparison, Latin America & Caribbean countries have recent TFRo values ranging from 2.1 to 3.5, and Asian countries have recent TFRo values ranging from 1.7 to 3.0. All countries that have experienced an increase in TFRo between the initial and recent periods are in sub-Saharan Africa. The countries that have had an increase in their TFRo include Mozambique and Zimbabwe (Eastern Africa), Burkina Faso and Niger (Western Africa) and Cameroon, Chad, Congo and Democratic Republic of Congo (Central Africa). A small error between estimated and observed TFR was observed for most countries, indicating that the model is not a perfect predictor of fertility. There are many possible explanations for these errors, including four of the biological determinants that are not captured in the model (sterility, fecundability, intrauterine mortality and duration of fertile period), errors in the model estimates or errors in measuring the proximate determinants (Bongaarts, Reference Bongaarts2015).
Proximate determinants of fertility
The country-level estimates of the proximate determinant indices, for the initial period and the recent period, along with the change in indices over time are provided in Table 3. The lower an index value, the greater inhibiting effect it has on fertility. The average observed TFR, estimated TFR and index values for the world regions are provided in Table 4.
Table 3 Country-level estimates of the proximate determinants of fertility for initial and recent DHS
ΔC x =difference in index value from initial period to recent period.
Table 4 Average regional estimates of the Total Fertility Rate (TFR) and proximate determinants of fertility from initial and recent DHS
*p<0.05; **p<0.001, from paired t-test.
Index of Sexual Exposure (C m ). Universally, there has been a slight decrease in this index, which can be attributed to an increased age of marriage and/or delayed sexual debut. Yet, there remains a handful of countries in sub-Saharan Africa (Rwanda, Tanzania, Zimbabwe, Niger, Sierra Leone, Lesotho and Namibia), as well as the countries of Latin America & Caribbean (Dominican Republic, Haiti, Honduras and Colombia), that have seen an increase in the index. For the initial period, delayed age at marriage and sexual debut had the greatest inhibiting effect on fertility in Rwanda, Haiti, Honduras, Colombia, Cambodia, Philippines and Armenia, where it accounted for 35–68% of fertility reduction. For the recent period, delayed age at marriage and sexual debut had the greatest inhibiting effect on fertility in Kenya, Rwanda, Cambodia, Philippines and Armenia, where it accounted for 41–60% of fertility reduction.
Index of Contraception (C c ). This estimates the degree of fertility inhibition due to contraceptive use, while considering the effectiveness of the contraceptive method and the overlap of women who are both postpartum-insusceptible and using contraceptives. There has been a universal decrease in the Index of Contraception, indicating that more women of reproductive age are using some form of birth control. Countries that have experienced a notable decrease in the Index of Contraception include Malawi, Rwanda and Zambia of Eastern Africa, as well as Honduras and Cambodia. The following countries had an increase in their Index of Contraception: Mozambique (Eastern Africa), Benin and Guinea (Western Africa) and each country of Central Africa, including Cameroon, Chad, Congo and Democratic Republic of Congo. Except for Benin and Guinea, the countries that experienced an increase in the Index of Contraception (decrease in contraceptive use) also had an increase in their TFR. For the initial period, the Index of Contraception had the greatest fertility-inhibiting effect in Dominican Republic, where it was responsible for 63% of fertility inhibition. For the recent period, contraceptive use was the greatest fertility inhibitor for Zimbabwe, Namibia, Dominican Republic, Honduras, Colombia and Nepal, where it was responsible for 37–60% of fertility inhibition.
Index of Postpartum Infecundability (C i ). This measures the degree of fertility inhibition due to breast-feeding duration and postpartum abstinence. This index has increased in nearly all countries, indicating a shorter mean period of breast-feeding and a decrease in duration of postpartum abstinence. Exceptions to this include Colombia and the Democratic Republic of Congo, which each have experienced a slight decrease in postpartum infecundability. While Colombia has experienced a slight decrease in the postpartum infecundability index, the contribution of postpartum infecundability to fertility reduction is still relatively low, accounting for 29% of fertility reduction in the recent period. At the initial period, the Index of Postpartum Infecundability accounted for the greatest degree of fertility inhibition for 24 of the 33 countries investigated, where it was responsible for 35–51% of fertility inhibition. These 24 countries included Nepal and 23 countries of sub-Saharan Africa. Despite an average increase in the Index of Postpartum Infecundability, breast-feeding and postpartum abstinence continued to have the greatest fertility-inhibiting effect on 22 of the 25 sub-Saharan Africa countries during the recent period, where it accounted for 34–50% of fertility inhibition.
Index of Abortion (C a ). This measures the degree of fertility inhibition due to induced abortion. While on average there has been a significant decrease in the Index of Abortion, there appears to be neither an increasing nor decreasing trend in abortion across countries or sub-regions. The country with the lowest Index of Abortion is Armenia (C a =0.56), where abortion has been legal for over 50 years and is available up until 12 weeks of pregnancy (Louie et al., Reference Louie, Chong, Tsereteli, Avagyan, Vardanyan and Winikoff2015). For most countries, abortion contributes the least to fertility inhibition, though under-reporting of abortion in developing settings makes it challenging to validate these estimates. There are many countries where abortion has had greater fertility-inhibiting effects than contraceptive use, possibly indicating a relationship between unmet need for family planning and abortion. In the initial periods, this was the case for Ethiopia, Guinea, Nigeria, Senegal, Sierra Leone, Mali, Chad and Cambodia, where abortion was responsible for 7–19% of fertility inhibition and contraception was responsible for 4–13% of fertility inhibition. In recent years, this was the case for Mali, Chad, Lesotho, Haiti and Armenia, where abortion was responsible for 9–44% of fertility inhibition and contraception was responsible for 3–34% of fertility inhibition.
Decomposition analysis
Table 5 presents the results of the decomposition analysis of the change in TFR between the initial and recent periods for the 33 low- and middle-income countries. For example, between the years 2000 and 2011, the TFR in Ethiopia decreased by 12.7%. This percentage change can be attributed to a 4.3% decline in fertility due to sexual exposure, 9.8% decline in fertility due to contraception, 5.7% increase in fertility due to postpartum infecundability, 0.2% decline in fertility due to abortion, 4% decline due to the residual and 0.0% due to the interaction factor. Figure 1 also provides a graphical representation of the decomposition analysis for the four primary proximate determinants of fertility. Results from this analysis indicate that increased contraceptive use and delayed age at marriage and lowered extramarital sexual exposure have contributed to fertility decline in most countries of Eastern and Southern Africa. Contraceptive use has also had a similar fertility-inhibiting impact in Latin America & Caribbean countries, yet sexual exposure has had little fertility-inhibiting impact in these countries. In fact, sexual exposure has increased in all countries of this region. Postpartum infecundability has increased over time in all countries of Western Africa and Asia, and most countries of Central, Eastern and Southern Africa. The large residuals for some countries are indicative of measurement error and should be taken into consideration when interpreting country-specific trends.
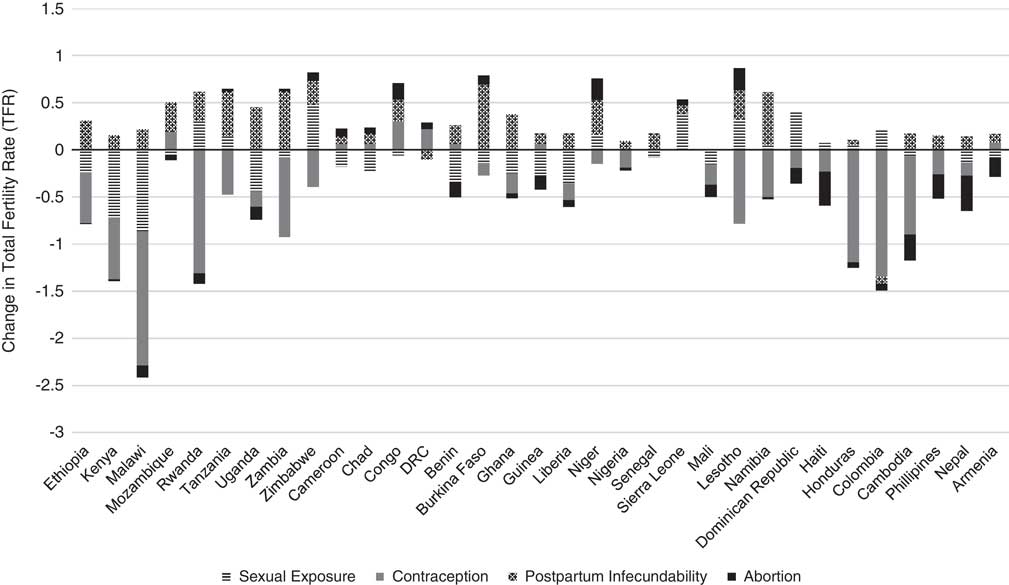
Fig. 1 Decomposition of change in TFR for 33 low- and middle-income countries between initial and recent periods, 2000 and 2016.
Table 5 Decomposition of change in TFR between initial and recent period for 33 low- and middle-income countries, 2000 and 2016
Discussion
The aim of this paper was to examine how fertility rates and the proximate determinants of fertility have changed in low- and middle-income countries since 2000, and to provide new insight into the fertility-shaping factors that may be harnessed for intervention. Understanding how the leading drivers of fertility have changed in recent years can help to develop new, and improve existing, policies and programmes that will speed up fertility decline, particularly in regions where fertility remains exceptionally high. The Bongaarts (Reference Bongaarts2015) adjusted proximate determinants of fertility model – which measures the impact of abortion, contraceptive use, marriage and extramarital sexual exposure, and postpartum infecundability on fertility reduction – was applied to 33 low- and middle-income countries using data from the Demographic and Health Surveys (DHS). The results should serve as indicators for areas where programmatic attention may be lacking, but recommendations should be considered in combination with each country’s own social, economic and cultural context, as these distal factors will influence the proximate determinants.
Low- and middle-income countries that continue to have persistently high fertility rates, or whose fertility rates have increased, are furthest from achieving a successful demographic dividend. Countries that continue to have fertility rates greater than 6.0 and/or have seen an increase in their fertility rate include Chad, Congo, Democratic Republic of Congo (DRC) and Cameroon in Central Africa; Mozambique, Zimbabwe and Uganda in Eastern Africa; as well as Burkina Faso, Niger and Mali in Western Africa. Clearly these countries are a priority for programmatic interventions aimed at starting and maintaining fertility reductions. Results from the decomposition analysis highlight those factors that may be prime for intervention. Apart from the Democratic Republic of Congo and Zimbabwe, a decreased duration in breast-feeding contributed the most to increased fertility rates in these countries. One strategy to consider for fertility reduction may therefore be to identify programmes that can educate and support women to achieve exclusive breast-feeding. For many of these countries, a declining use of modern contraceptives has also contributed to an increased fertility rate. This is particularly true for Democratic Republic of Congo, where a decline in contraceptive use has had the greatest fertility-promoting effect. Of these countries, Democratic Republic of Congo also has the greatest unmet need for contraceptives, with 40.8% of women of reproductive age wanting to delay childbearing but not using a modern method of contraception (Family Planning 2020, 2017a). Promoting the uptake of safe, effective modern contraceptive clearly remains fundamental to sustained reductions in fertility in resource-poor settings, although it must be considered in the wider context of the other proximate determinants of fertility. Each of the countries experiencing increases in fertility and lowered rates of contraceptive use have committed to Family Planning 2020 (FP2020) – a global partnership that supports the rights of women and girls to decide, freely and for themselves, whether and when to have children, and how many they want to have (Family Planning 2020, 2017b). It is important to continue to track the proximate determinants of fertility to establish whether these countries’ commitments to FP2020 – and other programmatic activities – have translated into shifts in the proximate determinants of fertility and created reductions in fertility.
In designing policies and programmes for countries in the early stages of their fertility transition, it is also useful to reference the success of countries that reduced their fertility rates from a similar starting point. While nearly all countries have experienced a decrease in their average duration of breast-feeding or postpartum abstinence, which has contributed to an increase in fertility levels in the countries of Central Africa, the impact has not been as strong in other regions of the world. For many countries in Eastern Africa (Ethiopia, Kenya, Malawi, Uganda, Zambia), Western Africa (Burkina Faso, Ghana, Liberia) and Asia (Nepal, Cambodia), fertility levels have fallen, despite decreasing breast-feeding periods, because the combined effect of increased contraceptive use and increased age at marriage and sexual debut have been able to offset the fertility-promoting effects of shorter breast-feeding periods. Additionally, while sub-Saharan Africa has long been recognized for its stalling fertility levels, there are countries that have made substantial progress in reducing their fertility. The sub-Saharan Africa countries Kenya, Malawi, Rwanda, Lesotho and Namibia have reduced their fertility rates by more than 20% or have reached a TFR below two times the replacement level. The increased use of contraceptives has been the leading driver of fertility decline in these countries, reaffirming the importance of providing accessible and affordable family planning services to the women of these regions.
The fertility changes in Southern Africa, which has the lowest fertility rates of sub-Saharan Africa, mirror the fertility changes observed in Latin America & Caribbean. Fertility declines in both regions have been driven primarily by an increasing use of contraceptives. Additionally, the countries of both regions have experienced a fertility-promoting effect of increased sexual exposure. This increase in sexual exposure is probably due to changing social norms around marriage in these regions. For countries of Latin America, the prevalence and social acceptability of fertility out of union has increased in recent decades (Laplante et al., Reference Laplante, Castro-Martín, Fostik and Martín2016). Similarly, in countries of Southern Africa, marriage is no longer considered to be the normative context for sexuality and fertility. Informal unions and childbearing outside marriage are common (Hertrich, Reference Hertrich2017). This underscores the importance of capturing changing sexual behaviours and social norms in modelling fertility trends, as was done in the Bongaarts (Reference Bongaarts2015) adjusted proximate determinants of fertility model. It also underscores the need to ensure that family planning programmes recognize that sex occurs outside of formal unions, and to provide services for the needs of unmarried individuals.
The greatest limitation of this analysis was in the estimation of the Index of Abortion, C a . While the Westoff (Reference Westoff2008) regression estimation method has demonstrated reliability in predicting the Total Abortion Rate (TAR) in developed settings, the rates are nearly impossible to verify in developing settings, where there is likely to be a large under-reporting of abortion. Additionally, the difference in observed TFR and estimated TFR indicates that the Bongaarts (Reference Bongaarts2015) adjusted proximate determinants of fertility model is not a perfect predictor of fertility. As mentioned previously, the error can probably be explained by the four biological proximate determinants not captured (sterility, fecundability, intrauterine mortality and duration of the fertile period), errors in the model estimates or errors in measuring the proximate determinants.
In conclusion, these findings are central to understanding how fertility, and the factors shaping fertility, have changed in low- and middle-income countries in the past 10–20 years. Universally, there has been a decrease in the duration of breast-feeding and postpartum abstinence, which has contributed to stalling and increasing fertility levels in many countries of sub-Saharan Africa, and particularly those of Central Africa. The notable success of countries to reduce their fertility rates, such as Southern Africa and Latin America & Caribbean, can be attributed primarily to the increased effect of contraceptive use. The success of many countries to decrease their fertility levels, despite a decrease in breast-feeding periods, can also be attributed to the combined effect of increasing contraceptive use and increasing age at marriage and sexual debut. Programmes aiming to reduce fertility levels should emphasize the importance of educating women on the benefits of exclusive breast-feeding. Additionally, family planning services should be accessible and affordable to any woman of reproductive age that has a desire to delay childbearing. Lastly, to delay the age at marriage and sexual debut, laws against child marriage need to be established in regions where there are none and enforced in areas where harmful cultural practices remain. Additionally, ensuring girls’ access to school will increase their ability to make independent, informed decisions about how many children they want to have and when to have them.


