Introduction
A surge-type glacier lies quiescent for decades, growing steeper and accumulating mass in its ice reservoir area in preparation for its next surge (Reference Meier and PostMeier and Post, 1969). Considerable effort has gone into studies of a few surge-type glaciers during their quiescent phases and during their surges. Only Variegated Glacier in the St Elias Mountains of Alaska, Medvezhiy glacier in the Pamirs or Tadzhikistan, and West Fork Glacier in the Alaska Range have been quantitatively for extended intervals between and during their surges (Reference Doglushin and OsipovaDolgushin and Osipova, 1975. Reference Doglushin and Osipova1978; Reference Bindschadler, Harrison, Raymond and GrossonBindschadler and others, 1977; Reference KambKamb and others, 1985: Reference Raymond and HarrisionRaymond and Harrison, 1988; Reference Harrison, Echelmeyer, Chacho, Raymond and BenedictHarrison and others, 1994).
This paper presents a 24 year data set of ice velocity, ice thickness change and mass balance gathered from 1970 to 1994 during the present, ongoing quiescent phase of Black Rapids Glacier (Fig. 1). a surge-type glacier in the Alaska Range. Here we distill and interpret the data published by Reference Heinrichs, Mayo, March and TrabantHeinrichs and others (1995), which contain a full compilation of the observations of the glacier made by the U.S. Geological Survey and University of Alaska Fairbanks. In the analysis here, the effect of mass balance on surface elevation is considered, and, using obserations of glacier geometry change, ice-stresses calculations are made in an attempt to understand observed variations in ice speed in terms of internal ice deformation and basal motion.

Fig. 1. Map of Black Rapids Glacier, Alaska, U.S.A., showing stream gage (⊕), index sites (

Black Rapids Glacier most recently surged in 1936–37, and has an estimated surge period of 50–75 years. The estimate is based on the following evidence. First, air photos show a series of looped moraines on the glacier. A well-preserved, looped moraine generated at the mouth of the Loket tributary and carried down-glacier during the 1936–37 surge encloses about the same surface area as that present within the currcnt loop generated in the 57 years between 1937 and 1994 (Fig. 2 and U.S. Army Trimetragon photo Fl. 56-R 158, 1 August 1942). Secondly, two nearby glaciers, West Fork and Susitna Glaciers, most recently surged with periods of 50–60 years bctween surges (Reference ClarkeT.S. Clarke. 1991; Reference Harrison, Echelmeyer, Chacho, Raymond and BenedictHarrison and others, 1994). Assuming that the local climate influences the rate of recharge between surges, Black Rapids Glacier could be expected to have a surge period similar to its neighboring glaciers.
Black rapids glacier and its surroundings
Black Rapids Glacier is located in the central Alaska Range, just south of some of the highest mountains in that part of the range; Mount Shand, 3859 m (Fig. 1); Mount Hayes, 4216 m; and Mount Moffit, 3968 m. The ablation area lies in an east west running valley carved in the two north-facing valleys. The more easterly of these two valleys is a majot tributary glacier uofficially known as the “Loket tributary” (Fig. 1). Other smaller tributaries contribute to the main ice stream, as indicated by the morine pattern shown in Figure 1. Based on a 1973 map (Fig. 1), the total area of the glacier, including tributaries, is 246 Km2. An additional 31 km2 of glacier ice not connected to Black Rapids Glacier is also in the drainage basin. The drainage basin area is 473 km2; its lower boundary is defined by the stream-gauging site establised by the Universities of Alaska and Washington (Fig 1). Water draining from the glacier basin enters the Delta River.
Measurement location in this report are referred to a center-line curvilinear coordinate ssystem with the origin at the had of the glacier (Fig. 1). Measurement sites are referred t as “the 14 km site”, for example. A secondary center-line coordinate systemis used for the Loket triburary (Fig. 1). Its origin is at the 26 km site on the main branch, and the sites are referred to as “the L-19 km site”, for example.
In 1992, the length of main reach of the glacier — from the top of the principal accumulation area, at the site marked as 0 km in Figure 1, to the terminus — was about 43 km. Ice-corded moraine remnants from the 1936–37 surge lay 4 km in front of the 1992 terminus and within 1 km of the Delta River. Glacier geometry is summarized in Figure 3. The glacier is temperate (Reference Harrison, Mayo, Trabant, Weller and BowlingHarrison and others, 1975).
The geologie setting of Black Rapids Glacier could be an important factor contributing to its surge nature (Reference PostPost, 1969). A substantial part of the glacier lies along the Denali Fault, a major fault extending hundreds of kilometers through the Alaska Range (Reference PostPost, 1969; Reference NoklebergNokleberg and others, 1992). Two other surge-type glaciers, Sustina and West Fork Glaciers, also lie along the Denali Fault near Black Rapids (Reference ClarkeT.S. Clarke, 1991; Reference Harrison, Echelmeyer, Chacho, Raymond and BenedictHarrison and others, 1994).
History of black rapids glacier surges
A surge of Black Rapids Glacier in 1936–37 was first observed during November 1936; the surge had started at some earlier, unknown date. The terminus had stopped advancing by September 1937 (Reference MoffitMoffit, 1939). The Loket tributary and all but one south-side tributart participated in the surge. (The farthest east, now disconnected. south tributary did not surge in 1936–37.) The two south-facing tributaries nearest to the 14 km site (Fig. 1) surged as well. Oblique air photos made in 1942 show large crevasses to within 3 km of the head of the main branch (U.S. Army Trimetragon photo Fl.56-Ll57, 1 August 1942). No photos show the area above 3 km, so it is unknown to what extent the upper 3 km of the glacier participated in the surge. The 1942 photos also show large crevasses to the top of the Loket tributary (U.S. Army Trimetragon photo Fl.56-V156, 1 August 1942).
During the 1936–37 surge, the terminus of Black Rapids Glacier advanced as a lobe of ice out of the mouth of its valley into the relatively wide and flat Delta River valley, and ultimately stopped advancing about 500 m from the Delta River (Fig. 1; Reference HanceHance, 1937; Reference MoffitMoffit, 1939; O. Geist, as reported by Reference GiddingsGiddings (1988) and Reference HeinrichsHeinrichs (1994)). Moffit summarized bystanders’ observations which indicate the glacier advanced approximately 4 miles (6.4 km) between 3 December 1936 and 7 March 1937. The 1939–37 surge advanced 100–200 m beyond the surge moraine left by the surge immediately prior to it (1929 photograph from the Otto Geist collection at the University of Alaska Fairbanks, series X, Box 1).
The potential threat of Black Glacier became an issue in 1968 prior to the construction of an oil transport pipeline across Alaska from Prudhoe Bay on the Arctic Ocean to Port Valdez near the Gulf of Alaska. Relic moraines of advances prior to 1937 clearly indicate that the glacier has crossed the Delta River valley in the past, creating a glacier-dammed lake which would threaten the pipeline (Reference Post and MayoPost and Mayo, 1971). Three moraines created by Holocene advances (A, B, C in Figure 1) have been studied by Reference Reger, Sturmann, Beger, Solie and TannaianReger and others (1993). They suggested that the moraine composition indicated a surge origin for A and B; they could not be sure that C was formed by a surge. The surges which formed A and B crossed and dammed the Delta River; the advance associated with C may have. They estimated minimum ages for the moraines: 3360 ± 120 Bp, 1710 ± 85 BP, and 570 BP (or possibly as young as 210 BP) for A, B and C, respectively.
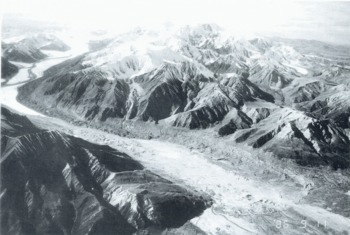
Fig. 2. Photograph of Black Rapids Glacier, Alaska, laken on 11 September 1986. Th extent of the 1936–37 surge advance and the 1986 terminns can be seen in the foreground. Note the lopped medial moraine at the month of the Loket tributary (Fig. 1) and the loop formerly at the mouth of the tributary which was carried down-glacier during the 1936–37 suge. (Photograph taken by R.S. March. USGS.)
Observations of Speed, Geometry and Mass Balance
Measurements: history and techniques
Black Rapids Glacier has been monitored with varying degrees of intensity from 1970 through the present as a joint effort of the U.S. Geological Survey (USGS), University of Alaske Fairbanks (UAF) and University of Washington (UW). Mass-balance, ice-velocity and surface-elevation observartions gathered at ten index sites by the USGS comprise most of the data appearing here. Eight of those sites are on the main branch of the glacier and two are in the Loket tributary. The number of sites monitored has been reduced since 1987.
In addition to the base-line measurements at the index sites, other quantities have been measured: ice thicknesses and several velocity cross-proflies (Reference Heinrichs, Mayo, March and TrabantHeinrichs and othets, 1995). Reference Raymond, Benedict, Harrison, Echelmeyer and SturmRaymond and others (1995) observed stream hydrology (stage, electrical conductivity and suspended sediment concentration), measured short-time-scale ice motion using time-lapse photography and made hourly observations of vertical strain and seismicity. The history and behaviour of the “potholes” located in the pass between Black Rapids and Susitna Glaciers have also been described (Reference SturmSturm, 1987; Reference Sturm and CosgroveSturm and Cosgrove, 1990). Oblique air-photo flights were made by the USGS, starting in the 1960s. Flights were made almostevery year between 1971 and 1982.
A map approximating the 1973 glacier surface configuration (Fig. 1; for a more detailed map, see Reference Heinrichs, Mayo, March and TrabantHeinrichs and others, 1995) was made because the glacier surface has changed substantially since the date of photography for the topographic maps available (1948–49 and 1954 for the USGS Mount Hayes B-4 quadrangle, and 1950 and 1956 for the USGS Mount Hayes B-5 quadrangle). The 1973 ma[ (Fig. 1) was not made using photogrammetric methods; rather, the glacier surface contours were sketched using 133 points surveyed on the glacier surface during 1973 and 1976 (Reference Heinrichs, Mayo, March and TrabantHeinrichs and others, 1995, Fig. 9). The 1973 map is qualitatively correct, but there could be substantial quantiative errors, particularly in regions of the glacier where no surveying was done.
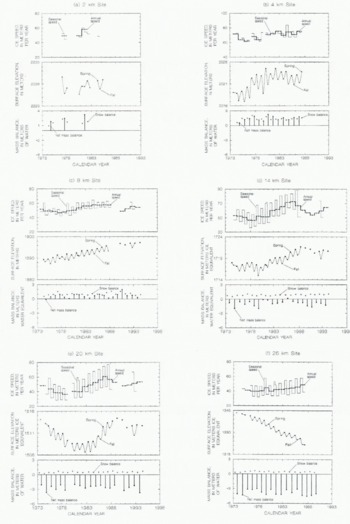
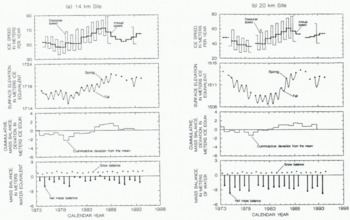
The ten sites along the glacier center line chosen for long-term observations are referredto as index sites (Fig. 1). The index sites have fixed horizontal coordinates (Reference Heinrichs, Mayo, March and TrabantHeinrichs and others, 1995, table 21). Measurements at each sire were made very near a single point on the glacier and thus constitute measurements in a reference frame fixed in space. Extensive tables of the observations (stake readings, snow-probing depths, displacement vectors, etc.) and operational details are available in the report by Reference Heinrichs, Mayo, March and TrabantHeinrichs and others (1995). The data gathered from 1973 to 1994 are shown in Figure 4. Estimated uncertainites can be found in Table 1.
Table 1. Uncertainties associated with the net mass balance, index-site elevation and speed results. Most of the uncertainty in the accumulation-area mass-balance results arises from the need to estimate firn density. Most of the uncertainly in the elevations and velocities is due to uncertainly in the vertical component of optical surveys caused by the variability of refraction in the atmosphere. Detailed uncertainly calculations can be found in Reference Heinrichs, Mayo, March and TrabantHeinrichs and others (1995)
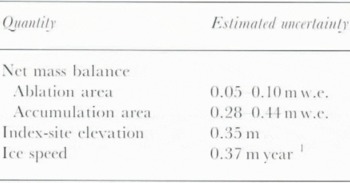


Fig. 4g–j. Index-site ice speed, surface elevation and net mass balance at Black Rapids Glacier at each site shown in Figure 1. Ablation-area surface elevation “ice equivalent”, which is the ice surface elevation plus the thickness of the snow converted to its equivalent thickness of ice. (Measured surface elevations can be found in Reference Heinrichs, Mayo, March and TrabantHeinrichs and other (1995).) At the 2, 4, 8 and L-19 km sites, the measured surface elecations are plotted. Snow balances are plotted on the date of observation. The net balance for a year is plotted at 3/4 of the way through the year. For example, the 1978 net mass balance is plotted at 1978.75.
Speed
Speed fluctuations, with acceleration and decelaration episodes of 4–9 years, are the most prominent features of the velocity data sets (Fig. 4). During the period of obseration, speed at all of the sites with full record has undergone two periods of decrease (1973-77 and 1987–90) and two periods of increase (1978–86 and 1991–94). These fluctuations are coherent in phase on the main branch of the glacier, with the largest amplituded observed at the two sites highest in the ablation area (14 and 20 km; Fig. 4d and e).
“Annual speed” (Fig. 4) in this paper is the speed measured between successive spring (generally April) observations. During the 1978–86 speed-up, the annual speed increase was largest at three of the four sites between 14 and 32 km (Fig. 5). These three sites (14, 20 and 32 km) lie along the Denali Fault (Fig. 1), The 14 and 20 km sites is about 10 m year1 higher (Fig. 6). The fourth site, 26 km, showed smaller fractional speed changes than the other three sites in the 14–32 km reach. The magnitude of the speed changes at 26 km fits better with the changes observed at the Loket tributary sites (Fig. 5).
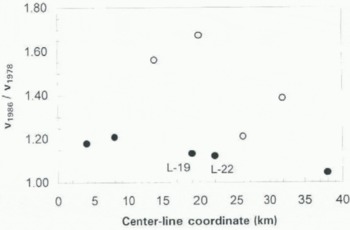
Fig. 5. Fraclional change in annusl ice speed between 1978 and 1986. siles along the denali fault with open circle. sites off the fault are shown with solid circles (●). the L-19 and L-22 sites are on the Loket tributary (Fig. 1).
At 8 km, in the accumulation area, speed fluctuations were in phase with those at 14 and 20 km but not as large. Ice thickness was increasing continuously at the 8 km site during these speed fluctuations (Fig. 4c). The more variable seasonal speeds at 4 km appear to cause increased variability in annual speeds.
The Loket tributary sites (L-19 and L-22 km) showed smaller speed changes than the two sites on the sites on the main branch with comparable elevations (14 and 20 km; Fig. 5). Both Loket sites showed a significant increase in speed during 1983, the year after a speed-up occurred at 14 and 20 km; these increase were relatively small in terms of fractional change. In the Loket tributary, the ice was thinning during the period of the speed increase; thickening began at a small rate at L-22 km in 1984 ana at L-19 in 1987.
“Seasonal speed” in this paper is the speed measured between successive “autumn” field trips. The “summer” observation season was typically between April and September, and the “winter” season was from September to April. Some caution is required when disucssing seasonal speeds because they are calculated only for the period between observations, and the observations were not made on exactly the same date every year. Consequently, each observation contains a slightly different mix of summer and winter speeds. The data are not adjusted to accounts for these differences.
The seasonal-speed time-series data (Fig. 4) exhibit several notable features. One is the prominent increase in summer speed during 1979 at all observed sites. Another especially significant aspect is that long-term fluctuations occur in both the winter and summer speeds; the winter and summer speeds rise and fall together, and the difference between the winter and summer speeds remains constant.
We define the “seasonal-speed difference” as the difference between summer and winter speeds. It is the peak-to-peak amplitude of the yearly difference in seasonal speed seen in Figure 4. Comparing the average seasonal speed differences at each site, for the period of record, with the long-term increase in speed from 1978 to 1986 shows that the magnitude of the average seasonal-speed difference is correlated with the size of the long-term change in annual speed at a site (Fig. 7).

Fig. 7. Comparison of the average amplitude of the seasonal-speed difference and long-term annual speed changes. The average amplitude of the seasonal-speed difference is plotted along with the “;long-term” increase in annual speed from 1978 to 1986. There is a good correlation between a site’s susceptibility to seasonal-speed differences and long-term annual speed changes.
Surface elevation and ice thickness
Figure 3 shows the glacier geometry in september 1977 based on elevation surveys at the ten index sites. Ice thickness were measured at some locations using ice-penetrating radar (Reference Heinrichs, Mayo, March and TrabantHeinrichs and others, 1995, table 17); measured values are marked with dots in Figure 3. Ice thickness were estimated at points between measurements using a combination of curce fitting and depth estimates based on surface morphology. The estimated uncertainty for measured values of ice thickness is ± 10%, and of umeasured values is ±20%, based upon our judgement.

Fig. 3. Longitudinal variation of width, basal shear stress shape factor, ice thickness and surface slope in 1977. Ice thickness was measured at points (●) along the center line (Reference Heinrichs, Mayo, March and TrabantHeinrichs and others, 1995); elsewhere, they were estimated. Surface slope was interpolated from USGS quadrangle maps and 1977 geadetic surveys.
Between 1979 and 1986, the glacier thinned at a much hihger rate low on the glacier than it thickened up-glacier (Fig. 8a). The surface elevation difference between a 1977
survey and the existing USGS maps made in the 1950s (Mount Hayes, B-4 and B-5) is shown in Figure 9 to give a longer time-scale picture of changes. The geometry of the lower ablation area is evolving as expected for a surge type glacier; a monotonic thinning is occuring at all sites below 26 km (Fig. 4). The rate of thinning gas decreased slightly during the period of record at 32 and 38 km. Higher on the glacier, the situation is not as simple. The surface elevation at the 20 km site has, like the speed, undergone long-term fluctuations (Fig. 4e). The same is true at 14 km, but the amplitude is smaller. In the accumulation area, the 8 km site is steadily growing thicker. The elevation fluctuated at the 4 km site. The Loket trubutary thinned at the two observed sites until mild thickening began in 1985.

Fig. 6. Annaul surface speeds at the 14 and 20 km sites. Note parallel rise in speed from 1978–86 and the convergence in speeds during the 1987–91 period of decreasing speed.

Fig. 8. Surface elevation changes at (a) Black Rapids and (b) Variegated Glaciers. Black Rapids Glacier change is relative to 1979. Much of the elevation change at the 26 km site was due to the encroachment of a trough in front of a medial moraine. Variegated illustration is from Reference Raymond and HarrisionRaymond and Harrsion (1988). Thinning rates are similar in the surge-receiving areas on both glaciers. The thickening rate in the reservoir area was an order of magnitude larger at Variegated than an Black Rapids Glacier.
The 26 km index-site elevation is a special case because it is affected by the Loket tributary and its moraine. In 1972, the site was established about 750 m down-glacier from the looped, medial moraine being pushed out by the Loket tributary (Fig. 1). A broad trough is located in front of the moraine. As the moraine advanced down-glacier through the 26 km index site, the elevation at the site decreased as the trough moved into the index-site location. Most of the elevation lost at 26 km after 1977 is due to this local surface effect. Some of the surface lowering may have been due to long-term mass wastage, but it is not possible to separate the local surface geometry from the mass-wastage effect.

Fig. 9. Thickness change of Black Rapies Glacier from 1949 to 1977. More than a decade passed between th end of the surge and the mapping photohraphy (USGS quadranges, Mount Hayes B-4 (1954) and B-5 1949). The quality of the vertical control of the maps is unknown. The glacier surface high in the accumulation area was poorly defined in many areas for photogrammetric map-making prupose because it was a featureless snowfield. Therefore, the accurace of the comparison may be low, particularly above 10 km.
Mass balance
The Black Rapids Glacier mass-balance observation network, during its most intensive coverage, consisted of ten measurement sites (Table 2) on more than 200 km2 of glacier surface. Three of the sites reliably measured mass balance in the accumulation area (4, 8 and L-19 km), (Stakes at 2 km were frequently buried and lost.) Since 1990, the number of sites monitored has been reduced to three (8, 14 and 20 km.) The 8 and 14 km sites are near the equilibrium line. The relative sparseness of the index-site data, including a lack of balance data in any tributary other than the Loket, makes accurate calcualtions of glacier-wide mass balance unfeasible.
Table 2. Net mass-balance data, Black Rapids Glacier. Results are given in metres of water equivalent. The was used to calculate bt, which represents the temporal average of mass balance. See text for details.
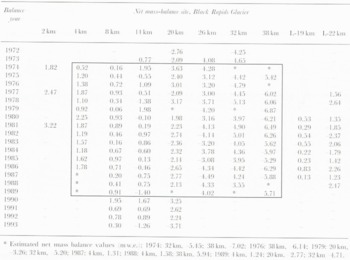
In order to make comparison among mass balanc, elevation change and speed, it is useful to calculate a parameter, b t, which summarizes each year’s net mass balance (Fig. 10). Using the net mass-balance data from the 4, 8, 14, 20, 26, 32 and 38 km sites from 1974 to 1989 (the shaded area of Table 2), the value fo b t for the year to is the mean of the balance results from all sites in year t (the mean of a subset row in Table 2) minus the mean of all the stakes for all the year considered (the entire subset (shaded area) in Table 2). The actual observation at each site during an individual year can then be represented as

Fig. 10. Yearly variations of net mass balance, 1974–89, b t represents the average net mass balance from seven sites. It is not a glacier-wide average. The mean of the series is zero.
Interpretations of the Observations
Relation between mass-balance and elevation changes
Mass balance is the primary driving force of the surface elevation changes. Although the simple time series of b t (Fig. 10) does not readily show mass balance to be a driving force of surface elevation change, examining the mass-balance data on a cumulative basis provided a likely explanation for the altitude fluctutations at the 14 and 20 km sites. In Figure 11, an additional mass-balance term is plotted for the 14 and 20 km sites: the cumulative deviation from the mean. The difference between each year’s mass balance and the mean for the entire site’s record (sometimes called the deviate) is accumulated over time. The cumulative deviate correlated well with the elevation at both sites, indicating that the mass balance is driving the elecation changes. Because the amplitude of the cumulative deviate is comparable to the elevation change at the 14 km site, mass-balance changes are inferred to be the primary driving force of elevation changes. At the 20 km site, the amplitude of the cumulative deviate is smaller than the elevation change, indicating that mas redistrbution by ice flow is also animportant factor in the elevation evolution.
Changes in speed: ice deformation and basal motion
A quantitative analysis demonstrates that changed in basal motion account for the majority of changes in speed at the surface of the glacier. Stresses and speeds were calculated using a method developed by Reference Kamb and EchelmeyerKamb and Echelmeyer (1986, equations (35a), (35b) and (39)) which accounts for longitudinal stress coupling. Details of stress calculations at Black Rapids Glacier can be found in Heinrichs (unpublished). The basal shear stress in 1977 is shown in Fiugre 3a.

The speed at the glacier surface due to ice deformation during the winters of 1977–78 (Fig 12a) and 1986–87 was calculated with ice properties determined using speeds observed at the 32 km site. It was assumed that no sliding was occuring at the 32 km site in the winter of 1977–78. If sliding were occuring, the ice properties determined from the calibration would overestimate deformability of the ice, so if anything, the calculated deformational velocities are too high rather than too low. The quantity termed “basal speed” is calculated as the difference between the observed winter speed and the calculated deformational speed. Even during winter, a substantial fraction of the motion is due to basal motion at most sites (Fig. 12b).

Fig. 12. Winter speeds. In the upper frame (a), measured speeds and calculated deformational speeds are shown. In the lower frame (b), the basal speed, calcualted as the difference between the measured speed and the calculated deformational speed, is shown. The negative basal speed calculated for the 4 km site indicates that ice deformation is umderestimated at the site; we do not believe negative basal motion is acutually occuring.
To determine how much of the winter speed change is due to changes in the rate of ice deformation, the difference between the 1977–78 and 1986–87 deformational speeds was calculated and compared with the change in measured speed (Fig. 13). It was assumed that changes in the rate of basal motion. Above 26 km, changes in the calculated deformational speed were negligible compared with chage in winter speed above 26 km between 1977 and 1987 was due to changes in basal motion.
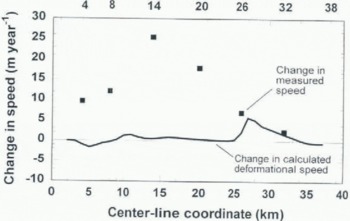
Fig. 13. Change in winter speed, 1977–87. The changes in deformational speed were small compated with the changes in measured speed. This implies most of the speed change was due to changes in measured speed. This implies most of the speed change was due to changes in basal motion.
Another important aspect of the basal motion is that both winter and summer speeds change with the long-term changes (Fig. 4). This implies that speeds during both season are affected by a year-round pricess that is driving the multi-year speed fluctutations. This type of behavior is apparently not confined to surge-type glaciers, however. Reference HodgeHodge (1974) observed a similar pattern of winter and summer speed changes during a 2 year period >at non-surge-type Nisequally Glacier on Mount Rainier, Washington, U.S.A.
As discussed earlier, a final noteworthy aspect of the basal motion is that seasonal-speed differences at each site are well correlated with the long-term increase in speed (Fig. 7). This aspect can also be seen in Figure 4: the amplitude of the saw-tooth seasonal speed pattern is of comparable size to the amplitude of long-term fluctuations in annual speed. Although it might be expected that the processes driving seasonal and long-term changes are substantially different, the observations indicate that factors important in causing a site to be susceptible to seasonal changes are likely the same as those which cause a site to be susceptible to long-term changes. Therefore, obervations of seasonal speed at a site are an important inidcator of basal conditions at that site.
Interaction between the loket tributary and the main trunk
The largest speed and gemoetry flucutuations occurred at the 14 and 20 km sites. The evolution of these two sites is indicative of a unique and important behavior of the reach of the glacier along the Denali Fault above the Loket tributary (from 23 km up through 14 km and into the pass to Susitna Glacier; Fig. 1), and that the Loket tributary plays a vital role in the quiescent-phase evolution of the glacier. Qualitatively, we belive that the main branch of the glacier is being “dammed” by steady flow into the main branch from the Loket tributary, resulting in thickening above the tributary’s entrance into the main branch (Fig. 9). This situation is analogous to “backwater” in river hydraulics in which the elevation of water in one channel controls that in another channel as the two channels merge. The reach above the Loket and up at least as high as 14 km lies on a bed that is highly susceptible to basal motion (Fig. 13), suggesting the possibility that the entering tributary is also ifluencing bed hydraulics.
On the reach along the Denali Fault above the Loket tributary, the parallel rise of speed between 1978 and 1986 at the 14 and 20 km sites indicates a strong longitudinal stress coupling between them; this piece of the glacier moves as nearly a single unit over the bed (Fig. 6). This strong coupling furter indicates that significant basal motion occurs in this section of the glacier. We infer this because coupling lengths are much longer over “slippery” glacier beds than over beds that allow less basal motion (Reference Kamb and EchelmeyerKamb and Echelmeyer, 1986). The block-motion situation was strongly displayed during the first observed period of speed-up from 1978 to 1986. The coupling was weaker during the periods of slow-down, as indicated by the observation that annual speed changes were not parallel at the two sites during the slown-down periods (before 1978 and 1987–91; Fig. 6). Apparently, during the periods of slow-down, there is less basal motion, which manifests itself in the form of lower speeds and weaker coupling.
Speed change at the Loket tributary sites (L-19 and L-22 km) appear to lag the main branch indicating either a weaker or a different coupling mechanism than on the main branch. It is also interesting to note that three of the sites which lie along the Denali Fault (14, 20 and 32 km: plotted with open circles in Figure 5) underwent larger speed increases than all the other sites. The exception is the 26 km site, which is influenced by the Loket tributary. The geology on the south side of the valley in which the Loket tributary and the main accumulation area originate is characterized by relatively competent, intrusive rock. North of the fault, the rock is much less competent, metamorphosed granitic and sedimentary rock (Reference PostPost, 1969; Reference NoklebergNokleberg and others, 1992). The fault trench itself is possibly filled with fault gouge, which has many properties in common with clays. Although not conclusive, this evidence suggests that geology has an important influence on longitudinal coupling and speed.
Longitudinal stres coupling is the explanation we favor to explain the coherent at the 14 and 20 km sites, The observations do not rule out other possibilities, for example, mass-balance-induced thickness changes, causing the coupled changed in speed. We would argue, however, that longitudinal stress coupling provides a plausible explanation for the glacier’s behavior.
Cause of the speed variations
Ice deformation driven by geometry changes has been ruled out as the primary cause of the speed variations (Fig. 13). There are several possible explanations for the long-term fluctuations in basal speed. The small changes in elevation (which have been shown to be mainly due to mass-balance variations; Fig. 11) and changes in basal shear stress caused by the changing geometry could be directly driving speed changes at the bed. In this scenario, the bed is extermely sensitive to stress changes, so that small elevation changes are enough to cause large changes in basal motion. Another possibility is that mass-balance variations drive changes in the basal motion directly by some process such as water input or storage at the bed. It is also possible that the basal speed fluctuations are not being driven directly by geometry or mass balance and are due to some completely different process, for example, the evolution of the basal drainage network. This possibility of an unrelated process is supported by the varying lag in time between the onset of speed changes and of elevation changes (Fig. 4). At this time we do not know what is causing the speed fluctutations except that the entering Loket tributary dams the main branch, influencing the reach above the entering tributary which is undergoing speed and geometry variations driven by an unknown basal process.
Comparisons with Variegated Glacier
The behavior of Black Rapids Galcier, during that part of its question phase where we have observational data, is significantly different from that of Variegated Glacier, another well-studied surge-type glacier in Alaska, Variegated Galcier most recently surged in 1982–83 (Reference KambKamb and others, 1985) and, prior to that, in 1964–65 (Reference PostPost, 1969). The data from Variegated Glacier spanned the last 10 years of its 15 year quiescent phase; the data from Black Rapids Glacier span a smaller part of the late-surge cycle: 22 years of an estimated 50–75 year long quiescent phase.
The speed at Variegated Glacier steadily increased during the period observed between its surges (Reference Raymond and HarrisionRaymond and Harrison, 1988, Fig. 5). In contrast, the speed of Black Rapids Glacier has undergone long-term fluctuations of as much as 45% about the mean. On Variegated Glacier, the annual speeds increased by up to 500% (u 1981/u 1973 = 5.0) and the annual speed increase were monotonie at all sites (Reference Raymond and HarrisionRaymond and Harrison, 1988). The largest annual speed increase at Black Rapids Glacier was (u 1986/u 1978 = 1.7) at 20 km, and was followed by a slow-down.
Where Black Rapdis Glacier is presently thinning (in the surge-receiving area, below about 28 km), the rate of thinning is similar to that observed in the corresponding area of Variegated Glacier. Where Black Rapids Glacier is thickening (in the surge-reservoir area, above 28 km), the thickening rate is an order of magnitude less than that observed on Variegated Glacier (Fig. 8).
Variegated Glacier is located in maritime southeast Alaska — a much higher-precipitation environment than the central Alaska Range where Black Rapids Glacier is located. Considerably more net accumulation occurs at Variegated than at Black Rapids Glacier (Reference BindschadlerBindschadler, 1982. Fig. 4). This is a possible reason for Variegated Glacier’s shorter evolution between surges than that of Black Rapids Glacier. Another possible reason is that Variegated Glacier is considerably smaller than (viz. about half the length of) Black Rapids Glacier.
In summary, Variegated Glacier evolved more steadily between its 1965 and 1982 surges than has Black Rapids Glacier since its most recent surge in 1936–37. Our observations on Black Rapids Glacier and those by Reference Clarke and BlakeClarke and Blake (1991) on Traparidge Glacier, which also show a substantially different quiescent-phase evolution than was observed on the well-known Variegated than was observed on the well-known Variegated Glacier, indicate that there may be a variety of mechanisms which cause surge-type behavior in glaciers.
Future Surges of Black Rapids Glacier
Three important questions should be asked about the next surge of Black Rapids Glacier. Will it surgeagain? And if so, when will the surge occur, and how large will it be? First, it is possible that the glacier is not in a quiescent phase between surges and, instead, is evolving towards a condition where it is unstable to surge in the present climate. The oscillatory behavior of the speed and geometry would seem to support this idea, or perhaps these fluctuations are the nature of surge-type glaciers with long periods. A conclusion cannot be drawn because of the lack of continuous, long-term observations of long-period, surge-type glaciers.
Concerning surge timing, the glacier is in a configuration similar to that prior to the 1936–37 surge; this supports the possibility of a imminent surge. The clearest indicator of this configuration is the size of the looped moraine being pushed out by the Loket tributary (Figs 1 and 2; Reference Post and LaChappellePost and Lachapelle, 1971). The area of this loop is now the same as the area of the loop carried down-glacier from the mouth of the Loket during the 1936–37 surge. This is a simple, obvious indicator of surge timing. However, although the moraine patterns are similar, the slope and elevation configuration may not yet have evolved to the same state as in late 1935. The negative indicator of an imminent surge is the speed fluctuation. Twice during the period of observation, the glacier slowed and moved away from the evolution towards a surge state when conditions became unfavourable for continued acceleration. Currently, the glacier is accelerating and could progress into surge state if the climate supports continued thickening and acceleration.
Concerning the size and extent of the terminus advance of the next surge, if the glacier were to advance across the Delta River as it has in the past, both the Richardson Highwat and the oil pipeline would be affected. The history of the moraines dicussed above (Reference Reger, Sturmann, Beger, Solie and TannaianReger and others, 1993) suggests than surge crossings of the Delta River are relatively rare events, at least compared with the surge period, which is probably 50–75 years. To illustrate, if the most recent crossing of the Delta River was 1710 BP (Fig. 1) and a 75 year surge period is assumed, 22 surges that did not cross the river have occurred since 1710 BP. On this basis, it would be surprising if the next surge crosses the Delta River and affects transportation facilities in the valley. However, the situation is not so clear when one condisers that more recent surges (such as that marked by the terminal moraine A in Figure 1) and the action of vigorous streams draining the glacier may have destroyed evidence of many earlier surges. Prediction of the magnitude of a surge (never accomplished before, to our knowledge) is compalicated by many factors: seasonality is an example. Because surges often stop suddenly during early summer when meltwater becomes abundant (Reference Harrison, Echelmeyer, Chacho, Raymond and BenedictHarrison and others, 1994), it follows, for example, that a cool spring and late summer could delay surge termination, resulting in a more extensive surge advance than if the season had been average.
Summary and Conclusions
Speeds and surface elevations have fluctuated during the course of 22 years of observations at Black Rapids Glacier, indicating that quiescent-phase evolution is not necessarily composed of monotonic changes in the surface geometry and basal stress, such as those observed at Variegated Glacier. Summarizing the speed observations, there have been coherent, long-term fluctuations in speed at all sites; these long-term fluctuations occur in both the winter and summer speeds (Fig. 4). The amplitude of the long-term fluctuation correlates well with the amplitude of the average seasonal-speed different at a site (Fig. 7). Surface elevation has also undergone long-term fluctuations at some sites (Fig. 4). The glacier is thinning in the surge-receiving area much faster than it is thickening in the reservoir area (Fig. 8). Cummulative deviation from the mean is the most important mass-balance term to consider for interpretations (Fig. 11).
Four primary interpretations were drawn from these observations. First, changes in basal motion, rather than changes in ice deformation due to geometry changes, have caused most of the changes in surface speed (Fig. 13). Secondly, the interaction between the Loket tributary and the main trunk of the glacier is an important factor in the quiescent-phase evolution. Thirdly, we considered several possible cause of the long-term speed variations. Small changes in elevation caused by mass balance (Fig. 11), which cause small changes in basal shear stress, may be directly driving the speed changes at the bed because the bed is extremely sesitive to stress. Alternatively, mass-balance variations could be driving changes in basal motion directly by some process such as water input or storage at the bed. Another possibility is that an unrelated process is drinving the speed fluctuations regardless of geometry or mass-balance variations. The fourth interpretation is that mass balance is an important driving force of the surface elevation changes (Fig. 11).
It is not certain if or when the glacier if or when the glacier will surge again. Black Rapids Glacier may not be capable of surging in the present climate, and the indicators of the imminence of the next surge are ambiguous. If it does surge, we believe it is unlikely that the terminus will advance across and dam the Delta River.
Acknowledgements
Scores of people have labored to gather the data presented here; we are grateful to them for the high quality and dedicated efforts they brought to their work at Black Rapids Glacier. D. Trabant and R. March of the USGS deserve special thanks for their two decades of work gathering much of the data presented here, C. Raymonds’s manuscript review helped focus our presentation. The early years of the project were supported by the Alyeska Pipeline Company, the middle years by the National Science Foundation grants DPP85-19110, DPP88-22584 and OPP922783.