


1. Introduction
Surge-type glaciers account for only ~1% of all global glaciers, but they tend to cluster in a few regions (Sevestre and Benn, Reference Sevestre and Benn2015). Usually, dozens of such glaciers develop in the same arctic or alpine region (Benn and Evans, Reference Benn and Evans2010). This brings the challenge to reconstruct or forecast glaciers response to climate change (Yde and Paasche, Reference Yde and Paasche2010).
Two well-known theories about the trigger mechanism of surging have been formed based on field observations: hydrological control and thermal control (Kamb and others, Reference Kamb1985; Clarke and others, Reference Clarke, Schmok, Ommanney and Collins1986; Murray and others, Reference Murray, Strozzi, Luckman, Jiskoot and Christakos2003). Hydrologically controlled surges are typical for glaciers in Alaska (Kamb, Reference Kamb1987), while a thermally controlled meltwater mechanism might explain some surges in Svalbard (Fowler and others, Reference Fowler, Murray and Ng2001; Murray and others, Reference Murray, Strozzi, Luckman, Jiskoot and Christakos2003). However, a recent theory for surging behaviour includes both temperate and polythermal glacier surges and is based on coupled mass and enthalpy budgets (Sevestre and Benn, Reference Sevestre and Benn2015; Benn and others, Reference Benn, Fowler, Hewitt and Sevestre2019). However, the mechanism of surges in most regions are still ambiguous, especially that of glacier surges in areas of the Tibetan Plateau, like the Karakoram Mountains, Muztag Peak in Pamir and West Kunlun Mountains (Paul, Reference Paul2020).
There is especially limited knowledge about how glaciers surge on the central Tibetan Plateau. Only tens of surge-type glaciers in West Kunlun and Central Kunlun have information available about the surface velocity changes of the surging phase (Yasuda and Furuya, Reference Yasuda and Furuya2015; Chudley and Willis, Reference Chudley and Willis2018; Fu and others, Reference Fu, Li and Zhou2019; Gao and others, Reference Gao2021; King and others, Reference King, Bhattacharya and Bolch2021). There may even be more surge-type glaciers that have not been reported. Wei and others (Reference Wei2014) concluded that ~890 (1.5%) potential surge-type glaciers were located in the interior area of the Tibetan Plateau during the period of 1970–2009. Thus, more observations on the surging glaciers on the Tibetan Plateau are required.
Geladandong Peak in the Central Tibetan Plateau is the highest mountain in the source region of the Yangtze River (Figs 1a, b). There were 19 surge-type glaciers identified based on elevation and velocity changes analysis (Yan and others, Reference Yan, Lv, Ruan, Yan and Liu2019; Gao and others, Reference Gao2021; King and others, Reference King, Bhattacharya and Bolch2021).
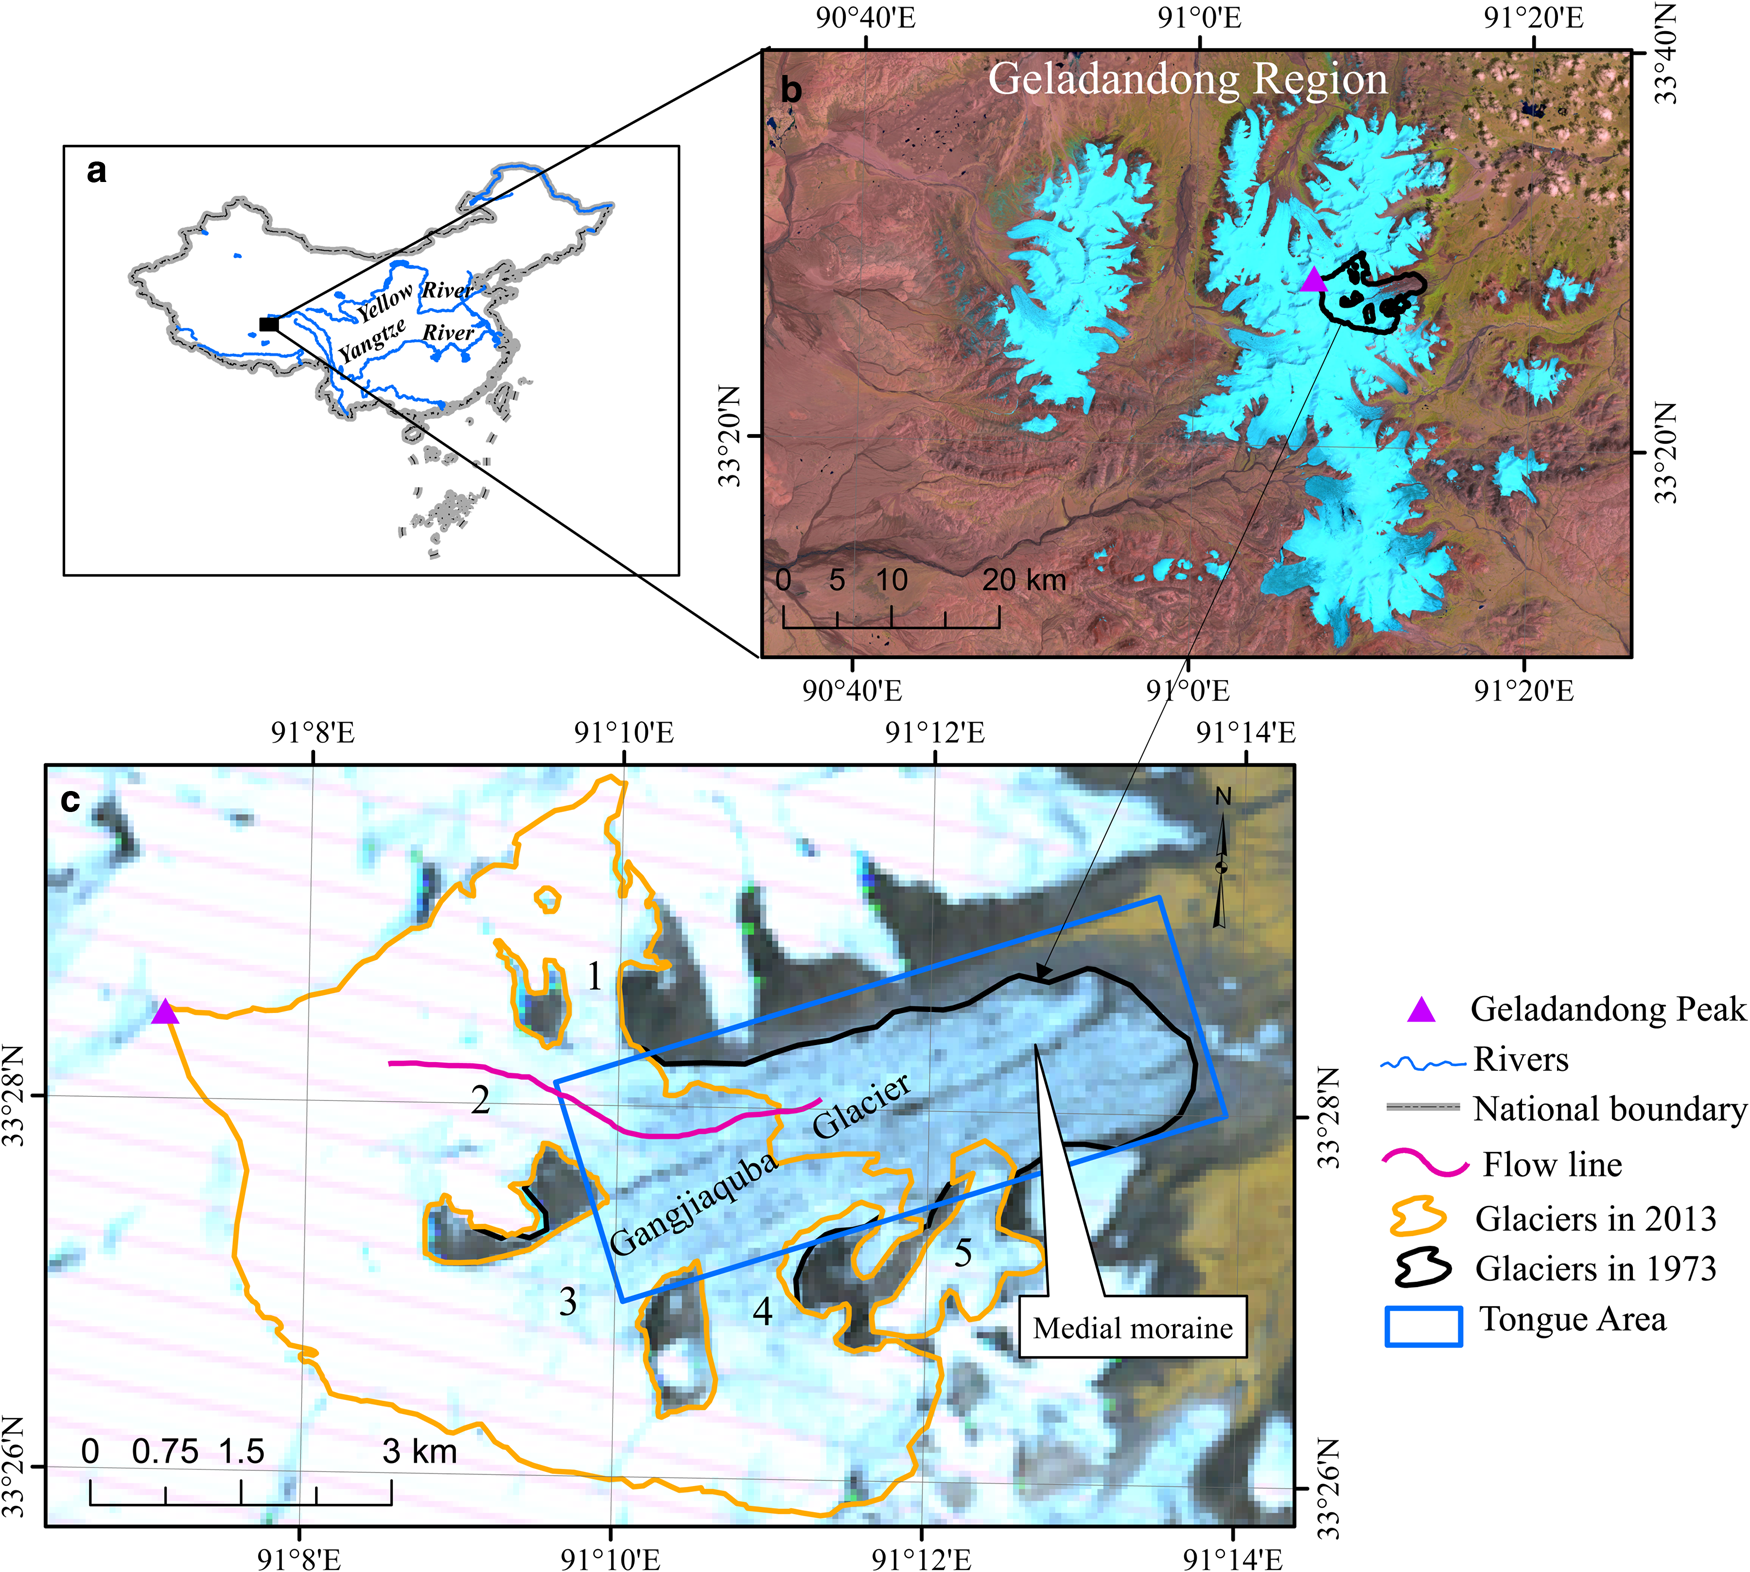
Fig. 1. Location of the Geladandong region and the Gangjiaquba Glacier. (a) The location of Geladandong region, (b) the location of the glacier (background is the Landsat TM of 8 November 2008), and (c) the Gangjiaquba Glacier on the Landsat MSS of 16 July 1973. The tributaries are numbered 1–5. The glacier boundaries in 1973 and 2013 were obtained from Xu and others (Reference Xu, Shangguan and Wang2018).
Gangjiaquba Glacier (33.46°N, 91.17°E, GLIMS ID G091171E33460N) originates from Geladandong Peak (Figs 1b, c). In 1968, it covered an area of 37.44 ± 1 km2, had an average thickness of 146 ± 3 m and descended across a large altitudinal range of 6621–5300 m a.s.l. (Pu, Reference Pu1994). There is a long medial moraine between tributaries 2 and 3 but the glacier is almost devoid of debris except for this medial moraine. Gangjiaquba Glacier was reported as the largest shrinkage in area and recession in length of all glaciers in Geladandong region, with five main tributaries reducing to four tributaries between 1973 and 2013 (Xu and others, Reference Xu, Shangguan and Wang2018), and was identified as a surge-type glacier by King and others (Reference King, Bhattacharya and Bolch2021). However, change of morphology (geometry, crevasses) and detailed change of velocity during the active surge phase, and velocities over the quiescent phase, which was not shown in previous study (King and others, Reference King, Bhattacharya and Bolch2021), are important parameters for the glacier surge model (Benn and others, Reference Benn, Fowler, Hewitt and Sevestre2019). Here changes in surface velocity, surface elevation, tongue area and the medial moraine are employed to recognize how the surge build up over the quiescent phase and how the glacier surges and terminates.
2. Datasets and methods
Thirty-nine Landsat 1 MSS, 5 TM, 7 ETM+ and 8 OLI images from 1973 to 2019, offered by the United States Geological Survey (USGS, http://earthexplorer.usgs.gov/), were used in this study (Table S1). Velocities were extracted by employing the COSI-CORR (Co-registration of Optically Sensed Images and Correlation) software (Leprince and others, Reference Leprince, Barbot, Ayoub and Avouac2007; Scherler and others, Reference Scherler, Leprince and Strecker2008), which has been proven to be effective for displacement measurement using Landsat images (Pitte and others, Reference Pitte2016; Paul and others, Reference Paul, Strozzi, Schellenberger and Kääb2017; Chudley and Willis, Reference Chudley and Willis2018; Liu and others, Reference Liu2020). We set the initial search window and the final window to 32 and 16 pixels for TM band 3 (64 and 16 pixels for OLI band 8), which is a compromise between the image pixel size and the expected displacement of the glacier surface. The threshold of the signal-to-noise ratio was set to 0.95 and the step size of 2 pixels for TM (4 for OLI) was set for velocity interpolation with 60 m resolution. The influence of cloud and shadow was removed by the low-pass filter, and the anomalous flow direction of vectors was removed manually (Fu and others, Reference Fu, Li and Zhou2019). The displacement was scaled to velocity with units of m a−1. Seventeen phases of velocity were calculated based on 18 images (Table S2).
The glaciomorphological change of glacier tongue area, medial moraine, supraglacial lakes and crevasses were assessed by the terminus evolution (Fig. 1). Six glacier-tongue-area binary images of Landsat TM/OLI (30 July 1986, 31 August 1992, 17 September 1998, 1 September 2004, 1 August 2010, 2 October 2015) were generated through the segmentation of the band ratio image TM 3/TM 5 (for Landsat 8 image OLI 4/OLI 6) by a threshold of 2.1–2.4 (Table S1). A binary classification image of glacier tongue area from MSS (16 July 1973) was generated by the minimum-distance supervised classification into ice and ice-free areas, implementing in ENVI/IDL 5.3 software using the composite image of bands 7, 6 and 5 after resampling to 30 m × 30 m resolution. Glacier tongue area changes between images were classified as 1 for expansion (non-glacier changing to glacier), 0 for no change and −1 for shrinkage by post-event binary image minus previous one. In addition, the annual medial moraine was digitized to figure out the changes of tributaries based on 36 images. The position of medial moraine relative to 1973 was calculated using the average of seven points on the change direction (Fig. S1). For supraglacial lake and crevasse changes, we classified only whether the features existed at each time period, and did not calculate their area.
Glacier surface elevation changes were used to confirm the surge through the downstream transfer of ice which is proven to be a characteristic of the surge event (Grant and others, Reference Grant, Stokes and Evans2009; Sund and others, Reference Sund, Eiken, Hagen and Kääb2009). Three multitemporal digital elevation models (DEMs) from topographic maps of 1968 based on aerial photography (DEM1968), shuttle radar topography mission (SRTM) in band C from 2000, and SPOT 6/7 stereo image pairs from 6 October 2013 and 18 November 2014 (DEM2014) were provided by Xu and others (Reference Xu, Shangguan and Wang2018) for the elevation difference analysis. The penetration in snow and ice of SRTM C has been corrected using SRTM X. The error due to the co-registration and coarse resolution was removed using the method of Gardelle and others (Reference Gardelle, Berthier and Arnaud2012). The difference between SRTM and DEM1968 (DEM2014) off glacier area shown in Figure S2 was assessed as 0.36 ± 8.95 m (−0.05 ± 3.92 m, mean ± std dev.).
3. Results
In the first cloud-free Landsat MSS from 1973, Gangjiaquba Glacier covers an area of 36.56 ± 1.13 km2, has a length of 10.0 km and a tongue with a width of 1.8 km. Seventeen velocity fields generated between 1986 and 2019 indicate three stages to the evolution of the surge (Fig. S3). Changes along the profile of the median flowline are shown in Figure 2. From 1986 to 2010, the velocity across much of the glacier area was <5 m a−1, except for tributary 2 at the junction towards 3 (Figs S3a–g). Here, the velocity was 30–45 m a−1 from 1986 to 1995, and fell below 5 m a−1 after 1995. Between 2006 and 2010, the velocity rose to 30 m a−1. In this stage, the mean glacier velocity was <5 m a−1 and changed little annually.
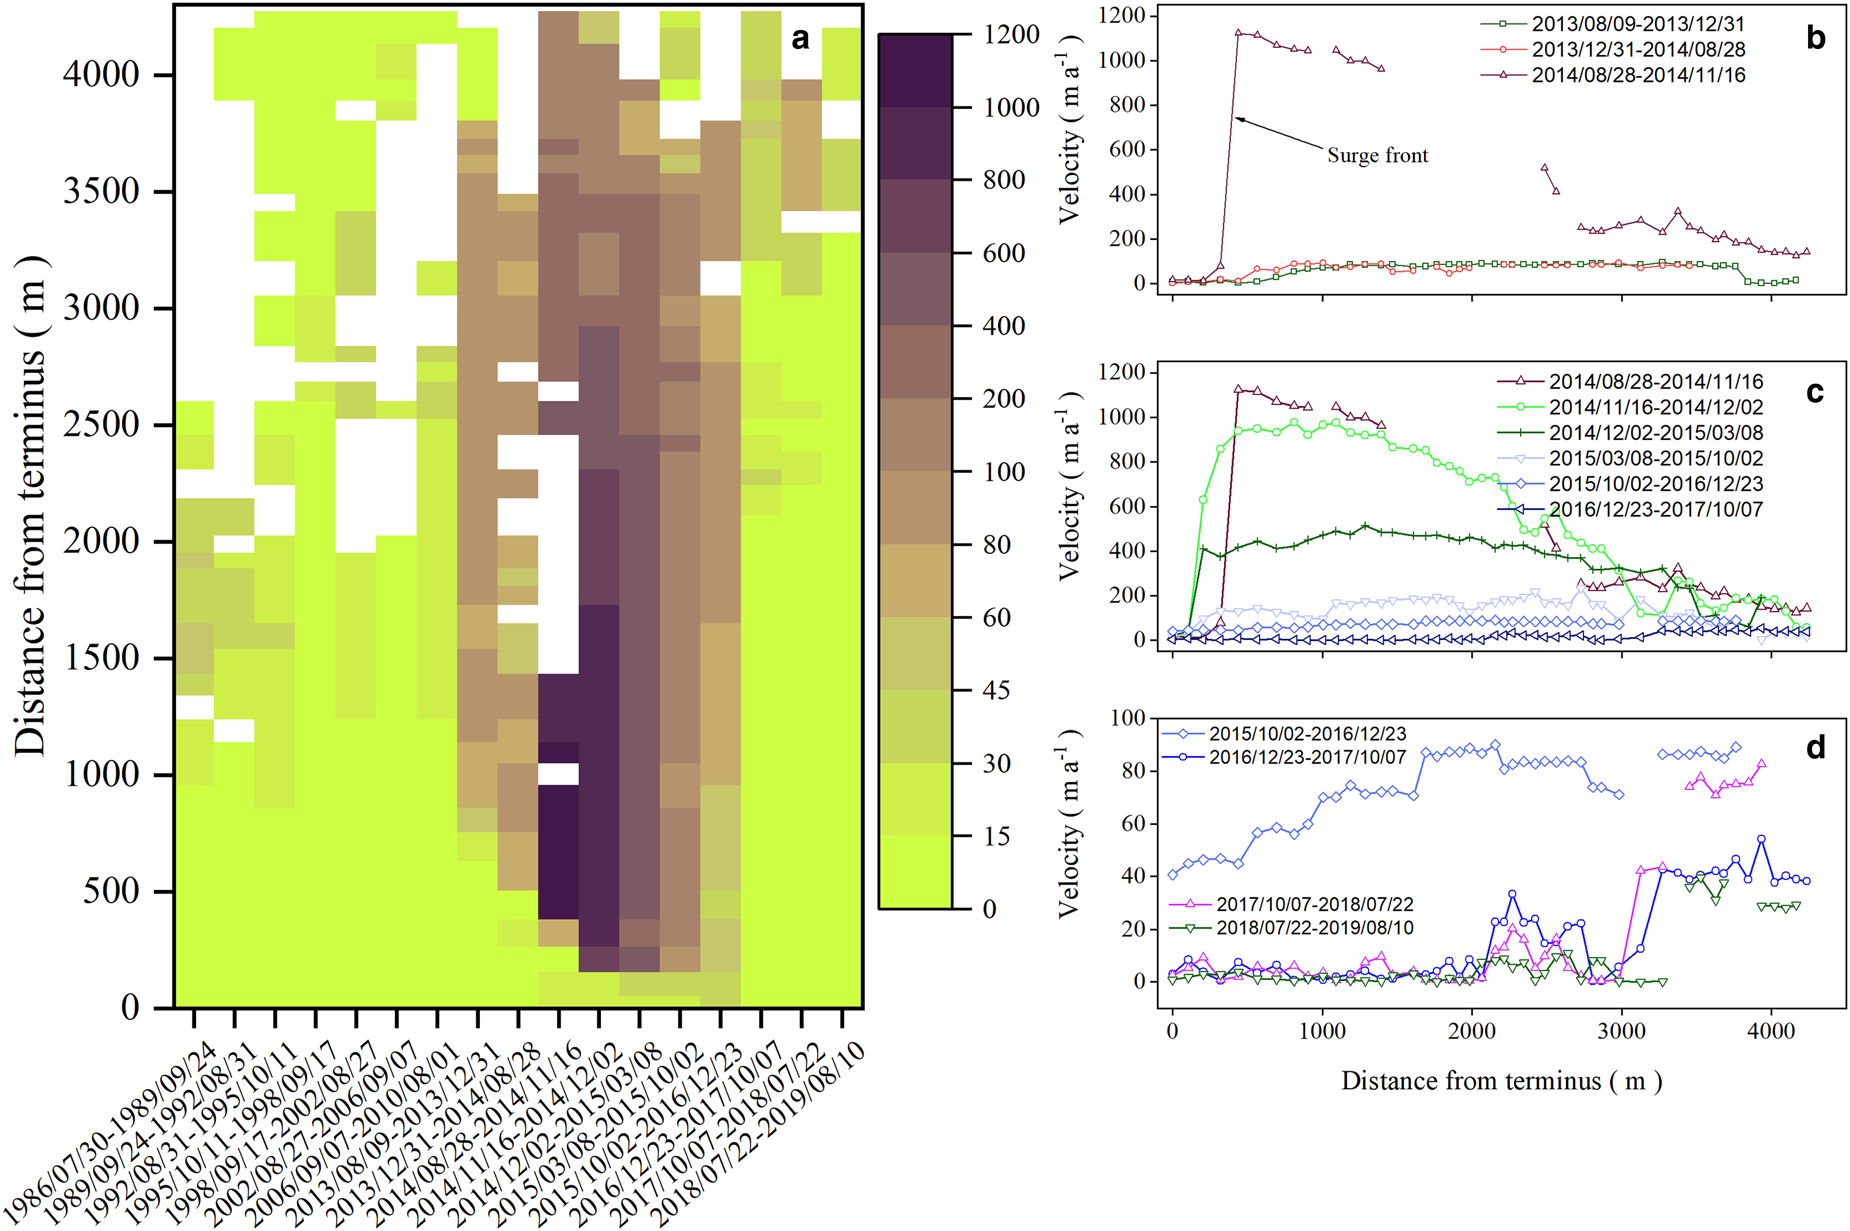
Fig. 2. Evolution of flow velocities from 1986 to 2019 along the flowline in Figure S3. (a) The Hovmöller plot, (b) velocity from 9 August 2013 to 16 November 2014 (the surge build up to the maximum), (c) 16 November 2014 to 23 December 2016 (the surge weakening until exhausted), and (d) 23 December 2016 to 10 August 2019 (after the surge).
The second stage was from 2013 to 2016, and was marked by a significant increase of motion over the ablation areas of tributaries 1 and 2, indicative of a surge during this period (Figs S3h–n). Between 9 August 2013 and 28 August 2014, the velocity increased to 45–86 m a−1 over the ablation area of tributary 2 and propagated down to the terminus with the same speed (Figs S3h–i), while the surge built up. The maximum motion of 1100 m a−1 (3.0 m d−1) occurred over 28 August to 16 December 2014, following the surge initiation (Figs 2a, b). A surge front, which was described as a kinematic wave (Kamb and others, Reference Kamb1985), accompanied this strongest acceleration of the glacier. After this peak movement, the surge front advanced and weakened continuously (Fig. S3c). The front disappeared between 2 October 2015 and 23 December 2016 with velocity decreasing to 45–85 m a−1, similar to the pre-surge velocity. Although tributary 1 was also observed to surge, it had a much lower maximum velocity than tributary 2 during this surging phase (Figs S3h–j). The maximum speed of tributary 1 was ~150 m a−1, which occurred between 16 November 2014 and 8 March 2015, 3 months later than in tributary 2.
After 23 December 2016, the velocity decreased to <5 m a−1, and the surge terminated (Fig. 2d). Meanwhile, the velocity upstream of tributary 2 increased to 60 m a−1, indicative of a potential subsequent phase of surging.
Change maps with a resolution of 30 m on the glacier surface elevation from 1968 to 2014 are visualised in Figure 3. These indicate a reduction in elevation of the tongue area at a rate of 2.0 ± 1.1 m a−1 from 1968 to 2000, alongside an area of thickening on the junction of tributary 2 towards 3 at a rate of 0.35 ± 0.16 m a−1 (Fig. 3a). This 1.5 km-long thickening zone (1.1 ± 0.4 km2 with 1.3 ± 0.2 × 10⁷ m3 ice volume) is likely the reservoir zone. From 2000 to 2014, ice transferred towards the snout from the reservoir zone (Fig. 3b). A dynamic balance line was identified, which had no elevation change when ice transferred to the receiving zone, and was observed on many glaciers (Raymond and others, Reference Raymond, Johannesson, Pfeffer and Sharp1987; Kochtitzky and others, Reference Kochtitzky2019). Continuous thickening in the upstream of tributary 3 and thinning in the lower part from 1968 to 2014 steepened this tributary.

Fig. 3. Surface elevation changes of the glacier from 1968 to 2014 masked by the glacier boundary from 1973. (a) Changes between 1968 and 2000 (DBL: dynamic balance line) and (b) changes between 2000 and 2014 (shadow area removed, purple line is the glacier boundary in 2000).
The glacier tongue covered an area of 10.7 ± 2.1 km2 in 1973. The glacier tongue area experienced expansion and shrinkage at the same time in different zones from 1973 to 2015 (Figs 4a–f). The shrinkage occurred in the lower part of the tongue at heterogeneous speed temporally. The shrinkage rate of area increased from 0.1 ± 0.02 to 0.27 ± 0.08 km2 a−1 from 1973 to 2004, and then slowed down (Fig. 4g). Meanwhile, expansion was observed at the junction of tributaries 2 towards the 3 over the observation period, and the front of tributary 1 from 2010 to 2015 (Fig. 4h). In combination with the surface velocity and elevation changes, it is likely that the ice being received from tributary 2 displaced tributary 3 and thus the medial moraine between them. It moved southeastwards by 356 ± 11.4 m (9.1 ± 0.3 m a−1) from 1973 to 2012, and 302 ± 11.3 m from 2012 to 2016 (Fig. S1 and Fig. 4h).
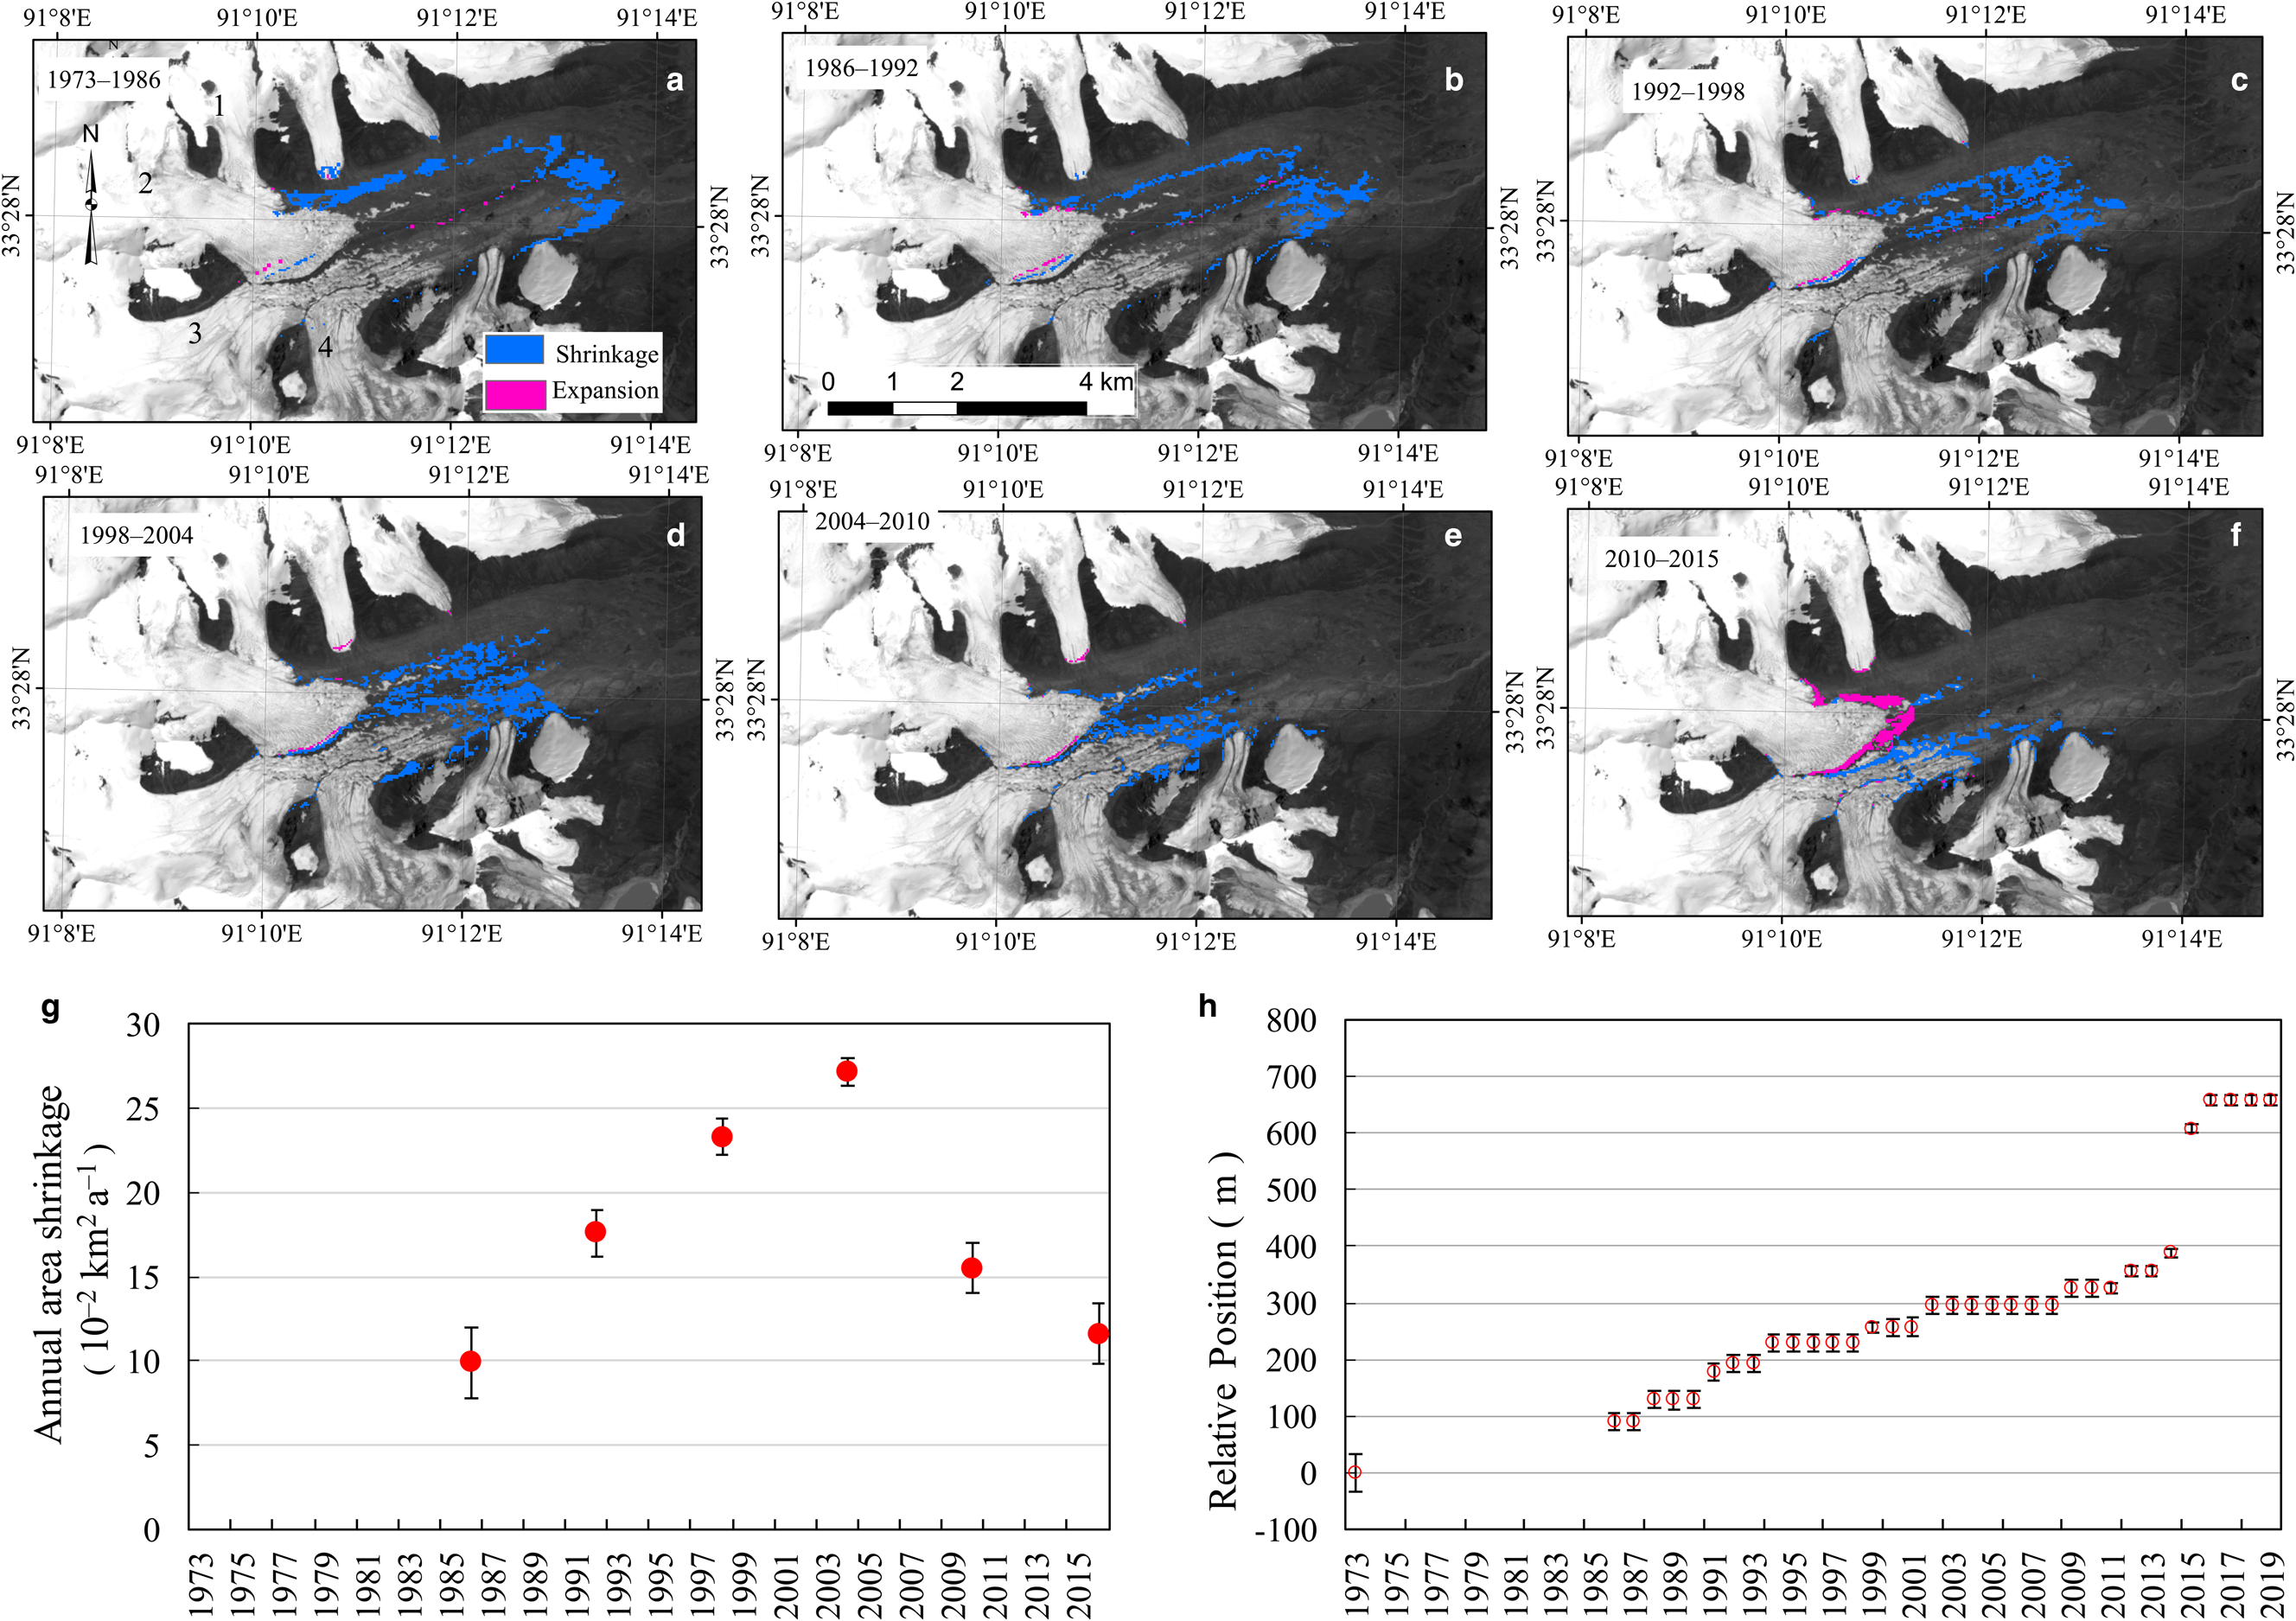
Fig. 4. Changes of glacier tongue from 1973 to 2019. (a–f) The area change over 1973–1986, 1986–1992, 1992–1998, 1992–2004, 2004–2010, 2010–2015, the background is the panchromatic band of Landsat 8 OLI from 2013/08/09; (g) the annual shrinkage area from during these periods; and (h) the position relative to 1973.
Changes of crevasses and supraglacial lakes on the terminus from 2013 to 2019 are shown in Figure 5. From 9 August 2013 to 28 August 2014, an advance of 50 ± 11.3 m without an area of fresh crevasses was observed. During the active surging phase (28 August 2014 to 23 December 2016), many fresh transverse crevasses emerged on the surging zone (Fig. 5c). However, the surge bulge was not visible on Gangjiaquba glacier on Landsat images during the observed period, which was clear on some surge-type glaciers during the active surge phase (Murray and others, Reference Murray, Dowdeswell, Drewry and Frearson1998; Jiskoot and Juhlin, Reference Jiskoot and Juhlin2009). This surge also resulted in a total advance of 500 ± 11.2 m by tributary 2 (Fig. 5, green arrows), and of 180 ± 11.2 m by tributary 1 (Fig. 5, yellow arrows).
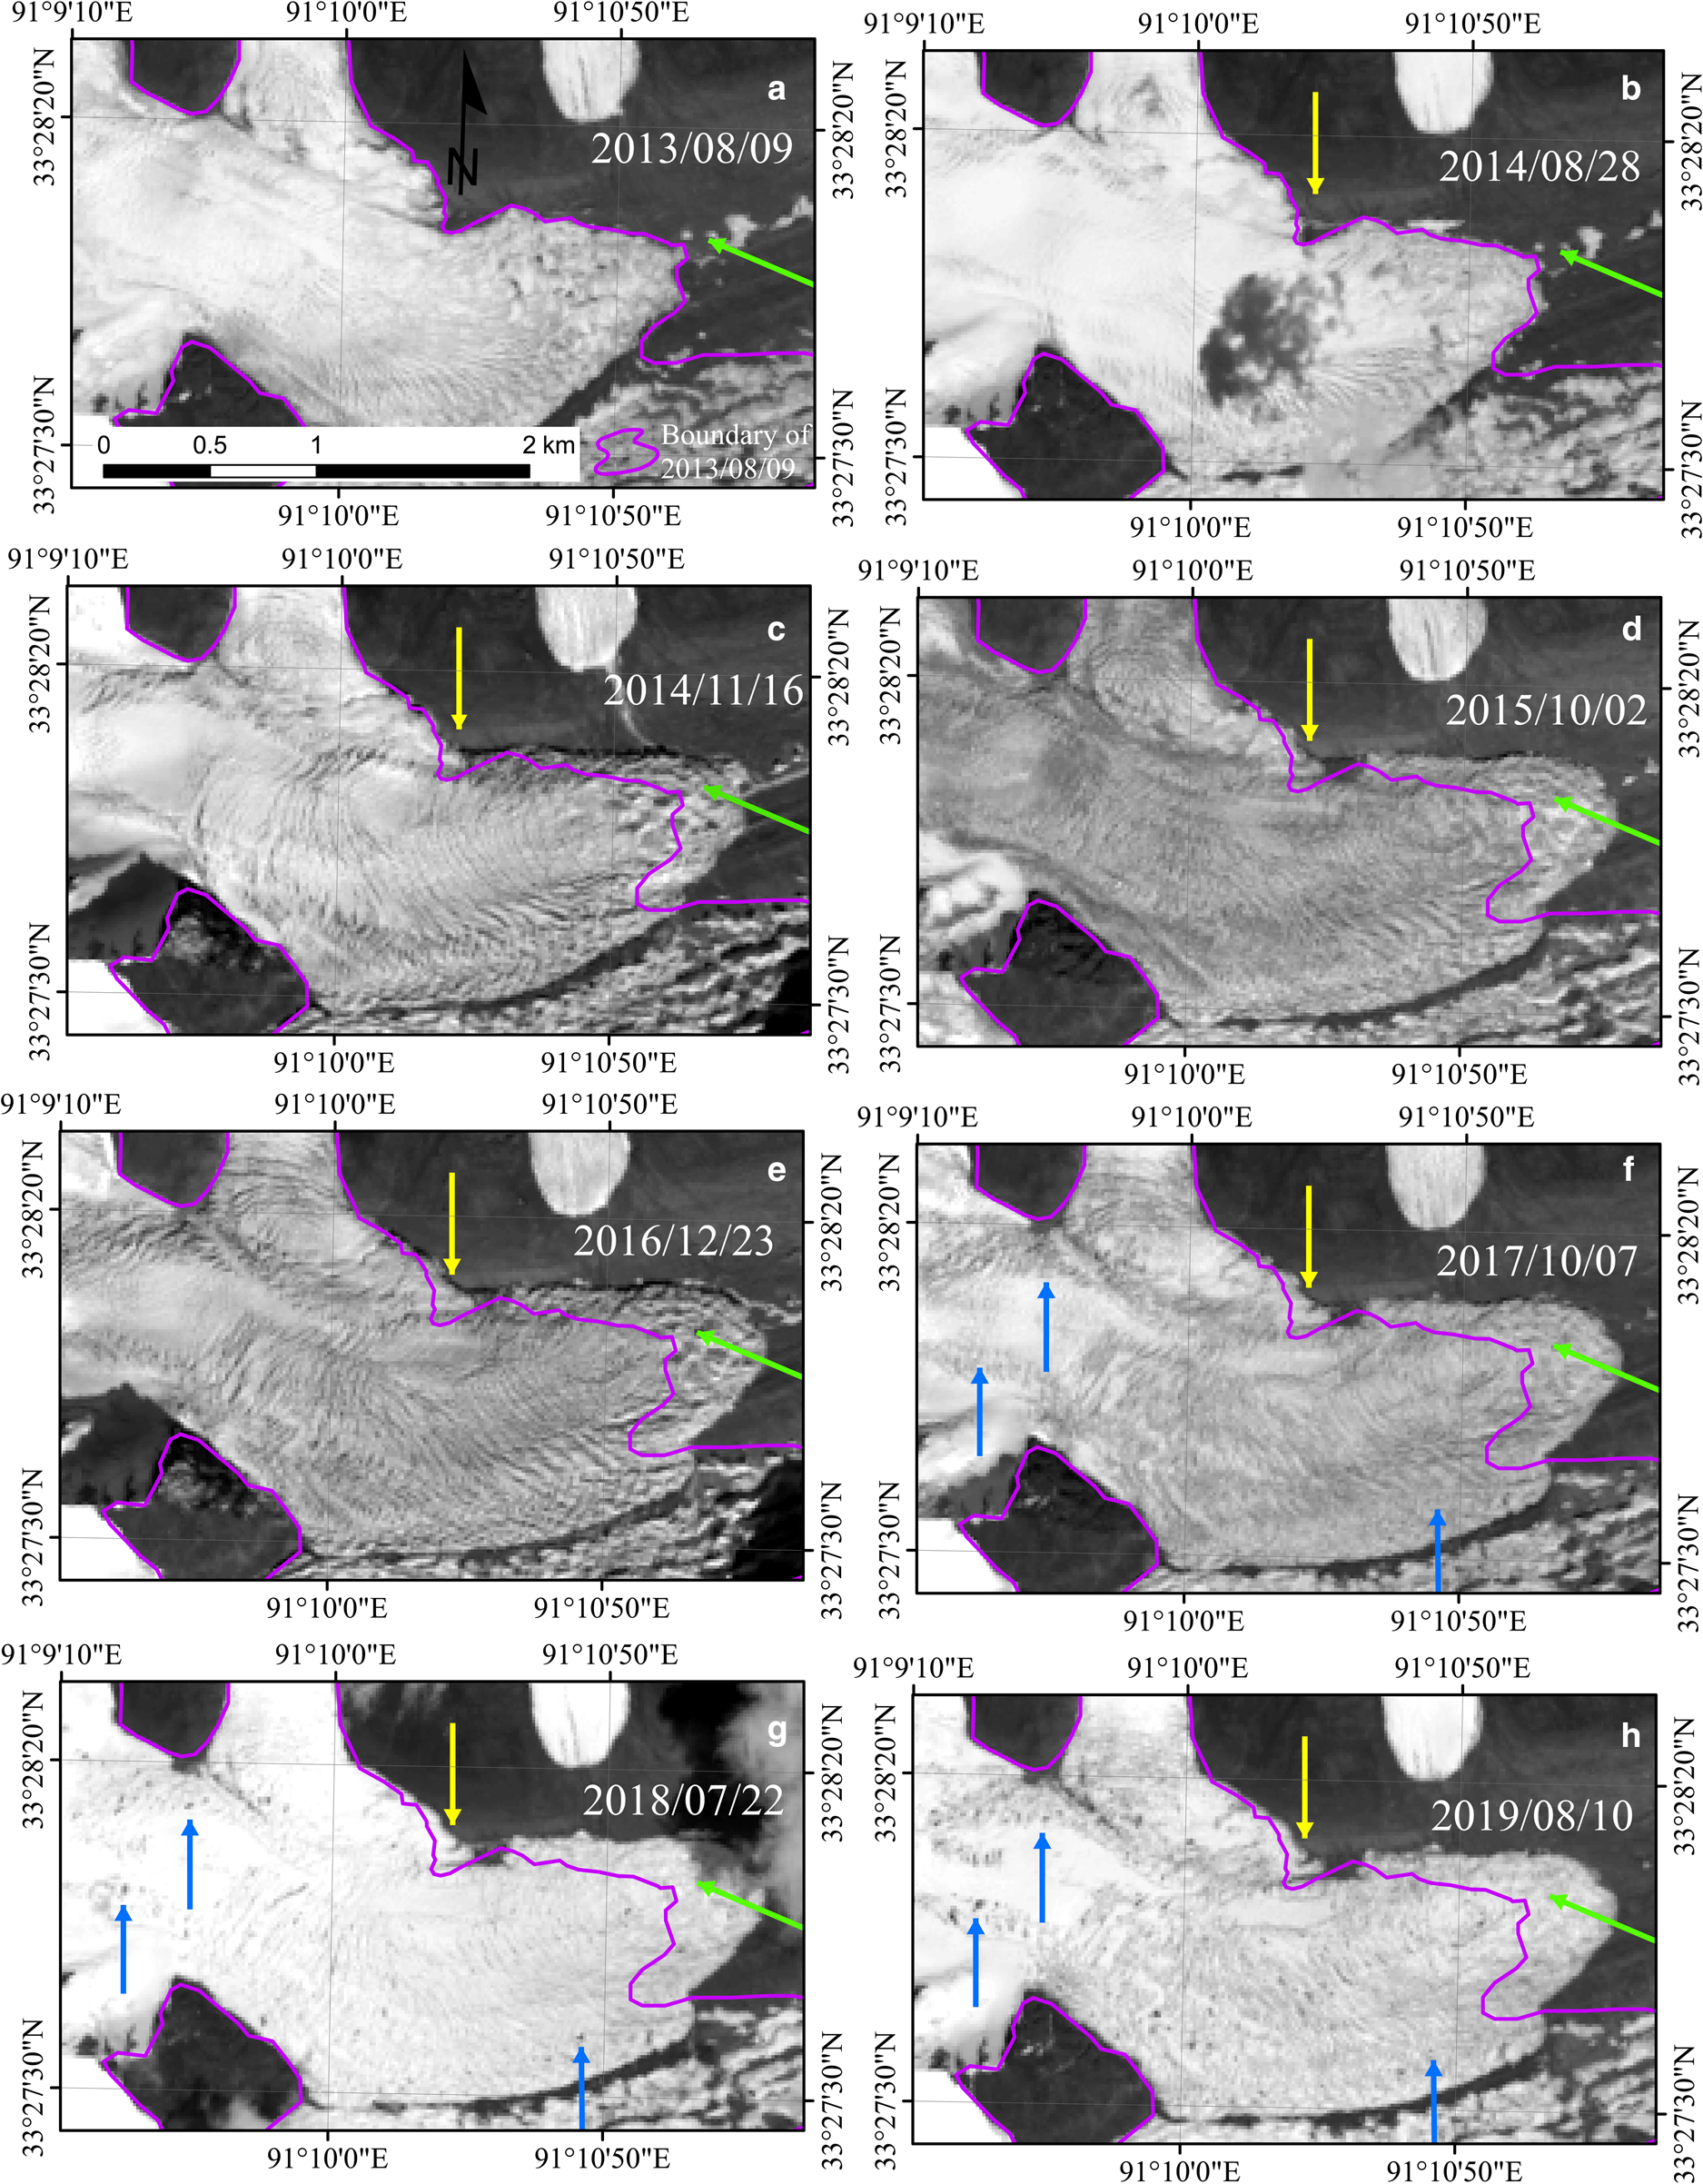
Fig. 5. Surface changes of Gangjiaquba Glacier from 2013 to 2019. The yellow arrows show the changes at the terminus of tributary 1, the green arrows show the changes at the terminus of tributary 2, and the blue arrows show supraglacial lakes that formed after surging. Here arrows do not change with images.
After the surge, an increase in supraglacial meltwater in ponds and crevasses was observed over the surged zone (Fig. 5, blue arrows). Soon after the surge (23 December 2016 to 10 August 2019), a recession of tributary 1 occurred, but not of tributary 2.
4. Discussion and conclusion
A complete surging process of Gangjiaquba Glacier was observed through changes of velocity, terminus morphology and elevation changes. Surging initiated in the summer of 2013, was active from the end of summer in 2014–2016, and was depleted after 2016. The surging lasted for ~3 years, resulting in the terminus advancing by 500 ± 11.2 m, pushing the medial moraine southeastwards 302 ± 11.3 m. The maximum velocity occurred between 28 August and 2 December 2014, and was 1100 m a−1 (3 m d−1). It has comparable maximum velocity and similar surging duration with its two adjacent surge-type glaciers (G091091E33424N and G091071E33463N) (Yan and others, Reference Yan, Lv, Ruan, Yan and Liu2019), which have a similar area as Gangjiaquba (27.03 ± 0.83 and 34.92 ± 1.08 km2) (Xu and others, Reference Xu, Shangguan and Wang2018). The maximum velocity observed in our study is about seven times as that observed by King and others (Reference King, Bhattacharya and Bolch2021). It is the longer observation period by King and others (Reference King, Bhattacharya and Bolch2021) that reduce the velocity value. Correspondingly, the maximum velocity of other surge-type glaciers (<100 m a−1) in Geladandong region was also much smaller than that of Gangjiaquba (Gao and others, Reference Gao2021; King and others, Reference King, Bhattacharya and Bolch2021).
The maximum velocity of Gangjiaquba Glacier is comparable to that of reported surging-type glaciers in the West Kunlun and Central Kunlun Mountains (0.2–4.5 km a−1) (Yasuda and Furuya, Reference Yasuda and Furuya2013; Chudley and Willis, Reference Chudley and Willis2018; Fu and others, Reference Fu, Li and Zhou2019). Although some surge-type glaciers in the West-Kunlun are smaller, they have similar terminus advance (549–1524 m) but longer surging duration (Chudley and Willis, Reference Chudley and Willis2018). However, the maximum velocity of Gangjiaquba is much smaller than that of the Shisper Glacier (48 m d−1) in the Karakoram Mountains, even in the similar size with an area of 26 km2 (Rashid and others, Reference Rashid, Majeed, Jan and Glasser2020). Gangjiaquba has a much shorter surging duration than some surge-type glaciers in Svalbard (Murray and others, Reference Murray, Dowdeswell, Drewry and Frearson1998, Reference Murray, Strozzi, Luckman, Jiskoot and Christakos2003).
Transfer of ice from the reservoir area to the receiving area was observed through the elevation changes from 1968 to 2014. Although the reservoir zone of Gangjiaquba Glacier was not calculated over the entire quiescent phase, the location of the dynamic balance line changed little (cf. Raymond and others, Reference Raymond, Johannesson, Pfeffer and Sharp1987; Kochtitzky and others, Reference Kochtitzky2019). Our observed length of reservoir zone of Gangjiaquba Glacier was much shorter than that of Sabche Glacier in Nepal, which has a much smaller area (9.1 km2) (Lovell and others, Reference Lovell, Carr and Stokes2018). This might be why this surge of Gangjiaquba Glacier has a relatively low surge peak velocity.
Our results show two tributaries surged in different amplitudes during 2013 and 2016, another tributary was still in thickening of reservoir zone. This heterogeneous surging pattern across different tributaries also occurs on other glaciers (Hewitt, Reference Hewitt2007; Shangguan and others, Reference Shangguan2016; Paul, Reference Paul2020).
Supplementary material
The supplementary material for this article can be found at https://doi.org/10.1017/jog.2021.86
Acknowledgements
This research was funded by the Key Research Program of Frontier Sciences, CAS (grant No.: XDA19070501), National Natural Science Foundation of China (grant No.: 41671075 and 41950410575).


 Open access