


Introduction
Subaqueous calving and melting have been identified as important processes at water-terminating margins and have the potential to make large contributions to glacier mass loss (Reference Eijpen, Warren and BennEijpen and others, 2003; Reference Motyka, Hunter, Echelmeyer and ConnorMotyka and others, 2003; Reference Haresign, Warren, Harris and MurtonHaresign and Warren, 2005). Recent observations show that ice losses from calving glaciers can be strongly influenced by processes operating below the waterline, particularly subaqueous melting and buoyancy-driven calving (e.g. Reference VenterisVenteris, 1999; Reference Motyka, Hunter, Echelmeyer and ConnorMotyka and others, 2003; Reference Boyce, Motyka and TrufferBoyce and others, 2007; Reference NickNick and others, 2012). However, owing to a lack of quantitative data, the potential impact of these two forms of ice mass loss on glacier mass balance and volume reduction remains uncertain (Reference Benn, Warren and MottramBenn and others, 2007). Quantifying these contributions is made particularly difficult by various factors, including the presence of a debris cover which is known to reduce both melting and buoyant forces acting on ice (Reference Hunter and PowellHunter and Powell, 1998; Reference Purdie and FitzharrisPurdie and Fitzharris, 1999), along with the inherently hazardous working environment of the calving glacier terminus. Subaqueous calving also poses a significant hazard to users of water bodies into which these glaciers calve (Reference Benn, Warren and MottramBenn and others, 2007). In order to fully understand the potential contribution that subaqueous calving and melting may make to glacier mass loss it is necessary to understand: (1) how submerged extensions of glacier termini (‘ice ramps’) are created and maintained; (2) the effect debris cover has on ice ramp evolution; and (3) how ice ramps contribute to mass lost at subaqueous termini. Establishing the presence or absence and, if present, the extent of such ice ramps will assist in predicting future lake expansion at lacustrine calving margins (Reference Quincey and GlasserQuincey and Glasser, 2009).
We have applied a unique combination of sub-bottom sonar profiling and echo sounding to identify ice on the lake floor and to examine the subaqueous terminal morphology of the proglacial lakes of Mueller, Hooker and Tasman glaciers in Aoraki/Mount Cook National Park in New Zealand’s central Southern Alps (Fig. 1). These glaciers are all debris-covered lake-calving glaciers that have undergone significant downwasting and recession in recent decades. The aims of this study are threefold: (1) to map the subaqueous morphology of these lakes near the calving face; (2) to identify key characteristics of the subaqueous morphology of the termini of these three glaciers; and (3) to determine what processes control the development and evolution of subaqueous termini.
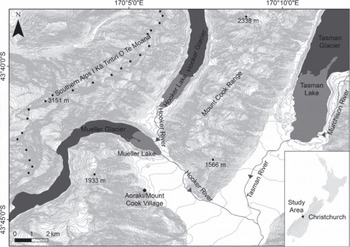
Fig. 1. Location of Mueller, Hooker and Tasman glaciers and their proglacial lakes. The Main Divide of the Southern Alps is highlighted by black dots.
In this study, we use high-resolution compressed high-intensity radar pulse (CHIRP) seismic sonar to identify the location and characteristics of subaqueous ice ramps extending from the termini of three freshwater calving glaciers. CHIRP seismic profilers remotely determine the acoustic attenuation of lake floors, with individual features giving varied acoustic returns (Reference JakobssonJakobsson, 1999; Reference Duck and HerbertDuck and Herbert, 2006; Reference Lafferty, Quinn and BreenLafferty and others, 2006; Reference Zhou, Jiang and ShiZhou and others, 2007). The varying acoustic returns allow the identification and delineation of the spatial extent of subaqueous ice ramps allowing, for the first time, observations on ice ramp morphology and temporal development.
Study Area
Mueller, Hooker and Tasman glaciers are located on the eastern side of the Main Divide of the central Southern Alps in Aoraki/Mount Cook National Park (Fig. 1). Since reaching their Little Ice Age (LIA) maximum in the mid-late 19th century, the three glaciers have progressively downwasted (Reference GellatlyGellatly, 1985; Reference BlairBlair, 1994; Reference Kirkbride and WarrenKirkbride and Warren, 1999; Reference Purdie and FitzharrisPurdie and Fitzharris, 1999; Reference Gjermundsen, Mathieu, Kääb, Chinn, Fitzharris and HagenGjermundsen and others, 2011), with the development of proglacial lakes and calving termini in the late 20th century (Reference Kirkbride and WarrenKirkbride and Warren, 1999). All three glaciers now terminate in proglacial lakes (Figs 1 and 2), but there is a paucity of research on the calving processes active at each glacier. Only subaerial calving processes have previously been studied in any detail, with the focus typically being at Tasman Glacier (e.g. Reference RöhlRöhl, 2005). As with most freshwater calving glaciers around the world, very few data exist on the subaqueous terminus morphology at these glaciers.
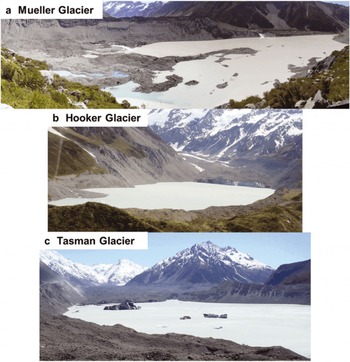
Fig. 2. Mueller, Hooker and Tasman glaciers and their proglacial lakes. (a) The terminus of Mueller Glacier (on the left of the photograph) and proglacial lake (February 2011). Hooker River can be seen entering the lake in the upper right-hand corner. The photograph is taken from the southwestern side of Mueller Lake looking northeast. Hooker Glacier and Lake are behind the lateral moraine in the centre of the photograph. (b) Hooker Glacier and Lake looking northeast towards Aoraki/Mount Cook (November 2009). Hooker Glacier can be seen flowing down-valley, terminating in Hooker Lake. Eugenie Stream crosses an alluvial fan and enters the lake in the bottom left of the photograph. (c) Looking northeast up Tasman Lake to Tasman Glacier (November 2009).
Mueller Glacier
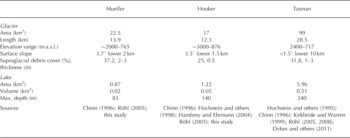
The terminus of Mueller Glacier has been downwasting at a rate of ~0.5 m a-1 since the early 1900s (Reference WatsonWatson, 1995). The glacier is 13.9 km long and descends from ~2000 to 765 m a.s.l. (Table 1). A series of melt ponds formed on the terminus in the early 1980s and coalesced in the early 1990s to form what is now Mueller Lake, with subaerial calving commencing just prior to 1994 (Reference WatsonWatson, 1995). In 2010, the lake had a surface area of 0.87 km2 and a maximum depth of 83 m (Table 1). Since 1994, lake area has increased by 141% while lake volume has increased by 842%. Reference RöhlRöhl (2005) estimated that the amount of retreat varied between 0 and 210m between April 2000 and February 2003 at different points along the terminus. The actively calving section of the terminus retreated 150 m between November 2009 and February 2011.
Table 1. Physical characteristics of Mueller, Hooker and Tasman glaciers and their proglacial lakes. Supraglacial debris cover refers to the percentage of the glacier surface area that is covered by debris
Hooker Glacier
Hooker Glacier is the fourth largest glacier in the National Park, with an area of 17 km2 (Table 1). Between 1915 and 1986 the glacier downwasted along the centre flowline at rates of up to 1 ma-1, with downwasting progressing at ~0.3 m a-1 on the lower 3 km between 1986 and 1996 (Reference Hochstein, Watson, Malengrenau, Nobes and OwensHochstein and others, 1998). By 1994 subaerial calving was active (Reference Hochstein, Watson, Malengrenau, Nobes and OwensHochstein and others, 1998; Reference Warren and KirkbrideWarren and Kirkbride, 1998), and Reference KirkbrideKirkbride (1993) theorized that the development of an unconfined aquifer on the lower terminus, in conjunction with thinning, increased the buoyancy of blocks of ice along the glacier margins. This induced fracturing, enhancing melting by allowing further water infiltration, resulting in the development of large meltwater channels (Reference KirkbrideKirkbride, 1993). These channels coalesced to form a proglacial lake, which effectively ‘drowned’ the terminus (Reference KirkbrideKirkbride, 1993). Retreat rates actually decreased between the early 1980s and 1996 from 70 to 30 m a-1 (Reference Hochstein, Watson, Malengrenau, Nobes and OwensHochstein and others, 1998; Reference Warren and KirkbrideWarren and Kirkbride, 1998) but then increased between 2001 and 2003 with rates of 79 m a-1 reported (Reference RöhlRöhl, 2006). In 2009 the lake had a surface area of 1.22 km2 and a maximum depth of 135 m. Published subaqueous terminal morphology data are limited to bathymetric maps created in 1995 (Reference Warren and KirkbrideWarren and Kirkbride, 1998), 1996 (Reference Hochstein, Watson, Malengrenau, Nobes and OwensHochstein and others, 1998) and 2002 (Reference RöhlRöhl, 2005). From these bathymetry and lake growth data, Reference Hochstein, Watson, Malengrenau, Nobes and OwensHochstein and others (1998) were able to approximate a subaqueous ‘downmelting rate’, based on the vertical lowering of an area of lake floor, of ~5ma_1 between 1982 and 1986 and ~9ma-1 between 1986 and 1996. Mass loss due to melt and calving were undifferentiated in their approximation.
Tasman Glacier
Tasman Glacier is the longest glacier in New Zealand, at 28.5 km. Downwasting at a rate of 1.2 m a-1 resulted in ~1.4 km of retreat from the terminal moraine between 1972 and 1982 (Reference Hochstein, Claridge, Henrys, Pyne, Nobes and LearyHochstein and others, 1995). This is less than the downwasting rate of 1.9–4.2 ma-1 reported between 1986 and 2007 by Reference Quincey and GlasserQuincey and Glasser (2009). Proglacial Tasman Lake formed by the coalescence of thermokarst ponds, which appeared on the glacier surface in the late 1950s (Reference KirkbrideKirkbride, 1993; Reference Kirkbride and WarrenKirkbride and Warren, 1999; Reference RöhlRöhl, 2008). The small thermokarst ponds had developed from the collapse of englacial channels (resulting from downwasting) and consequential melting of exposed ice. Retreat rates have varied from 41 m a-1 during 1994–95 (Reference Purdie and FitzharrisPurdie and Fitzharris, 1999), 22 m a-1 during 2001–03 (Reference RöhlRöhl, 2006), 54 m a-1 during 2006 and 144m a-1 during 2006–08 (Reference Dykes, Brook and WinklerDykes and others, 2010). This recession meant that by 2008 the lake had enlarged to a surface area of 5.96 km2 (Table 1). Reference Hochstein, Watson, Malengrenau, Nobes and OwensHochstein and others (1998) estimated a mean subaqueous melt rate, based on the vertical lowering of an area of lake floor, of 8 m a-1 for the period 1982–93.
Subaqueous calving
Although quantifying subaqueous calving rates for these glaciers was not possible in the present study due to our inability to measure all calving events, observations and unpublished reports (personal communication from C. Hobbs, 2010) point to a higher subaqueous calving rate on Tasman Glacier than on Mueller and Hooker Glaciers. Local tourist operators on Tasman Lake often report observing subaqueous calving events which produce icebergs that are usually very large (tens to hundreds of metres across) and white to blue in colour. Reference RöhlRöhl (2005) also reported witnessing subaqueous calving events in Tasman Lake. These events produced the largest icebergs present in the lake: larger than those from subaerial events. Subaqueous calving is thought to occur from a submerged ice ramp and is sometimes preceded by subaerial calving. Subaqueous calving events have also been observed on Mueller (Reference RöhlRöhl, 2005; personal communication from C. Hobbs, 2010) and Hooker Glaciers (Reference Hochstein, Watson, Malengrenau, Nobes and OwensHochstein and others, 1998; Reference Warren and KirkbrideWarren and Kirkbride, 1998). In particular, Reference RöhlRöhl (2005) observed a large subaqueous calving event at Mueller Glacier in February 2005. The calving occurred over 3 min and was captured in a series of photographs that shows a group of large subaqueous icebergs rising out of the lake and rolling. The frequency of these sightings at Mueller and Hooker Lakes is lower than at Tasman Lake, but whether this is due to higher visitor numbers at Tasman Lake or more subaqueous calving events at Tasman Glacier is unknown.
The climate in the National Park is dominated by westerly airflow from the Tasman Sea. The Southern Alps enhance orographic precipitation (Reference Cox and BarrellCox and Barrell, 2007), resulting in high precipitation to the west of the Main Divide (up to 12 000 mm at Remarkable Peak; Reference Griffiths and McSaveneyGriffiths and McSaveney, 1983), decreasing eastward. Precipitation in higher-elevation areas is ~7000 mm a-1, decreasing to 3000–5000 mm a-1 at Mount Cook Village (Reference AndertonAnderton, 1975; Reference RöhlRöhl, 2006).
Methods
The morphology of the subaqueous calving margins of Mueller, Hooker and Tasman glaciers was surveyed using a CHIRP sub-bottom profiler and echo sounder. Subaqueous morphology and bathymetry data were obtained from both Mueller and Hooker Lakes in November 2009, with Mueller Lake resurveyed in April 2010. Tasman Lake was surveyed in April and October 2008.
High-resolution CHIRP seismic data of the subaqueous morphology in the three lakes were collected with an EdgeTech 216S sub-bottom profiler. The profiler operates by remotely determining the acoustic attenuation of lake sediments by transmitting an FM pulse (also known as CHIRP or Klauder wavelets) linearly over an area (Reference Schock, LeBlanc and MayerSchock and others, 1989; EdgeTech, 2005). The sonar works on a frequency range of 2–16 kHz and gives a vertical resolution of 6–10cm (EdgeTech, 2005). Data were collected over intersecting transects ~100m apart throughout the lakes, with particular focus on the lake floor within 750m of the termini. Data sampling was limited to calm lake conditions as rough water causes interference with the sub-bottom signal (Reference Pantin and WrightPantin and Wright, 1994; Black Laser Learning, 2006; Reference Duck and HerbertDuck and Herbert, 2006). The quality of the recorded data was high, so post-processing could be limited to video gain (dB) and time-varied gain (TVG; dB(100m)-1) alteration on individual profiles in EdgeTech Discover software. The displayed vertical scales on the sub-bottom profiles are based on an assumed sound-wave velocity of 1500 ms-1 (Reference Mullins and HalfmanMullins and Halfman, 2001; Reference Lafferty, Quinn and BreenLafferty and others, 2006). Individual acoustic units were identified and described according to accepted concepts in seismic stratigraphy (e.g. Reference Lafferty, Quinn and BreenLafferty and others, 2006). Mueller Lake and Hooker Lake surveys were located using handheld GPS with an accuracy of ±5 m (Garmin Ltd, 2007), while a Trimble real-time kinematic differential GPS (RTK-dGPS) was utilized in Tasman Lake giving horizontal (x, y) and vertical (z) precision of ±60mm. The sub-bottom profiler was unable to clearly detect the boundary between the base of the ice ramp and the lake bed. Data were interpolated using triangular irregular network (TIN) modelling from which smoothed bathymetric contours were produced in ArcMap.
Results
Mueller Glacier and Lake
In April 2010, Mueller Lake had a surface area of 0.87 km2 and a volume of 0.02 km3. The morphology of the subaqueous calving margin in November 2009 and April 2010 is shown in Figure 3. The lake floor sloped an average of ~18° away from the glacier in the northwest to the deepest point of the lake (83 m) ~600m from the terminus, while lake depth in the southwest was considerably shallower (Fig. 3). Sub-bottom data (not shown) reveal a large fine-grained sediment-filled basin in the southwest and an ice ramp underlying a thick cover of sediment (~5–10 m) on the sloping lake floor in the northwest (Fig. 4). The basin increased in depth by up to 25 m (Fig. 3) between November and April. In November 2009 this ice ramp extended ~325 m (±3 m) from the northwest terminus into the lake and had a surface area of ~0.16km2. Subaerial calving on the northwest of the terminus during the 2009/10 summer increased the length of the ramp to ~370 m and the area to 0.23km2. The longest section of the ice ramp in April 2010 was 510 m (±3 m). The ice ramp contains a large number of debris bands similar to those observed in the exposed terminal ice cliff in the northwest and to those seen in Figure 2. The surface of the sediment on the ramp is undulating and pockmarked with small depressions. Approximately 60m of the distal end of the ramp that was identified in November 2009 was not detected in April 2010, possibly due to subaqueous calving.
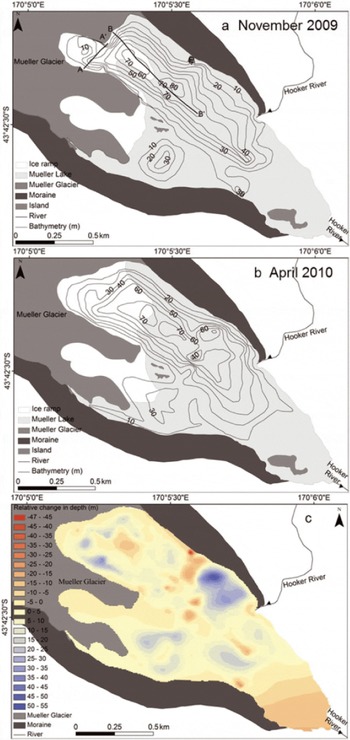
Fig. 3. Subaqueous terminal morphology and bathymetry of Mueller Lake: (a) November 2009, where lines A-A′ and B-B′ show the location of sub-bottom profile images in Figure 4; (b) April 2010; (c) the relative change in lake depth between (a) and (b). Negative values (red) show a decrease in depth, and positive values (blue) show an increase in depth.
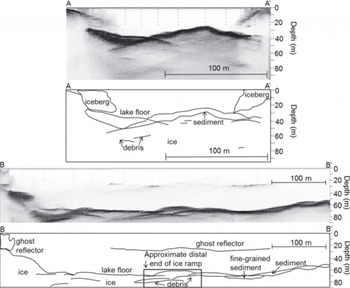
Fig. 4. Sub-bottom profile images and interpretation from Mueller Lake in April 2010. Profile locations are shown in Figure 3. The box shows the approximate distal end of the ice ramp.
Hooker Glacier and Lake
The bathymetry and morphology of the Hooker Glacier calving margin and lake are shown in Figure 5. In 2009 the lake had a surface area of 1.22 km2, filling a steep-sided U-shaped glacial valley which shallows towards its outlet, Hooker River. From the deepest point in the lake (140 m, 390 m in front of the terminus) the lake floor shallows rapidly towards the terminus at an angle of ~20°. On either side of this deep basin, within 150m of the terminus, the lake floor slopes at ~30° towards the terminus. Towards the centre of the lake, the lake floor is relatively flat with a change in elevation of 20 m over 270 m. Sub-bottom data along the terminus show ice, covered with a thick layer of sediment (>10 m), extending 320 m into the lake, with a surface area of ~0.13km2 (Fig. 5). Within 25 m of the terminal ice cliff the surface of the ice ramp is uniform and relatively smooth, beyond which the surface is undulating. The ice ramp abuts the lateral moraine on both sides of the glacier, and material displaced from subaerial sections of these moraines mantles the edges of the ramp. Debris bands can also been seen in the ice (Fig. 5).
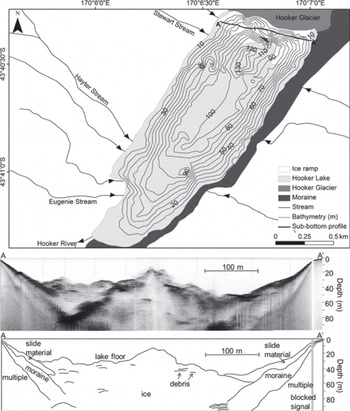
Fig. 5. Subaqueous terminus morphology and bathymetry of Hooker Lake in November 2009. Line A-A’ shows the location of the sub-bottom profile image.
Tasman Glacier and Lake
Bathymetric data, described by Reference Dykes, Brook, Robertson and FullerDykes and others (2011), were collected at the same time as the sub-bottom data contained herein. The sub-bottom data show ice overlain by a layer of sediment (5–10 m) (Fig. 6) sloping away from the terminus into the lake for ~400m. The surface area of this ice ramp is ~0.49km2. The surface of the ramp adjacent to the subaerial section of the terminus is pockmarked with small depressions (<10 m) and ridges, but these become less pronounced as the ramp extends further into the lake. Additional sub-bottom data (not shown in Fig. 6) show that the ice extends along the full face of the glacier and abuts the lateral moraines on both sides of the lake.
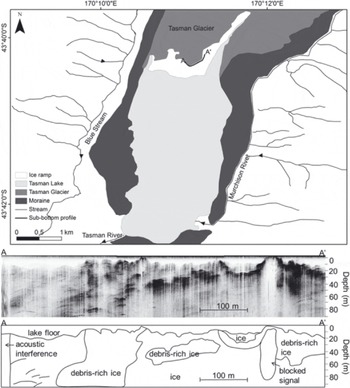
Fig. 6. Subaqueous terminus morphology of Tasman Lake in 2008. Line A–A’ shows the location of the sub-bottom profile image. See Reference Dykes, Brook, Robertson and FullerDykes and others (2011) for detailed bathymetry data collected at the same time as the sub-bottom profile data contained here.
Discussion
Sub-bottom profile data from Mueller, Hooker and Tasman lakes show ice ramps extending from the calving termini of the three glaciers into their proglacial lakes. At 510m, the ice ramp extending from Mueller Glacier is the longest of the three, as well as the largest in terms of the percentage of lake length (20%) and glacier length (2.6%). There are no previous recorded observations of an ice ramp in the lake although, based on glacier thickness estimates of Reference WatsonWatson (1995), Reference RöhlRöhl (2005) suggested that the lake floor was likely to be ice-cored in 2003. Hence, the ice ramp mapped in 2009 and 2010 is likely part of what formed the 2003 ice-cored floor. A comparison of lake depths between 2005 and 2009 (not shown) indicates that the ice ramp has disintegrated in the southeast part of the lake, probably via subaqueous calving (which commenced in 2005; Reference RöhlRöhl, 2005), and now extends further up-valley to the northwest due to continued subaerial calving retreat. Subaqueous calving is also likely to have removed 60 m on the distal end of the ice ramp that was detected in 2009 but not in 2010.
A small ice ramp has been recorded in Hooker Lake on two previous occasions. Reference Hochstein, Watson, Malengrenau, Nobes and OwensHochstein and others (1998, p. 213) found a ‘small, protruding, basal ice tongue’ extending from the bottom of the ice cliffs on the terminus of Hooker Glacier in 1996, as well as remnant ice along the margins of the lake. Reference Warren and KirkbrideWarren and Kirkbride (1998) also reported a small projecting ice ramp just below the waterline which sloped at a gradient of 20–30° into the lake. The gradient is comparable with that measured in 2009 with steepening of up to 10° occurring on the southeast section. In contrast to these observations, Reference RöhlRöhl (2005) believed the subaqueous ice margin in Hooker Lake to be vertical or near-vertical between 2001 and 2003. There are two possible explanations for this variation: (1) the ice ramp observed prior to 2001 completely disintegrated via subaqueous calving and melting, creating a near-vertical ice margin; or (2) the ice ramp was simply not detected. Given that the ice ramp reported by Reference Warren and KirkbrideWarren and Kirkbride (1998) extended ~100m from the terminus and the closest data point Reference RöhlRöhl (2005) collected was 100m from the subaerial terminus, it would appear that the survey design of Reference RöhlRöhl (2005) precluded detection of an ice ramp between 2001 and 2003.
Disparities also exist among the datasets from Tasman Glacier. Indeed, Reference Hochstein, Claridge, Henrys, Pyne, Nobes and LearyHochstein and others (1995) concluded that the subaqueous ice cliff was near vertical in at least one location along the terminus in 1993. In contrast, Reference PurdiePurdie (1996) and Reference RöhlRöhl (2005) reported that an ice ramp extended along the majority of the terminus, except for a small section at the eastern end. Reference Warren and KirkbrideWarren and Kirkbride (1998) also observed an ice ramp at the waterline, which was present along the full width of the terminus. After 1993, all surveys in the lake have suggested that an ice ramp extended from the glacier, albeit in varying locations. As illustrated by these fluctuations in ramp size and location, it is likely that the ice ramp has evolved in a cyclic pattern of growth and disintegration, in connection with subaerial retreat of the glacier (e.g. Reference RöhlRöhl, 2005).
Ice ramps have been observed in the past at other glaciers in New Zealand, including Maud, Grey, Godley and Ivory glaciers (Reference Warren and KirkbrideWarren and Kirkbride, 1998), and worldwide, including Le Conte Glacier, southeast Alaska (Reference Motyka and Van der VeenMotyka, 1997), the margin of Breiðamerkurjökull terminating into Stemmárlón, southeast Iceland (Reference Howarth and PriceHowarth and Price, 1969), and Muir and Johns Hopkins Glaciers, Alaska (Reference Hunter and PowellHunter and Powell, 1998). To understand the morphology and development of the subaqueous margins of Mueller, Hooker and Tasman glaciers, possible relationships between calving processes, retreat rate and debris cover are explored further below.
Calving and retreat rate
A cyclic calving pattern is common at water-terminating ice margins in Aoraki/Mount Cook National Park (Reference Kirkbride and WarrenKirkbride and Warren, 1997, 1999), the Himalaya (Reference Benn, Wiseman and HandsBenn and others, 2001) and Patagonia (Reference WarrenWarren, 1999; Reference Haresign, Warren, Harris and MurtonHaresign and Warren, 2005). This cycle involves melting at the waterline, which creates an overhanging subaerial cliff. The cliff calves progressively larger lamellae by flaking and eventually full-height slab calving. As the destabilized subaerial ice cliff retreats, a subaqueous ice ramp will develop if mass losses per unit area above the waterline exceed those below. Eventually, the ice ramp will calve or melt away. The rate of ramp development is controlled by the difference between the rate of subaerial cliff retreat (by calving and melting) and subaqueous ramp retreat (by calving and melting). Therefore, a glacier with a high subaerial retreat rate will not necessarily have a large ice ramp. For example, Tasman Glacier has a higher subaerial retreat rate than Mueller Glacier (Reference RöhlRöhl, 2006; Reference Dykes, Brook and WinklerDykes and others, 2010), yet the ice ramp extending from Tasman Glacier is smaller than that extending from Mueller Glacier. This is a consequence of higher relative subaqueous mass loss rates at Tasman Glacier. Subaerial retreat rates may be higher at Tasman Glacier than Mueller Glacier due to variations in the rate of thermal undercutting as a result of differences in water temperature, water-level fluctuations and terminal ice cliff geometry (e.g. Reference RöhlRöhl, 2006). In addition to the control that subaerial and subaqueous retreat rates exert on ramp development, other factors must control the maximum extent of the ice ramp a given glacier can sustain. Potential controls may include debris cover and resultant buoyancy, properties of the water body (e.g. water temperature) into which the glacier terminates. In addition, where subaqueous calving is an important process, longitudinal strain rates are also a potential control as these rates influence fracture formation and propagation (Reference Benn, Warren and MottramBenn and others, 2007), along with pre-existing weaknesses such as crevasses and debris bands.
Subaerial calving at the three glaciers is predominantly driven by undercutting of the ice cliff, which is controlled by waterline melt. Reference RöhlRöhl (2005, Reference Röhl2006) identified lake level stability as a crucial component in waterline melting. Constant lake levels concentrate energy transfer and thus melting to be concentrated on a thin section of ice at the waterline rather than spreading it over a wider vertical area. This energy concentration creates deeper thermal-erosional notching rates, leading to high subaerial calving rates. Fluctuations in lake level of more than 0.15 m over 24 hours were enough to significantly retard the development of thermal notches on Tasman Glacier (Reference RöhlRöhl, 2005).
Debris on the ice ramps
Sub-bottom data from Mueller, Hooker and Tasman lakes show that debris thicknesses on the ice ramps vary between 5 and 10 m. This sediment comprises unsorted sands, gravels and boulders. Isolated areas of undisturbed laminated lacustrine muds that fill small basins and depressions are also present in all three lakes. These areas are generally distal from the terminus, where subdued sediment and water movement allow fine sediment to settle out of suspension. Mueller Lake is an exception, with fine sediment infilling a large flat-bottomed basin in the southwest part of the lake adjacent to the terminus. This delta was created by a supraglacial river that flowed into the area until 2006.
Sediment on the subaqueous ice ramps is derived from five potential sources: (1) transfer of supraglacial debris off the glacier terminus; (2) slumping from lateral moraines bordering the lake margins; (3) iceberg fallout; (4) melting of the ramp; and (5) fluvial deltaic deposition. Sources 1–4 are present at all three glaciers, with fluvial deposition forming a delta on the ramp only at Mueller Glacier where a supraglacial river flows from the glacier surface into the lake.
Debris on subaerial ice can either retard or enhance melting depending on its thickness. Where debris is thicker than 30 mm it insulates the ice and impedes melting (Reference ØstremØstrem, 1959; Reference Mattson, Gardner and YoungMattson and others, 1993; Reference Hambrey, Quincey, Glasser, Reynolds, Richardson and ClemmensHambrey and others, 2008). On Tasman Glacier, Reference Purdie and FitzharrisPurdie and Fitzharris (1999) found a layer of supraglacial debris up to 3 m thick, which reduced ablation by 93%. Debris cover on subaqueous ice will also act in an insulating capacity, reducing the effectiveness of downward advection of water warmed at the lake surface. Reference RöhlRöhl (2005) reported that melting of subaqueous ice under debris was minimal in Tasman Lake. With water temperatures of 1.5°C, ice overlain with 2 m of debris melted at a rate of 0.02–0.14 m a-1. Debris cover on the subaqueous ice ramps in Mueller, Hooker and Tasman lakes is considerably thicker. The thick layer of sediment covering the ramps greatly reduces melting, minimizing thinning of the ice, and also adds mass to the ice ramp, reducing the buoyant forces that act to break up the ramp (Reference Hunter and PowellHunter and Powell, 1998). Indeed, owing to this added mass on the subaqueous ramp surface acting against buoyancy, it is likely that the ice ramp is maintained rather than undergoing disintegrations via subaqueous calving. Debris bands, observed in the CHIRP data, in Hooker and Tasman ramps are more clearly defined than those in the Mueller ramp. This may be because the debris is more evenly distributed within the Mueller ramp due to processes of entrainment and transport in the glacier and/or because of differences in debris composition, which may result in a weaker reflective signal. Debris bands within all three ramps are very similar in appearance to debris seen in the exposed ice cliffs at the termini of the glaciers and in icebergs in the lakes.
Debris content and distribution may be important in ice ramp evolution in some instances. Reference Hunter and PowellHunter and Powell (1998), working at Muir Glacier, Alaska, suggested that the top of an ice ramp is more likely to develop at the boundary between sediment-rich stratified basal ice and overlying bubbly white ice. They found that subaqueous-sourced icebergs contained a debris-rich ice layer that graded upward into relatively clean ice. People who have observed subaqueous calving events from ice ramps in Mueller, Hooker and Tasman lakes (Reference RöhlRöhl, 2005; personal communication from C. Hobbs, 2010) report that the icebergs commonly consist of bubbly white ice containing debris bands and do not grade from debris-rich ice to clean ice. Thus, Reference Hunter and PowellHunter and Powell’s (1998) theory does not appear to be relevant in our case.
Conclusion
Periods of constant water level and warm surface water temperatures adjacent to the ice cliffs allow thermo-erosional notches to develop vigorously. These notches destabilize the subaerial ice cliffs above. Thus, subaerial calving proceeds faster than subaqueous mass loss, resulting in the formation of ice ramps. The rate of ice ramp development is controlled by the difference between subaerial retreat and subaqueous mass loss (by calving and melting). The ‘steady-state’ situation would be one in which subaerial retreat was matched by retreat of the subaqueous ice ramp.
The subaqueous terminal morphologies of Mueller, Hooker and Tasman glaciers show ice ramps extending up to 510 m from the calving termini into their respective proglacial lakes, with the ice ramp extending from Mueller Glacier being the largest. The surfaces of these ice ramps are undulating and covered with a thick layer of unsorted sediment derived from supraglacial and englacial debris, lateral moraines and fluvial deltaic deposition. As with supraglacial debris on subaerial ice, sediment on the ice ramps reduces melting and therefore thinning of the ramps. The ice ramps are therefore able to remain intact hundreds of metres in front of the calving termini.
Ice ramps appear to be transient features of glacier margins terminating in fresh water. They evolve over time as variables, including glacier dynamics and water-body properties, change. It therefore cannot be assumed that if an ice ramp does not exist at a particular time, the glacier is unable to support such a feature. Owing to the highly changeable nature of ice ramps it is important to improve our understanding of the controls on glacier termini undergoing subaqueous calving in order to fully understand the potential contribution subaqueous calving may make to glacier mass loss.
Acknowledgements
This work was funded by the Ryoichi Sasakawa Young Leaders Fellowship Fund (to C.M.R.), with fieldwork at Tasman Glacier supported by the Massey University Research Fund (to M.S.B.). We thank the Department of Conservation, New Zealand, for allowing fieldwork in Aoraki/Mount Cook National Park, Charlie Hobbs and the New Zealand Alpine Club. Field assistance from John Appleby, Rob Dykes and David Feek was also greatly appreciated. Critical reviews by Roger LeB. Hooke and Robert McNabb significantly improved the manuscript and were greatly appreciated.


