


The Editor, Journal of Glaciology
Sir,
That Wisconsin-aged ice is mechanically softer than Holocene ice, at least in the Northern Hemisphere, is widely recognized. This characteristic was apparently first observed in bore-hole deformation experiments on Barnes Ice Cap, Baffin Island, Canada (Reference HookeHooke, 1973). At comparable stresses, shear-deformation rates in a layer of bubbly white ice at the base of Barnes Ice Cap were found to be ˜2.5 times faster than in overlying blue ice. Subsequently, stable-isotope data demonstrated that the Pleistocene-Holocene transition lay at the boundary between the white and blue ice (Reference HookeHooke, 1976; Reference Hooke and ClausenHooke and Clausen, 1982). Additional bore-hole deformation studies in the late 1970s and early 1980s confirmed this rheological contrast, and suggested that the white ice might deform as much as 25 times faster than the blue ice (Reference Hooke and HansonHooke and Hanson, 1986). During this same time period, bore-hole deformation experiments on Devon Ice Cap (Reference PatersonPaterson, 1977, p. 53–54), on Aggasiz Ice Cap (Reference Fisher and KoernerFisher and Koerner, 1986), and at Dye 3 in south Greenland (Reference Jensen and GundestrupDahl-Jensen and Gundestrup, 1987) documented a similar softness of Pleistocene ice.
Because the white ice on Barnes Ice Cap was exceptionally bubbly, particularly in comparison with the overlying blue ice, its softness was originally attributed to the high bubble content (Reference HookeHooke, 1973, p. 432–33). The contrast in bubble content was sufficient to produce a density difference of 0.05 Mg/m3 which, based on extrapolation of creep data from snow and low-density ice (Reference Mellor, Smith and ŌuraMellor and Smith, 1967, fig. 4), seemed to be quantitatively sufficient to explain the contrast in rheology. Thus, although Reference PatersonPaterson (1977, p. 54) drew an analogy between the softness of the Pleistocene ice in Devon and Barnes Ice Caps, Reference HookeHooke (1981, p. 670) argued that different processes must be involved, as no corresponding bubble or density contrast was found in the Devon Island ice core.
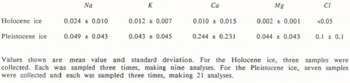
Table I. Summary of chemical analyses of barnes ice cap ice, ppm (analyses by r.a. souchez in 1973 and 1974)
Recent experimental results obtained by Gao and Jacka (in press) now suggest that Hooke’s interpretation was wrong. Using tests in unconfined uniaxial compression, Gao and Jacka found that there was no significant change in minimum strain-rate over a density range from 0.83 to 0.91 Mg/m3 (Fig. 1). This suggests that the rheological contrast between Pleistocene and Holocene ice in Barnes Ice Cap should be attributed to factors other than the density contrast. In particular, the cause of this rheological contrast in Barnes Ice Cap may be the same as the cause in the Devon and Aggasiz Ice Caps and Greenland ice sheet. If future laboratory tests in simple shear, preferably extending to tertiary creep, should fail to show a contrast in rheology over the density range mentioned, this interpretation would be strengthened.
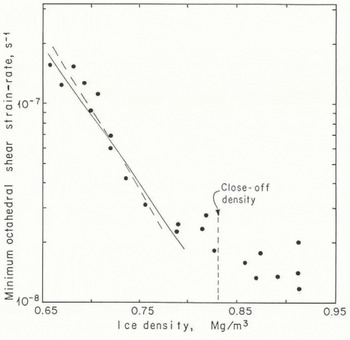
Fig. 1. Variation in minimum octahedral shear strain-rate with initial ice density (modified from Gao and Jacka (in press)). Slopes of solid and dashed lines are based on tests of Mellor and Smith (1966) and Reference Haefeli and SuryHaefeli and von Sury (1975), respectively.
It is worth noting, however, that the change in fabric and crystal size across the Pleistocene-Holocene boundary is quite dramatic in Barnes Ice Cap (Reference Hooke and HudlestonHooke and Hudleston, 1980), and this is undoubtedly partially responsible for the rheological contrast. On the other hand, it is also worth noting that there is a chemical contrast between the Pleistocene and Holocene ice in Barnes Ice Cap similar to that found elsewhere at the Pleistocene-Holocene transition (Table I). These factors need to be taken into consideration in our attempts to explain this puzzling rheological contrast.
Roger Leb. Hooke
Department of Geology and Geophysics, University of Minnesota, Minneapolis, Minnesota 55455. U.S.A.
X.Q. Gao
Meteorology Department, University of Melbourne, Parkville, Victoria 3052, Australia
Т.Н. Jacka
Australian Antarctic Division. Kingston, Tasmania 7050. Australia
R.A. Souchez
Université Libre de Bruxelles. Laboratoire de Géomorphologie,Avenue F.D. Roosevelt 50,В-1050 Brussels, Belgium
18 May 1988


