


Confucian philosophy has been very influential in shaping Chinese families. One of the core Confucian concepts of Chinese family systems is filial piety (xiao; Chao, Reference Chao1994). It refers to the way children react to and treat their parents, as well as an emphasis on respect and care for elders (Yeh & Bedford, Reference Yeh and Bedford2003). The main behavioral doctrine of every Chinese family is to respect and live with parents, and promote the family customs of parents and ancestors.
Malaysia is a multicultural nation comprised of Malays (68.8%), Chinese (23.2%), Indians (7.0%) and the indigenous community (1.0%), with various cultures and upbringing practices (Department of Statistics Malaysia, 2017). As a multi-racial country, Malaysians have a collectivist approach (Keshavarz & Baharudin, Reference Keshavarz and Baharudin2009) in their adoption of the cultures and practices of other ethnic groups. Although filial piety is mainly practiced by the Chinese, studies have also found that filial piety has been disseminated and widely practiced by other ethnic and cultural groups due to its good value (Nainee, Tan, & Tan, Reference Nainee, Tan and Tan2016). For instance, in their study on the relationship between filial piety and psychosocial adjustments among Malay families, Ismail, Tan, and Ibrahim (Reference Ismail, Tan and Ibrahim2009) found that children and adolescents who practice filial piety were less likely to encounter psychological difficulties, conduct problems, hyperactivity, and emotional symptoms.
Similar to other areas of psychological study, how it is measured plays an important role in the research on filial piety. Yeh and Bedford (Reference Yeh and Bedford2003) developed a 16-item Filial Piety Scale (FPS) that taps into the two dimensions of filial piety, namely reciprocal and authoritarian filial piety. The FPS, however, is only available in English or Chinese. Thus, the present study aimed to develop the FPS Malay version (FPS-M) specifically to facilitate filial piety research among adolescents in Malaysia.
In the next section, we first review the concept of filial piety, followed by a discussion on the development and application of the FPS. Finally, we explain the analytical approach used in the current study to examine psychometric properties of the FPS-M.
Filial piety
Filial piety refers to “the important virtue and responsibility for the children to respect, care for, and bring honor to their families” (W.W. Chen, Reference Chen2014, p. 308). Filial piety not only explains family functions as supportive social units from which its members draw on each other’s resources to meet their psychological, social and physical needs (Chow, Reference Chow, Chi, Chappel and Lubben2001; Hsu, Lew-Ting, & Wu, Reference Hsu, Lew-Ting and Wu2001), but also outlines children’s devotion to their seniors and family traditions. The core idea of filial piety is that as a child, he or she is indebted to provide support to their older family members.
According to the dual model of filial piety, it can be deemed as a dual construct element that comprises reciprocal filial piety and authoritarian filial piety. Reciprocal filial piety describes the close tie of parents and their children, and the love and gratitude of children for parents’ efforts in nurturing them. On the other hand, authoritarian filial piety describes the good rapport sustained by children with the elders in order to conform to society or to avoid social pressures (Yeh & Bedford, Reference Yeh and Bedford2004).
Thus, filial piety has been found to have beneficial effects on children’s and adolescents’ development. For example, filial piety may reduce parent-child conflict (Yeh & Bedford, Reference Yeh and Bedford2004). Leung, Wong, Wong, and McBride-Chang (Reference Leung, Wong, Wong and McBride-Chang2010) found that after statistically controlling for grade, age and perceived parental warmth, reciprocal filial piety was positively associated with life satisfaction and social competence of the children, while authoritarian filial piety was negatively associated with self-esteem and social competence.
Measures of filial piety
Several measures have been employed in past studies to evaluate filial piety. These instruments have been targeted at different aspects related to filial piety. For instance, Ho (Reference Ho1994) developed the Filial Piety Scale, which aimed to assess individuals’ attitudes toward some aspects of Confucian filial piety, materially or spiritually. It contains the crucial facets of filial piety such as obedience, respect, worship of ancestors, providing for one’s aged parents, and ensuring the continuity of the family line. This scale was administered in a sample of secondary school students and university students from Hong Kong and Taiwan. However, although the scale focuses on attitudes toward filial piety, it overlooked the actual filial behaviors of individuals, or the aspect of love and gratitude that benefits adolescents’ adaptation.
Gallois and colleagues (Reference Gallois, Giles, Ota, Pierson, Ng, Lim, Maher, Somera, Ryan, Harwood, Lasry, Adair and Dion1999) developed a filial piety questionnaire comprised of six target components, namely intention to engage, peer norms, behavioral norms, expectations by elderly people, personal norms, and parents’ expectations regarding filial behavior. Gallois and colleagues’ concept of filial piety emphasizes the cognitive aspect, whereby most of the components are related to subjective norms. The questionnaire, however, paid little attention to the underlying motives or reasons for filial behaviors. Moreover, the scale focuses more on an authoritarian viewpoint and neglects the harmonious interaction between the two generations.
To address the limitations of the above-mentioned scales and to resolve the helpful-harmful debate of filial piety on adolescents’ adaptations by maintaining that the modern concept of filial piety can be better understood, Yeh and Bedford (Reference Yeh and Bedford2003) developed the Dual Model of Filial Piety and its corresponding Filial Piety Scale (FPS) to test the model. The FPS includes both the traditional prominence of authority and obedience, as well as the emphasis of emotional components of affection, harmony, and respect. It has been used in several studies to examine the level of filial values one possesses, which can be used to identify the underlying reason of one’s filial behavior. The FPS consists of 16 items loaded on two subscales to measure reciprocal and authoritarian filial piety respectively. Nine of the items were derived from the short-form Filial Piety Scale (Yeh, Reference Yeh, Cheng, Lu and Wang1997), while the remaining seven items were adapted from Yang, Yeh, and Huang’s (Reference Yang, Yeh and Huang1989) FPS. Overall, the FPS was found to have a good model fit in a sample of Taiwanese college students and senior high school students (Yeh, Liu, Huang, & Yang, Reference Yeh, Liu, Huang, Yang, Liu, Ward, Bernardo, Karasawa and Fischer2007), as well as in a sample of adults in Taiwan and Hong Kong (Yeh, Yi, Tsao, & Wan, Reference Yeh, Yi, Tsao and Wan2013).
The present study
The main goal of this study is to develop the Malay version of FPS. It is important to note that the theoretical concepts of the FPS may not hold after translation. Hence, the second goal of the study is to examine psychometric qualities of the FPS Malay version (FPS-M) in a sample of adolescents to ensure that the scale is useful for assessing filial piety in the Malaysian context.
Traditional confirmatory factor analysis (CFA) and exploratory structural equation modeling (ESEM) were employed to assess the factor structure of the FPS-M. The ESEM integrates the characteristics of exploratory and CFA. In contrast to the standard CFA in which indicators are only allowed to load onto a target latent factor (i.e, zero cross-loading), the ESEM allows all factor loadings to be estimated (i.e., non-zero cross-loadings) to help identify the best fit model (Wiesner & Schanding, Reference Wiesner and Schanding2013). Moreover, ESEM has the advantage of assessing various constraints necessary for model identification and rotation of factor loading matrices.
In addition to testing factor structure, an omega coefficient was employed to examine internal consistency of the FPS-M while the validity of the FPS-M was examined by testing the association between the FPS and self-reported life satisfaction. Finally, we examined measurement invariance to understand whether the FPS-M is perceived equally among genders and ethnicity groups. The results are expected to shed light on the usability of the FPS-M.
Method
Participants and procedure
A total of 621 secondary school students (323 females) were recruited from three states (Negeri Sembilan, Selangor, and Penang) located at Peninsular, Malaysia. Their mean age was 15.08 (SD = 1.03), ranging from 13 to 17 years old, with three participants not reporting their age. Of the sample, 46.70% were Malays, followed by Chinese (27.90%), Indians (23.50%), and other ethnicity groups (e.g., Dusun, Iban, 1.9%). There were 49.30% Muslims, 22.60% Buddhists, 18.10% Hindus, 8.70% Christians, and 1.30% people of other religions.
Approvals were obtained from the Ministry of Education, Malaysia, and the Department of Education for the three states as well as the schools’ principals prior to the data collection. In addition, parental consent forms were distributed to students and collected before the actual data collection. Adolescents were also asked to sign consent forms during the data collection. Respondents each received a token of appreciation once they completed and returned their questionnaires. This procedure was reviewed and approved by the university’s Scientific and Ethical Review Committee.
Translation procedure
Back-to-back translation procedure was utilized to develop the Malay version of the FPS. Specifically, the original English version was first translated into Malay by a bilingual psychology lecturer. Next, the translated Malay version was then back-translated into English without referring to the original English version by another bilingual language expert. Then, both original and translated versions of FPS were compared to ensure that the items were consistent and their meanings were not distorted.
Measure
The FPS-M (Yeh & Bedford, Reference Yeh and Bedford2003) was used to measure adolescents’ filial piety attitude. This scale consists of 16 items with two subscales: reciprocal and authoritarian filial piety. Participants were required to rate on a 6-point Likert scale, ranging from 1 (strongly disagree) to 6 (strongly agree). The total score was computed with a high score indicating high filial attitude towards parents or the elderlies.
The Malay version of the Satisfaction With Life Scale (SWLS; Diener, Emmons, Larsen, & Griffin, Reference Diener, Emmons, Larsen and Griffin1985) was also included for the purpose of testing predictive validity of the FPS-M. Participants indicated the extent of their agreements to the five items on a 7-point Likert scale (1 = strongly disagree, 7 = strongly agree). The Malay SWLS was found to have good internal consistency in a past study (Swami & Chamorro-Premuzic, Reference Swami and Chamorro-Premuzic2008), as well as in the present study (Cronbach’s alpha = .83).
Statistical analysis
We randomly split the data into two halves: the exploration sample (n = 314) and the validation sample (n = 307). The exploration sample was used to identify the superior model by examining and comparing three models: a two-correlated-factor model using ESEM, a two-correlated-factor model using traditional CFA, and a one-factor model. It is believed that modification (e.g., adding error covariance) may be applied to improve goodness of fit. The model specification henceforth represents exploratory analysis (Brown, Reference Brown2015) whereby the validation sample was then used to confirm the refined model and to test measurement invariance across gender and ethnicity groups.
All the CFAs were conducted using Mplus 7.0 (Muthén & Muthén, Reference Muthén and Muthén1998–2012). As one item was found to be slightly skewed, the robust maximum likelihood (MLR) estimator was applied in the analyses to confront the normality violation. Several indices were used to evaluate model fit, included model chi-square, Tucker-Lewis index (TLI), comparative fit index (CFI), root mean square error of approximation (RMSEA), and the standardized root mean-square residual (SRMR). A model is considered a poor fit if the chi-square value is large and statistically significant. Given that the chi-square value is highly sensitive to sample size, the ratio of chi-square value divided by degrees of freedom has been used as an index of model fit. A ratio below 3 is considered acceptable (Tabachnick & Fidell, Reference Tabachnick and Fidell2007). For the TLI and CFI, values greater than .95 indicate a good fit, with values ≥.90 considered acceptable fits. The RMSEA value should be less than .05 for a good model fit, though values less than .08 are acceptable. The SRMR should be less than .08 for a good model fit (Hu & Bentler, Reference Hu and Bentler1999). In addition, Bayesian information criterion (BIC) was used for model comparison, with a smaller value indicating better model fit.
Furthermore, we also conducted two multigroup analyses to investigate whether the structure of the FPS-M is equal across gender and ethnicity groups. Following suggestions by Byrne and Stewart (Reference Byrne and Stewart2006) and F.F. Chen, Sousa, and West (Reference Chen, Sousa and West2005), measurement invariance was tested with a four-step process. In the first step, the baseline model for the two gender groups was first identified separately. The second step is to examine the configural invariance by testing the same factor structure in the two gender groups simultaneously while allowing free estimation of the parameters. If equal factor structure is supported, the third step is done to explore factor-loading invariance by comparing the configural invariance model with the metric invariance model in which factor loadings are constrained equal across genders. If factor loading is invariant across groups, the last step will be carried out to compare the metric invariance model with the scalar invariance model in which intercepts of the measured variables are constrained equally. Finally, latent mean difference will be investigated if the scalar invariance is supported. This similar procedure was applied to examine measurement invariance across the ethnicity groups in the present study.
Measurement invariance was then identified by change in CFI (ΔCFI). The ΔCFI compares two models by computing the difference in the CFI of the models. Measurement invariance is supported when the absolute value of the ΔCFI is less than 0.01 (Cheung & Rensvold, Reference Cheung and Rensvold2002).
Results
Analysis on exploration sample
The means and standard deviations for each item of the FPS-M ranged from 4.00 (item 16) to 5.89 (item 13), and 0.53 (item 13) to 1.43 (item 12) respectively. Inspection of the skewness and kurtosis values found that item 13 was not normally distributed (skewness = -5.90, SE = 0.14; kurtosis = 39.88, SE = 0.27). As a result, we used the MLR estimation to accommodate the non-normality in the data.
Table 1 shows model fit information for the three models. The ESEM on the 16 items (Model 1) showed that all the indices except TLI were acceptable. Following the suggestion of modification indices, we added covariance between the residuals of items 9 and 11 as well as items 1 and 5 of the reciprocal subscale. The refined model (Model 1a) indicated a good fit to the data. Next, the hypothetical model of two correlated factors (Model 2) was examined using traditional CFA. For the purpose of model identification, the loadings for the first item of each subscale (i.e., items 1 and 2) were fixed to 1. Similarly, the model indicated an acceptable fit to the data except for TLI, which was below the acceptable cut-off. Specifying the residuals of items 9 and 11 followed by items 1 and 5, as suggested by modification indices, first yielded a good fit model (Model 2a). The CFI and TLI of the one-factor model (Model 3) were below the suggested cutoff. Adding residual covariance (Model 3a) then improved the CFI but not the TLI.
Table 1. Goodness-of-fit indices for the Malay version of the Filial Piety Scale (Exploration Sample, N = 314)
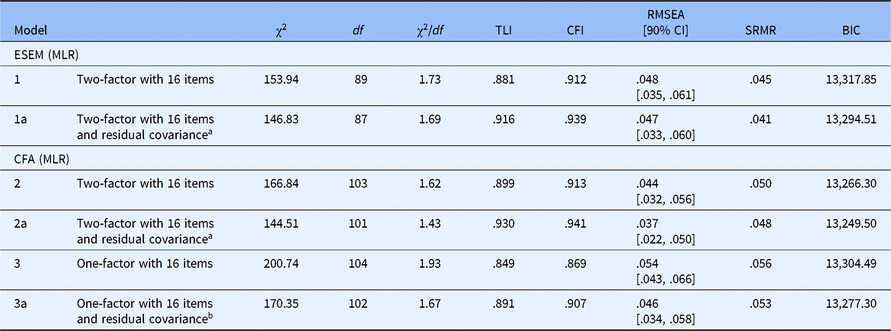
Note: CI = confidence interval.
a Residual covariance between items 9 and 11 and items 1 and 5.
b residual covariance between items 3 and 7 and items 9 and 11. All chi-square values are significant at .001 level.
Taken together, both the two-factor models using ESEM (Model 1a) and traditional CFA (Model 2a) were found to have good fit to the data. The latter is preferable for its lower BIC value and all goodness indices, though the SRMR was better in Model 1a.
Analysis of validation sample
Analysis of the exploratory sample showed that the theoretical two-factor model with residual covariances is superior to all competing models. However, note that the post-hoc model specification was conducted on the exploratory basis and hence it is not clear whether the results can be replicated. To address this doubt, we tested the two-factor model on the validation sample.
The means and standard deviations for each item ranged from 4.13 (item 16) to 5.84 (item 13) and 0.63 (item 13) to 1.41 (item 16) respectively. In the validation sample, item 13 was not normally distributed (skewness = -5.16, SE = 0.14; kurtosis = 30.07, SE = 0.28) and hence, the MLR estimator was applied to the analysis.
Results showed that the model yielded a good fit to the data: χ2(101) = 160.03, p < .001, TLI = .942, CFI = .951, RMSEA = .044, 90% CI [.030, .056], SRMR = .048. All the factor loadings and the correlation between the two subscales were statistically significant, but not the two error covariances. As a result, we conducted another analysis without the error covariances. The 16-item, two-factor correlated model (i.e., theoretical model) showed a good fit to the data: χ2(103) = 163.07, p < .001, TLI = .942, CFI = .951, RMSEA = .044, 90% CI [.030, .056], SRMR = .048. Similarly, the factor loadings were all significant and the two subscales were significantly correlated.
The reciprocal subscale was found to have acceptable internal consistency (omega coefficient = .791, 95% CI [.773, .809]), and similarly for the authoritarian subscale (omega coefficient = .732, 95% CI [.708, 756]). Moreover, both reciprocal and authoritarian subscale scores were significantly related to life satisfaction: r(305) = .36, p < .001 for reciprocal; r(305) = .34, p < .001 for authoritarian. The results offer support for the reliability and predictive validity of the FPS-M.
Measurement invariance
Analysis across gender groups
First, we tested the baseline model simultaneously in male and female participants (Model 1). The baseline model for female participants was fit to the data: χ2(103) = 122.61, p = .091, CFI = .946, TLI = .937, RMSEA = .034, 90% CI [.000, .056], SRMR = .065, while the baseline model for male participants was found acceptable: χ2(103) = 160.92, p < .001, CFI = .902, TLI = .886, RMSEA = .062, 90% CI [.043, .080], SRMR = .062. However, the factor loading of item 13 (‘Hurry home upon the death of a parent, regardless of how far away you live’) was not significant in the male model. On an exploratory basis, we reran the analysis without item 13. The new 15-item baseline model was fit for the two gender groups: χ2(89) = 114.30, p = .04, CFI = .932, TLI = .920, RMSEA = .042, 90% CI [.011, .063], SRMR = .064 for females; χ2(89) = 121.03, p = .02, CFI = .942, TLI = .931, RMSEA = .049, 90% CI [.023, .70], SRMR = .056 for males. Moreover, the configural model in which testing the baseline models pertinent to the two gender groups simultaneously was supported: χ2(178) = 235.009, p = .003, CFI = .938, TLI = .927, RMSEA = .046, 90% CI [.028, .061], SRMR = .060. The metric invariance model in which factor loadings were constrained to be equal showed an acceptable model fit in most of the criteria: χ2(191) = 264.295, p = .0004, CFI = .920, TLI = .912, RMSEA = .050, 90% CI [.034, .064], SRMR = .104. However, comparison between the configural model and the metric model showed a significant difference, χ2(13) = 28.369, p = .008, (ΔCFI = .018). In other words, the factor structure does not hold for the two gender groups. As a result, we did not proceed to test the equivalence of intercepts and mean difference.
Analysis across ethnic groups
We also tested measurement equality across Chinese and Indian participants. We did not include Malay participants in the analysis due to the discrepancy in the number of participants. Table 2 summarizes the results of the tests of measurement invariance. While we attempted to establish a baseline model for each group, the hypothesized model for the Chinese participants generated a good fit model: χ2(103) = 145.29, p = .004, CFI = .929, TLI = .918, RMSEA = .049, 90% CI [.028, .066], SRMR = .061, as well as the hypothesized model for the Indian participants, χ2(103) = 131.721, p = .03, CFI = .919, TLI = .906, RMSEA = .044, 90% CI [.015, .064], SRMR = .064. Next, we examined the configural model in which the baseline models pertinent to the two ethnicity groups were tested simultaneously (Model 1). Results revealed good fit statistics: χ2(206) = 276.988, p < .001, CFI = .925, TLI = .913, RMSEA = .046, 90% CI [.031, .060], SRMR = .062, supporting that the overall pattern of parameters was equal across the Chinese and Indian groups. Similarly, the metric invariance model (Model 2) in which factor loadings were constrained to be equal showed an acceptable model fit: χ2(220) = 300.252, p = .003, CFI = .916, TLI = .908, RMSEA =.048, 90% CI [.033, .061], SRMR = .088. Moreover, the comparison between Model 1 and Model 2 supported the invariance of factor loadings over ethnic groups. After that, we tested the scalar invariance model (Model 3) of which all factor loadings and item intercepts were constrained to be equal across Chinese and Indian groups. Results showed a poor model fit: χ2(236) = 353.76, p < .001, CFI = .876, TLI = .874, RMSEA = .056, 90% CI [.043, .068], SRMR = .126. At the same time, the critical comparison between Model 2 and Model 3 failed to support the invariance of item intercepts across ethnic groups. We released the intercepts for items 2, 4, 5, 7, 8, 10, 12, and 16 based on the differences between the two groups. Although the modified model (Model 3b) demonstrated an improvement in the model fit: χ2(228) = 321.731, p < .001, CFI = .902, TLI = .896, RMSEA = .051, 90% CI [.037, .063], SRMR = .101, the comparison between Model 2 and Model 3b indicated failure in achieving partial scalar invariance (ΔCFI = .012). In other words, item intercepts were not equivalent across the two ethnicity groups. Taken together, our data support that the factor loadings, but not intercepts, of the hypothesized model were equivalent across Chinese and Indian participants. As non-invariant intercepts adversely impact the type I error and power and may lead to a false conclusion (Whittaker, Reference Whittaker2013), we did not proceed to test latent mean difference.
Table 2. Goodness-of-fit indices for tests of invariance of the 16-item, two-factor model of the Malay version of the Filial Piety Scale for Chinese and Indian participants using MLR

Note: In the partial scalar invariance model, intercepts of item 2, 4, 5, 7, 8, 10, 12, and 16 were freely estimated.
Discussion
The 16-item FPS is a widely used scale for the measurement of filial piety. We translated the FPS into Malay and tested its psychometric qualities in a sample of adolescents in Malaysia.
Analysis on the exploratory sample showed that the theoretical two-correlated-factor model with error covariances is superior to the single-factor model. The results support that filial piety attitude can be explained by two dimensions: reciprocal and authoritarian filial piety (Yeh & Bedford, Reference Yeh and Bedford2003). In order to identify the best model, we conducted both traditional CFA and ESEM. Interestingly, although the results generated from the two solutions are compatible, the traditional CFA is preferable. The finding is somewhat inconsistent with the literature that ESEM is preferable to the traditional CFA, which poses a stringent constraint of zero cross-loadings (Wiesner & Schanding, Reference Wiesner and Schanding2013). However, it has also been argued that the superiority of ESEM to generate better factorial solution is more likely to be observed for multidimensional psychological instruments (Morin, Marsh, & Nagengast, Reference Morin, Marsh, Nagengast, Hancock and Mueller2013). As the FPS-M only consists of two dimensions with 16 items, the advantage of the ESEM may not be fully reflected. Indeed, only three items of the reciprocal subscale (items 5, 9, and 15) cross-loaded onto the authoritarian filial piety. The results support that most of the FPS-M items are clearly defined, as our respondents perceived that the target items (i.e., items that belong to the same factor) are more consistent than the non-target items.
The two-correlated-factor model structure was further tested and confirmed by another CFA on the validation sample. The results also showed support for the reliability and predictive validity of the Malay FPS. Both subscales of the FPS-M have acceptable internal consistency, as reported in the literature (e.g., Yeh & Bedford, Reference Yeh and Bedford2003). Moreover, in line with past studies (Sun, Liu, Jiang, & Qian, Reference Sun, Liu, Jiang and Qian2016), the two subscales were positively correlated with life satisfaction. In addition, examination of measurement invariance revealed that the factor structure of the FPS-M was not equal across genders. Specifically, female students perceived that item 13 (“Hurry home upon the death of a parent, regardless of how far away you live”) indicates an important element of reciprocal filial piety, but the same did not hold for male students. Such results are consistent with past findings of gender differences in filial attitude (e.g., S.X. Chen, Bond, & Tang, Reference Chen, Bond and Tang2007; Wong, Leung, & McBride-Chang, Reference Wong, Leung and McBride-Chang2010). Males tend to provide material and financial support for their parents, while females focus on emotional support and maintaining attachments with family elders (Yue & Ng, Reference Yue and Ng1999). Moreover, given the stereotypical children’s role in the Asian culture, daughters are more likely to be a caregiver for their parents (McGrew, Reference McGrew1998). The sense of obligation means daughters have a stronger feeling toward their parents’ death than sons.
In contrast, the factor loadings, but not intercepts, of the FPS-M were invariant across the Chinese and Indian participants. While our data is not able to identify the cause, we speculate that the failure of achieving intercept invariance could be due to two reasons. One is that some of the items are more important to one of the groups than the other. Put differently, the differences imply that while both ethnicity groups recognize that filial piety comprises of reciprocal and authoritarian dimensions, some of the filial piety elements are deemed as more typical and critical in their cultures. Researchers are recommended to apply a qualitative method to understand the filial beliefs of the three major ethnicity groups in Malaysia. It is believed that the results can shed light on the similarities and differences in the filial piety concept that are helpful to refine the items of the FPS-M. Another reason is the confounding effect of the small sample size. Future studies may resolve this issue by replicating the present study with equal numbers of participants from different ethnic groups.
The present study contributes to the literature in two ways. First, the results suggest that the two-factor structure of the FPS is robust and that translation has a negligible impact on perception of the items. Therefore, researchers in different cultures are encouraged to translate the FPS into the official language of the targeted population to help their understanding. In addition, the development of the Malay FPS adds another measure of filial beliefs for Malaysian population. Such a useful tool opens the door to the advancement of local as well as cross-cultural filial piety research.
Nevertheless, the present study is not without its limitations. First, it focused solely on an adolescent population, which was inadequate for overgeneralization to other populations. In fact, past studies have found developmental differences in filial piety between pre-adolescents and adolescents. For instance, Chinese Malaysian pre-adolescents tended to cite parental authority while adolescents were more likely to endorse filial obligation to justify their compliance in the personal domain of filial dilemma (Cheah, Leung, & Özdemir, Reference Cheah, Leung and Özdemir2017).
Moreover, using a single method (self-report) may generate a narrow view of the results. More studies are warranted to examine psychometric properties besides the construct validity of the FPS-M by examining the relationship of filial piety with other validated measurement or using other assessment method such as parents’ rating.
Conclusion
Although more studies are needed to confirm adequateness of the scale, the Malay FPS demonstrates adequate psychometric properties for psychological testing. Our findings support that the FPS-M is a useful measure of filial beliefs, and researchers can assuredly apply the scale on Malaysian adolescents.
Author ORCIDs
Chee-Seng Tan, 0000-0003-2474-6942.
Acknowledgments
The data in this study were obtained from a project funded by the Universiti Tunku Abdul Rahman Research Funding (vote account: 6200/T89), which was awarded to Soon-Aun Tan.
Financial Support
None.


 Open access