


Introduction
Atom probe tomography (APT) stems from the field-ion microscopy (FIM) that allowed Erwin Müller and his collaborators to image individual atoms already in the 1950s (Müller & Bahadur, Reference Müller and Bahadur1956). In FIM, the image of each of the surface atoms is formed by the successive impact of thousands of gas ions per second on the screen. The ion trajectories in FIM are expected to be determined, for a given specimen geometry and microscope, only by the distribution of the electrostatic field (Smith & Walls, Reference Smith and Walls1978), assuming that dynamic effects associated with the pulsed voltage can be neglected. To a first approximation, the projection of these ions can be well reproduced by an equidistant projection (Wilkes et al., Reference Wilkes, Smith and Smith1974), or, to a certain extent, by a pseudo-stereographic projection (Blavette et al., Reference Blavette, Sarrau, Bostel and Gallot1982; Cerezo et al., Reference Cerezo, Warren and Smith1999; De Geuser & Gault, Reference De Geuser and Gault2017).
The first design of atom probes involved using FIM to target regions of interest at the specimen's surface and specifically allow certain imaged atoms to pass through a probe hole in the FIM screen to reveal their elemental identity by time-of-flight mass spectrometry. Already then, it became evident that there were so-called aiming errors (Krishnaswamy et al., Reference Krishnaswamy, McLane and Müller1975) that meant that atoms imaged by FIM would not end up being analyzed as they “missed” the hole. The development of the imaging atom probe (Panitz, Reference Panitz1973), with a field of view comparable to FIM but with a limited analytical range, demonstrated that the imaged position of a surface atom by FIM and the impact position of this same atom following field evaporation were dissimilar.
These differences can be understood as image gas ions forming the field-ion micrograph originate from a region located 1–5 Angstroms above the surface typically near the critical distance for ionization x c, while as the specimen's atoms ionize and desorb, they do so at the surface. The ions generated by field ionization and field evaporation, hence, do not travel through the same electrostatic field. This is summarized in Figure 1. It is in the early stages of its flight, departing from the surface, that the ion is most subject to aberrations. Indeed, right at the surface, the atomic roughness leads to very strong local variations of the electrostatic field that are well reproduced by finite-element simulations (Vurpillot et al., Reference Vurpillot, Bostel and Blavette2000a). These highly localized gradients can cause very local surface rearrangements by short-range surface migrations (Waugh et al., Reference Waugh, Boyes and Southon1976), and it was proposed that atoms in the process of leaving the surface “roll-up” on their neighbors (Schmidt et al., Reference Schmidt, Ernst and Suchorski1993), and demonstrated this experimentally for Rh (Suchorski et al., Reference Suchorski, Medvedev and Block1996). Sanchez et al. (Reference Sanchez, Lozovoi and Alavi2004) used density-functional theory (DFT) under intense electrostatic fields to study the energy barrier for field evaporation and field-assisted surface diffusion in the case of Al, and showed that they were linked—that is, the magnitude of the electric fields necessary for field evaporation also greatly facilitate surface diffusion, facilitating the roll-up. More recently, Ashton et al. (Reference Ashton, Mishra, Neugebauer and Freysoldt2020) further demonstrated by DFT that the roll-up on neighbors was the energetically favorable path to field evaporation in the case of W. These studies on pure metals with the evaporation field ranging from low (Al) to medium (Rh) to high (W) suggest that the roll-up may be affecting most metals, which agrees with the suggestion of Wada (Reference Wada1984) that above a relatively modest temperature, the DC field evaporation rate is controlled by surface diffusion processes.

Fig. 1. Schematic diagram of the difference between the trajectories of a population of imaging gas ions, in blue, leading to the formation of an individual spot on a field-ion micrograph, and, in red, for an individual field evaporated ion leading to a single detector impact in atom probe tomography.
Whereas APT's depth resolution is sufficient to resolve interatomic distances across a wide range of families of planes, materials, and experimental conditions (Vurpillot et al., Reference Vurpillot, Da Costa, Menand and Blavette2001; Cadel et al., Reference Cadel, Vurpillot, Larde, Duguay and Deconihout2009; Gault et al., Reference Gault, Moody, De Geuser, La Fontaine, Stephenson, Haley and Ringer2010a; Jenkins et al., Reference Jenkins, Danoix, Gouné, Bagot, Peng, Moody and Gault2020), these effects combine to limit the lateral resolution of APT generally to more than an interatomic distance based on simulations (Vurpillot et al., Reference Vurpillot, Bostel, Cadel and Blavette2000b; Vurpillot & Oberdorfer, Reference Vurpillot and Oberdorfer2015) and experimentally (Vurpillot et al., Reference Vurpillot, Da Costa, Menand and Blavette2001; Haley et al., Reference Haley, Petersen, Barton and Ringer2009).
These studies were mostly theoretical or on pure metals. Yet APT is nowadays used mostly by materials scientists and engineers interested in mapping the composition of small secondary phase particles or localized compositional fluctuations associated with solute clustering or short-range ordering. Assessing the spatial performance of APT in this context is a true challenge. Recently, De Geuser and Gault performed a systematic review of the literature comparing small-angle scattering to APT and proposed that the spatial resolution in the analysis of nearly spherical particles was limited to somewhere in the range of 0.5–1.5 nm (De Geuser & Gault, Reference De Geuser and Gault2020). Their study highlighted the complexity to pinpoint an individual value as the resolution will depend on the difference in the field evaporation behavior of the matrix and that of the precipitate. This approach is however not directly transferable to all analyses, in particular localized segregations and compositionally complex solid solutions, that is, high-entropy alloys.
In the analyses of these alloys, it is common to study the statistical distribution of alloying elements in an APT dataset in order to compare it to a random distribution, for instance by binning the data into blocks of a certain number of atoms (Hetherington et al., Reference Hetherington, Hyde, Miller and Smith1991; Moody et al., Reference Moody, Stephenson, Ceguerra and Ringer2008). This approach is often referred to as “frequency distribution,” and it became commonly used to study compositional fluctuations in spinodally decomposing systems, that is, over length scales in the range of nanometers. Its applicability to solute clustering or short-range ordering, that is, over interatomic distances, has not been assessed. Yet, a cornucopia of articles on bulk metallic glasses (Miller et al., Reference Miller, Shen and Schwarz2003; Kontis et al., Reference Kontis, Köhler, Evertz, Chen, Schnabel, Soler, Bednarick, Kirchlechner, Dehm, Raabe, Schneider and Gault2018; Sarker et al., Reference Sarker, Isheim, King, An, Chandra, Morozov, Page, Wermer, Seidman and Dolan2018), nanocrystalline alloys (Detor et al., Reference Detor, Miller and Schuh2005), high-entropy alloys (Deng et al., Reference Deng, Tasan, Pradeep, Springer, Kostka and Raabe2015; Rao et al., Reference Rao, Diao, Ocelík, Vainchtein, Zhang, Kuo, Tang, Guo, Poplawsky, Zhou, Liaw and De Hosson2017), and other compositionally complex alloys, as well as semiconductors (Galtrey et al., Reference Galtrey, Oliver, Kappers, Humphreys, Stokes, Clifton and Cerezo2007) use it to assess an absence of solute clusters or short-range order.
An alternative method is to directly quantify the distance between nearest neighbors (Shariq et al., Reference Shariq, Al-Kassab, Kirchheim and Schwarz2007; Stephenson et al., Reference Stephenson, Moody, Liddicoat and Ringer2007) and compare the distribution of distances to the one obtained from a randomly labeled dataset. The latter is a separate, duplicated reconstructed dataset in which the atomic positions are maintained, but the mass-to-charge ratios are swapped randomly, mimicking a randomly distributed set of atoms. The comparison of these two distributions is only typically visual and rarely quantitatively assessed statistically.
Here, we want to offer some reflections and new insights into the spatial performance of APT, based on experimental and computational results, in part based on (in)direct comparison with FIM. The renewed interest in FIM (Vurpillot et al., Reference Vurpillot, Danoix, Gilbert, Koelling, Dagan and Seidman2017), including combined with new simulation approaches (Katnagallu et al., Reference Katnagallu, Dagan, Parviainen, Nematollahi, Grabowski, Bagot, Rolland, Neugebauer, Raabe, Vurpillot, Moody and Gault2018, Reference Katnagallu, Stephenson, Mouton, Freysoldt, Subramanyam, Jenke, Ladines, Neumeier, Hammerschmidt, Drautz, Neugebauer, Vurpillot, Raabe and Gault2019; Klaes et al., Reference Klaes, Lardé, Delaroche, Parviainen, Rolland, Katnagallu, Gault and Vurpillot2021), and the development of the analytical FIM (Katnagallu et al., Reference Katnagallu, Stephenson, Mouton, Freysoldt, Subramanyam, Jenke, Ladines, Neumeier, Hammerschmidt, Drautz, Neugebauer, Vurpillot, Raabe and Gault2019) enable us to provide a critical perspective on the analysis of local neighborhoods by APT in the case of pure metals, local segregations in dilute alloys, and concentrated alloys.
Methods
Ion Trajectory Modeling
Here two sets of simulations are reported, both make use of the field evaporation simulation framework introduced in Rolland et al. (Reference Rolland, Vurpillot, Duguay and Blavette2015). This approach is meshless and uses the Robin model to determine the local charges on each atom at the surface of a field emitter, and then derives the electric field distribution at and in the vicinity of the surface. The simulations of the field evaporation behavior of the NiRe binary alloy and the concentrated alloys were performed using the latest version of this model described in detail in Klaes et al. (Reference Klaes, Lardé, Delaroche, Parviainen, Rolland, Katnagallu, Gault and Vurpillot2021).
In addition, recently, Klaes et al. (Reference Klaes, Lardé, Delaroche, Parviainen, Rolland, Katnagallu, Gault and Vurpillot2021) included the possibility to perform field-ion micrograph simulations. This model allows for simulating the trajectories of both the image gas ions departing from the ionization zone above the specimen's surface and the field evaporated ions departing from the surface itself. The details of the simulation technique can be found in Klaes et al. (Reference Klaes, Lardé, Delaroche, Parviainen, Rolland, Katnagallu, Gault and Vurpillot2021). The set of simulations reported for FIM make use of this model.
Analytical FIM
In Katnagallu et al. (Reference Katnagallu, Stephenson, Mouton, Freysoldt, Subramanyam, Jenke, Ladines, Neumeier, Hammerschmidt, Drautz, Neugebauer, Vurpillot, Raabe and Gault2019), a new approach termed analytical field-ion microscopy (aFIM) was introduced that makes use of the single-particle detector of a commercial atom probe (the LEAP 5000 XS) and the associated time-of-flight mass spectrometer to perform field-ion microscopy under relatively low imaging gas pressure. Here, pure tungsten needles were prepared from a drawn wire most often exhibiting a ⟨110⟩ z-axis orientation, by using electrochemical polishing at 5–8 VAC in a 5% molar NaOH solution. Pure He was introduced in the LEAP analysis chamber, following flushing and evacuating the gas mixing chamber twice with pure gas, and refilling it to approximately 1 Torr (with 1 Torr approx. 133 Pa). For FIM, the specimen temperature was set to 50 K and, with a manual leak valve, a low pressure in the range of 1 × 10⁻⁷ Torr of He then admitted into the analysis chamber. The LEAP was operated in high-voltage (HV) pulsing mode at a pulse repetition rate of 250 kHz. Field ionized events are recorded on the particle detector and the detector coordinates are accessible through the EPOS file format. Matlab and Python scripts were then used to process the data, scripts which would be made available upon request to the authors.
Results
Pure Metals: Experiments
Analytical FIM combines the imaging capability of FIM with the possibility of detecting the ion following its field evaporation, thereby estimating the difference in the imaging ions and corresponding field evaporated atom directly accessible. An aFIM analysis of a pure W specimen is shown in Figure 2. First, an equivalent FIM image is built by forming a histogram of the imaging gas ion detector hits (Fig. 2a). The typical ring features appear around the main sets of crystallographic planes, as expected. We plot in Figure 2b the location of the W3+ and W4+ ions that appeared as part of the multiple hits. As expected from the early work of Waugh et al. (Reference Waugh, Boyes and Southon1976) comparing FIM and field desorption, the atomic sharpness of the image is lost. The pattern formed is close to the typical desorption pattern observed in APT for higher charges states and multiple hits detected in the analysis of pure W.

Fig. 2. Image formed from field ionized events on the detector (left) and hit positions of the identified W ions on the detector (right) consistent with field desorption maps seen from APT runs of the higher charge states for pure W.
We acquired another aFIM dataset on pure W also at 50 K on the LEAP 5000 XS, with a 35% pulse fraction over a standing 6 kV, and 0.15 to 3.6 × 10⁻⁸ Torr of He. Filtering techniques for the time-of-flight spectrum in aFIM are described in Katnagallu et al. (Reference Katnagallu, Stephenson, Mouton, Freysoldt, Subramanyam, Jenke, Ladines, Neumeier, Hammerschmidt, Drautz, Neugebauer, Vurpillot, Raabe and Gault2019) and enabled by the correlations in the field evaporation process: the local rearrangements of the charges following the field-induced desorption of an imaging gas atom adsorbed on the surface causes a sudden increase in the local electrostatic field that the neighboring surface atoms are subjected to Katnagallu et al. (Reference Katnagallu, Dagan, Parviainen, Nematollahi, Grabowski, Bagot, Rolland, Neugebauer, Raabe, Vurpillot, Moody and Gault2018), which favors their field evaporation in close spatial and temporal correlation (De Geuser et al., Reference De Geuser, Gault, Bostel and Vurpillot2007).
Figure 3a shows the corresponding mass spectrum from this dataset, with all the data shown in black, and the data following filtering specifically for ions on multiple hits within selected ranges of the mass-to-charge ratio and for impacts that are within 4 mm of each other on the detector. The vast majority of multiple hits processed are Ne–W or He–W (>92.9%), and not just W–W multiple hits. This trend is not surprising considering the higher gas pressure. It is also documented that the probability of multi-hit detection is directly proportional to the strength of the electrostatic field and hence the detection rate (De Geuser et al., Reference De Geuser, Gault, Bostel and Vurpillot2007). Here, the charge-state ratio of W (taken as the number of W3+ ions detected over W4+) in the case of APT (15% PF, 50 K) is 30.44, whereas in the aFIM case (35% PF, 50 K, 10−8 Torr of He), it is only 9.52. This indicates that we are under 5–10% lower electrostatic field conditions according to Kingham's calculations (Kingham, Reference Kingham1982). This was to be expected from Müller's early work on the influence of gas on the field evaporation (Müller et al., Reference Müller, Nakamura, Nishikawa and McLane1965).

Fig. 3. (a) Unfiltered (black) and filtered mass spectra for an aFIM experiment from pure W in He at 50 K. (b) Quiver plot of the distance from the impact of a W3+ atom to a Ne+ (approx. 10 million pairs), superimposed on a recalculated equivalent FIM image (280 million hits), and (c) map of the standard deviation of the associated displacement. (d) FIM image simulation in black and white, and superimposed quiver plot with vectors starting from an ion impact position and pointing to its corresponding location on the FIM image.
It is apparent from the filtered mass spectrum, that some Ne remained in the FIM gas mixing chamber. Ne has a lower ionization field than He and cannot be used to image high evaporation field materials like W, as the ionization occurs too far from the specimen's surface to lead to a high-resolution image (Nishikawa & Muller, Reference Nishikawa and Muller1964). Ne can, however, adsorb on the cold specimen's surface and migrate up the shank toward the highest electric field regions. Adsorbates on top of a W atom is expected to strongly attract and localize the charges (Neugebauer & Scheffler, Reference Neugebauer and Scheffler1993), which can have two consequences. First, upon field desorption of the Ne, the redistribution of these charges will cause the neighboring W atoms underneath to be subject to a higher electrostatic field, thereby enhancing their probability of field evaporation (Katnagallu et al., Reference Katnagallu, Dagan, Parviainen, Nematollahi, Grabowski, Bagot, Rolland, Neugebauer, Raabe, Vurpillot, Moody and Gault2018). Second, both the He or Ne adsorbate and the W atom depart together, possibly aligned along the field line to maximize polarization, and fall apart early during the flight, on the way to the detector, once they have acquired enough charge to be subject to Coulomb explosion (Tsong, Reference Tsong1985; Blum et al., Reference Blum, Rigutti, Vurpillot, Vella, Gaillard and Deconihout2016; Zanuttini et al., Reference Zanuttini, Blum, Rigutti, Vurpillot, Douady, Jacquet, Anglade and Gervais2017; Peng et al., Reference Peng, Zanuttini, Gervais, Jacquet, Blum, Choi, Raabe, Vurpillot and Gault2019). It is worth nothing though that the difference in mass by a factor of 9 and 20 with Ne and He, respectively, makes the trajectory of the W least likely affected by Coulomb repulsion associated with a dissociative event. Either of these mechanisms would result in strong multi-hit correlations (De Geuser et al., Reference De Geuser, Gault, Bostel and Vurpillot2007; Saxey, Reference Saxey2011; Yao et al., Reference Yao, Cairney, Gault, Zhu and Ringer2013), that is, the detection of a He/Ne ion is often associated with the detection of a W ion from very close locations on the detector.
In Figure 3b, we plotted a detector hit density map using approximately 280 million ion impacts, similar to Figure 2a. Albeit with a slightly coarser binning and with a lower gas pressure that affects the imaging conditions, poles are clearly visible. We superimposed onto this map a quiver plot visualizing the average distance between the impact of a W3+ ion and a Ne+ generated by the same HV pulse over the entire analysis. The corresponding vector is typically oriented radially with respect to the center of the nearest large terrace, pointing inward, that is, the W3+ impact is farther from the terrace's center. Figure 3c maps the standard deviation of the displacement between hits that can be up to 0.4 mm. The distance between impacts is low near sets of atomic planes with high-Miller indices, that is, on which the atomic packing is relatively loose and the image resolution in FIM is sufficient to distinguish individual atoms (Chen & Seidman, Reference Chen and Seidman1971). The longer distances appear near to the (011) set of planes, that is, the denser planes with the wider spacing and hence the widest terraces that lead to the build-up of stronger electrostatic gradients.
A quantitative analysis of these aberrations is out of the scope of the present article, in part because to be meaningful, this would require a thorough and systematic investigation, but also because the actual magnitude of the aberrations will vary over the course of the analysis as the specimen shape and the magnification evolve and is subject to substantial variations across the field of view as highlighted in Figure 3c. It must also be pointed out that although the charge-state ratio indicates electrostatic fields in the same range, opposite to when laser pulsing is used for instance (Gault et al., Reference Gault, Chen, Moody, Ohkubo, Hono and Ringer2011a), the presence of the gas can modify the field evaporation conditions, and to quote Erwin Müller: “The gas-surface interactions at the emitter tip of a field-ion microscope are quite complicated, and a quantitative understanding is difficult because of the many uncertainty factors of thermal accommodation, particularly in the presence of an adsorbed layer” (Müller et al., Reference Müller, Nakamura, Nishikawa and McLane1965).
Pure Metals: Computational Study
As expected from modeling work, the aberrations are intimately linked to the atomic-scale structuring of the specimen's surface, that is, terracing and local neighborhoods. In order to directly compare our experimental observations with simulations, we generated needle-shaped synthetic data for a pure metal with a body-centered crystal structure to mimic W. The specimen's radius was 12 nm. This was used as input for simulating FIM images and APT data.
Figure 3d shows part of a simulated FIM image centered on the (011) terrace in white, with individual atomic positions imaged. A quiver plot is superimposed, with red vectors starting from the location of the impact of the ion following its field evaporation and propagation from the specimen's surface onto the virtual detector and pointing to the corresponding position of the imaged atom in the FIM simulation. A similar set of observations can be made: aberrations are mostly centrifugal with respect to the terraces, and low-index poles lead to more pronounced aberrations. A key message from these results is that the regions primarily badly affected by trajectory aberrations are the low-density areas on the desorption image, which are typically where the atomic planes can be imaged in the depth of the reconstructed dataset in APT (Moody et al., Reference Moody, Gault, Stephenson, Haley and Ringer2009) and FIM (Vurpillot et al., Reference Vurpillot, Gilbert and Deconihout2007; Klaes et al., Reference Klaes, Lardé, Delaroche, Parviainen, Rolland, Katnagallu, Gault and Vurpillot2021). Higher-index poles are, however, expected to exhibit a lower depth resolution (Gault et al., Reference Gault, Moody, De Geuser, Haley, Stephenson and Ringer2009). These simulations point to a necessary compromise between the lateral and depth resolution.
In an effort to quantify the influence of these aberrations on the spatial performance of APT, we performed a series of calculations schematically depicted in Figure 4a. We consider the distance to all atoms in the first shell of nearest-neighbor atoms sitting on the same plane, which we refer to as D-1NN. These distances are extracted from a Delaunay tessellation (Lefebvre et al., Reference Lefebvre, Philippe and Vurpillot2011; Felfer et al., Reference Felfer, Ceguerra, Ringer and Cairney2015) and calculated for all ions in a reconstructed dataset that covers an angular field of view of ±30° around the [011] direction in the center of the virtual detector. The D-1NN in the input simulation cell can be directly compared with the distance to this very same nearest-neighbor in the reconstructed data. We also extract more specifically the offset in depth, dz-1NN. This offset is related to the angular difference in their trajectory, but also to the sequence in which the ions are detected, that is, when two atoms evaporate rapidly after one another, the dz is typically low—see Vurpillot et al. (Reference Vurpillot, Gault, Geiser and Larson2013) for more details. Here, we perform this calculation to estimate the spatial dispersion induced by the imaging process for a FIM image simulation for a body-centered cubic crystal, and for atoms on the same (011) atomic plane and for a field of view similar to experimental data.

Fig. 4. (a) Schematic of the initial and reconstructed atomic configurations, and the calculated quantities: the first near-neighbor distance D-1NN and the z-offset dz-1NN. D1NN and dz-1NN for atoms initially on the same plane in the input data in (b) a reconstructed FIM dataset (inset is the multilayer detector map); and (c) the corresponding reconstructed APT simulated data. Note that the orange bar in each histogram represents the initial D-1NN and dz-1NN distributions from the same volume of a perfect lattice, whereas the blue histograms represent the measured D-1NN and dz-1NN histograms of distances (using the indexes of the first nearest neighbors) in the reconstructed volumes.
The histograms of distances to the first nearest-neighbor and z-offset are plotted in Figure 4b. The distribution in the input simulation cell, prior to the imaging and evaporation simulation, is shown in orange. All distances are in a single bin, which reflects the undistorted value in the original bcc crystal. The distribution in the 3D FIM reconstructed volume using the protocol introduced by Klaes et al. (Reference Klaes, Lardé, Delaroche, Parviainen, Rolland, Katnagallu, Gault and Vurpillot2021) is shown in blue. The distribution is rather narrow around the expected theoretical value, with a full width at half maximum (FWHM) of approximately 0.15 nm, that is, around half of the distance to the first nearest neighbors, making it possible to separate the two neighboring atoms, that is, all atoms are within twice the initial nearest-neighbor distance. The dz-1NN also shows a narrow spread of approximately 0.015 nm FWHM, emphasizing once again the better spatial resolution in depth compared to laterally (Klaes et al., Reference Klaes, Lardé, Delaroche, Parviainen, Rolland, Katnagallu, Gault and Vurpillot2021). In the inset is the map representing the pile-up of positions of FIM atomic spot centers obtained after the evaporation of several surface layers. The color scale corresponds to the ion impact density, calculated around each impact using the number of counts in a delimited circle, with a radius equivalent to about 1 nm at the tip surface.
Figure 4c shows the same histograms obtained from the corresponding APT simulation, the inset is the detector impact map. The picture here is very different. The FWHM may not have changed much, still near 0.15 nm. However, the peak position has shifted toward a lower distance (0.2 nm instead of 0.22 nm, i.e., approx. 10% difference) from the theoretical value, which indicates significant density fluctuations (Stephenson et al., Reference Stephenson, Moody, Liddicoat and Ringer2007). More worryingly, nearly 17% of the ions have landed at a distance twice or more than the expected value, making it very unlikely that two neighbors from within the initial volume are indeed neighbors in the reconstructed data. The spread in distances is further evidenced in the graphs shown in a log scale (see Supplementary material).
In Alloys: Simulations
In order to assess these effects in the case of alloys, we revisited the APT simulations performed in the study of a Ni-2% Re alloy by APT and analytical FIM and reported in Katnagallu et al. (Reference Katnagallu, Stephenson, Mouton, Freysoldt, Subramanyam, Jenke, Ladines, Neumeier, Hammerschmidt, Drautz, Neugebauer, Vurpillot, Raabe and Gault2019). In this case, the Re atoms are simulated by a high-field solute segregated to stacking faults formed by deforming pure Ni by molecular dynamics in the large-scale atomic/molecular massively parallel simulator (LAMMPS). 20% of the sites on the stacking faults are replaced by atoms with a 30% higher evaporation field than the matrix. A view of the simulation cell before field evaporation is shown in Figure 5a, with the Ni matrix atoms in green and the high-field Re atoms in purple. Robin-Rolland simulation code was used on a 12 nm radius NiRe modeled tip using basic single evaporation field constants for Ni and Re, at T = 0 K. Impacts on a detector placed at 1 μm in front of the sample were used to reconstruct a virtual APT volume. As reported in Katnagallu et al. (Reference Katnagallu, Stephenson, Mouton, Freysoldt, Subramanyam, Jenke, Ladines, Neumeier, Hammerschmidt, Drautz, Neugebauer, Vurpillot, Raabe and Gault2019), reconstruction parameters were optimized to have a volume with the correct initial known dimensions. Figure 5b shows a thin slice through the data reconstructed following the simulation of the field evaporation process. The atomic planes are imaged parallel to the tangent to the local reconstructed curved surface across the field of view, that is, (002) planes in the center and the (022) planes toward the edges of the volume.

Fig. 5. (a) Simulation cell with Re segregated to stacking faults in Ni and (b) thin slice though the reconstructed simulated data. (c) D-1NN and dz-1NN for Re atoms initially on the same plane in the input data in orange and in the simulated and reconstructed data in blue.
Figure 5c show the histograms of the nearest-neighbor distance and z-offset, respectively, between a Re atom and its first nearest-neighbor Re atom. In this case, almost half of the Re atoms that were initially first neighbors end up shifted by more than twice the first nearest-neighbor distance. The distribution in the input data, in orange, is not infinitely narrow because of the defects that shift atoms from their ideal positions. The difference with the distribution of the nearest-neighbor distance in the reconstructed data in blue is readily visible: some atoms are reconstructed over a nanometer away from each other, five or more interatomic distances away from where they were initially.
With regards to the z-offset specifically, and conversely to the distributions in Figure 4c, the distribution is substantially distorted. This can be ascribed to a combination of effects. First, preferential retention of the Re with a higher evaporation field than the Ni matrix modifies the sequence of detection and causes Re atoms to be reconstructed deeper than they should have been. Second, the assumed curvature of the emitter in the reconstruction protocol means that two initially neighboring atoms will be reconstructed at increasingly different depths as their respective impact positions are farther from each other (Gault et al., Reference Gault, Haley, De Geuser, Moody, Marquis, Larson and Geiser2011b).
Concentrated Solid Solutions
Here, we wanted to simulate the case of a high-entropy alloy, which can also be referred to as a compositionally complex alloy or a concentrated multi-component solid solution. These alloys are the focus of many studies at the moment, and one of the most widely studied compositions is an equiatomic mixture of Fe, Cr, Ni, Co, and Mn. These elements are expected to have close evaporation fields in their pure form, nearly all within 25% around 30 V/nm (Tsong, Reference Tsong1978). The evaporation field is species dependent but also depends on the local neighborhood at the specimen's surface (Ge et al., Reference Ge, Chen, Zhang and Zhu1999). An approach to model this is to assume a single average evaporation field, modulated randomly to mimic the different species. As input for the simulations, we hence assumed an equiatomic mixture of atoms from five species, randomly distributed on a body-centered cubic lattice. Each species is given a specific evaporation field in the range ±5, ±10, and ±20% around an average value. A face-centered cubic lattice would have been closer to most studied alloys, but based on similarities in the aberration patterns from simulations from the different crystal structures (Oberdorfer et al., Reference Oberdorfer, Eich, Lütkemeyer and Schmitz2015), we expect that qualitatively similar results would have been obtained. Robin-Rolland simulation code was used on a 25 nm radius modeled tip at T = 0 K.
Figure 6 summarizes the results from the simulations for the ±5, ±10, and ±20% ranges, respectively in Figures 6(a)–6(c). The average composition is close to the expected 20% for all elements except in specific regions near poles, where the elements of higher evaporation field are much more highly concentrated—up to approximately 40%. Similar issues had been reported in the past in the analysis of Al alloys for instance (Gault et al., Reference Gault, Moody, Cairney and Ringer2012b), and it was often thought to be related to surface migration (Gault et al., Reference Gault, Danoix, Hoummada, Mangelinck and Leitner2012a), which are not accounted for in our model, conversely to others (Gruber et al., Reference Gruber, Vurpillot, Bostel and Deconihout2011), and hence cannot explain these results. This is related to the specific retention on the surface of the field evaporating specimen of the species of highest evaporation field until the local curvature near atoms of that species allows for reaching a sufficient electric field to cause its departure. Since the sequence in which ions are detected is used to derive the z-coordinate of each atom during the data reconstruction process, such a retention effect will not only affect the apparent composition but also the depth resolution.
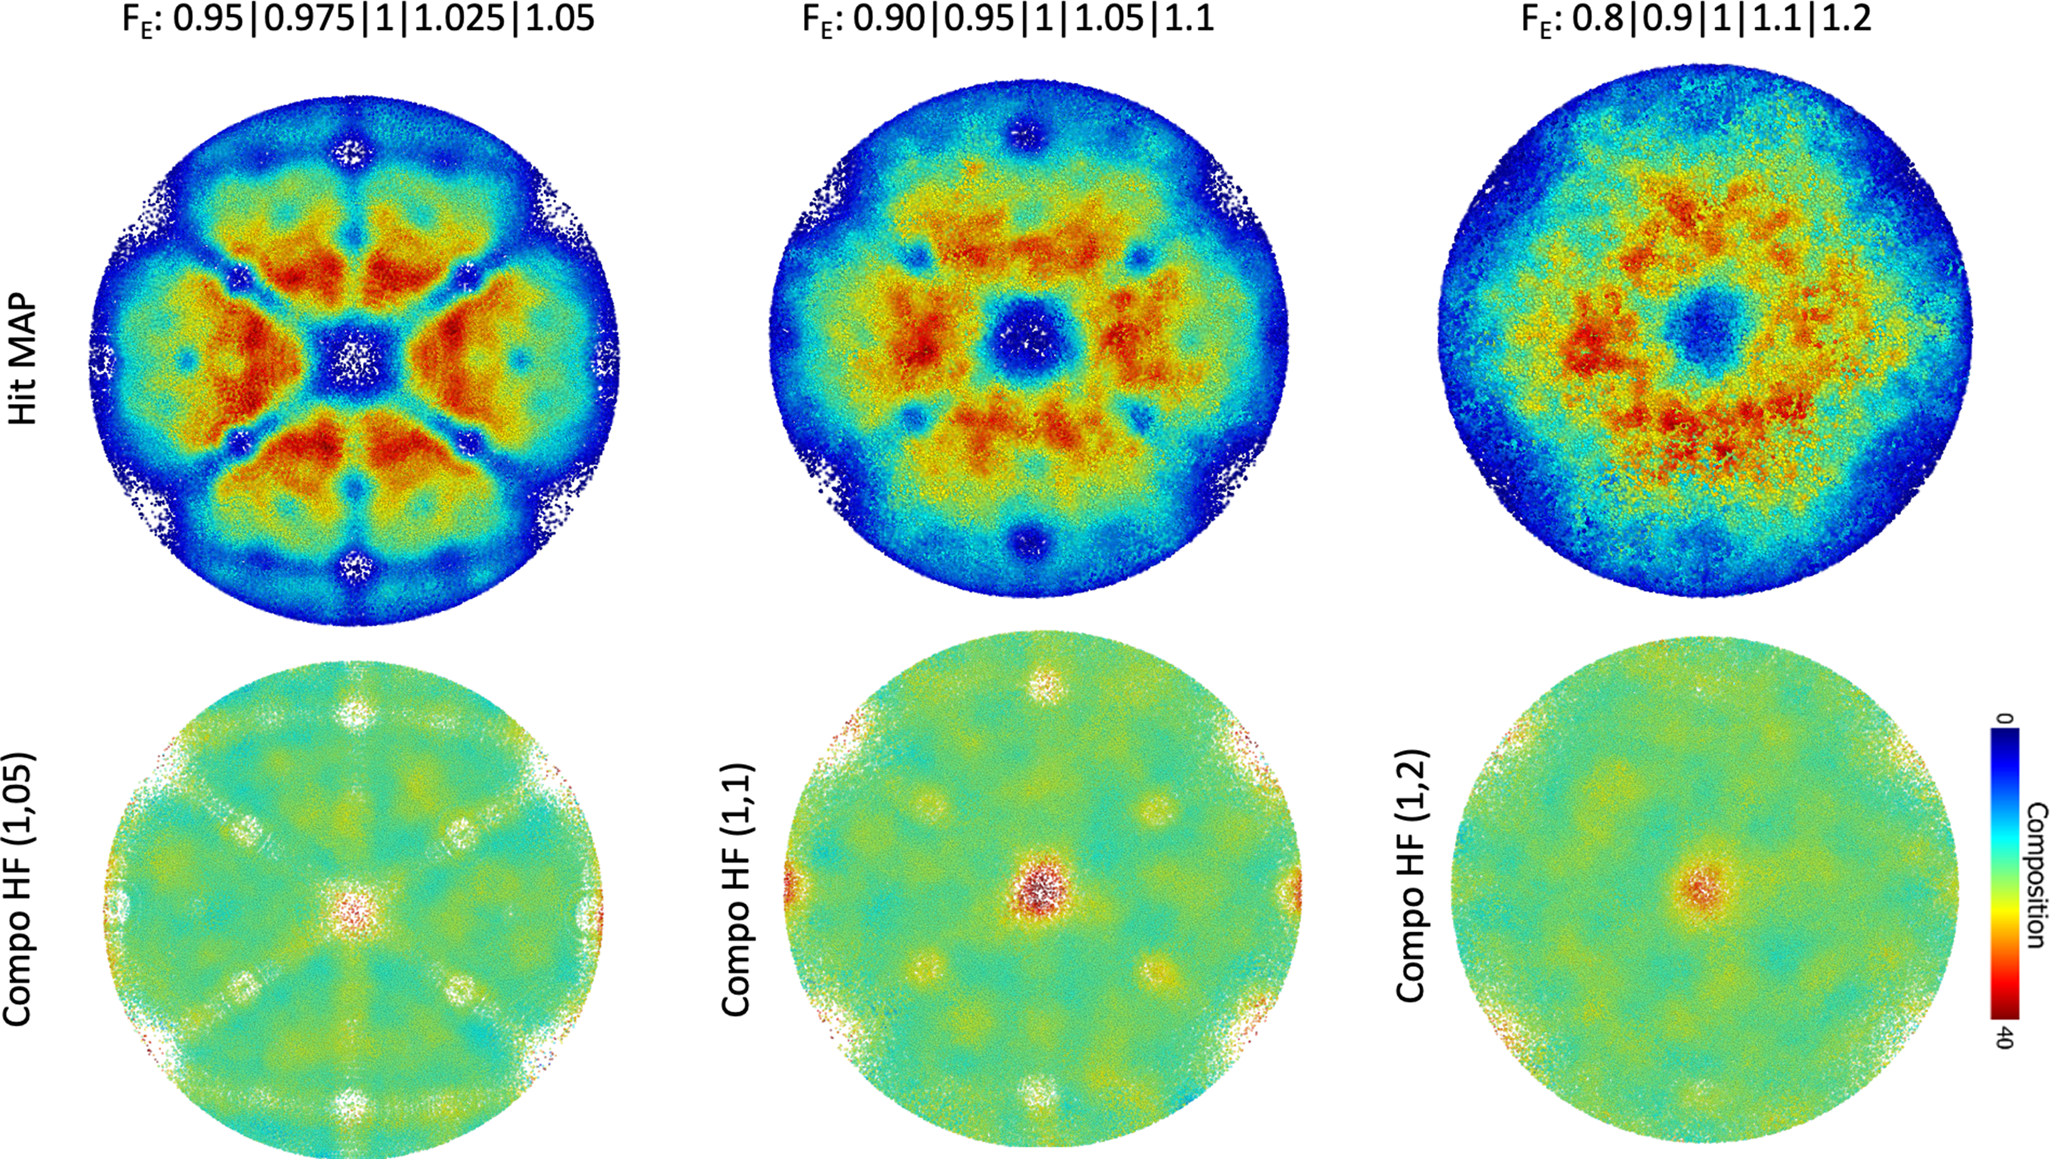
Fig. 6. Overall density map and composition map for the element of highest evaporation field for simulated data with elements with evaporation fields in the range (a) 0.95–1.05, (b) 0.9–1.1, and (c) 0.8–1.2.
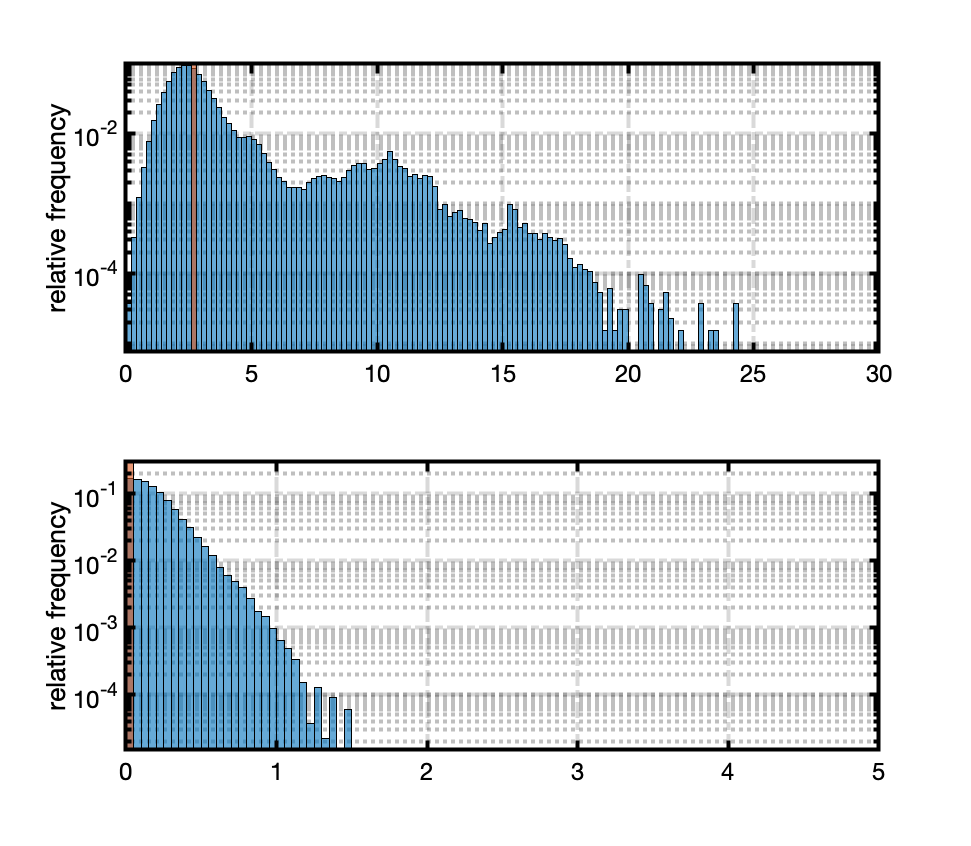
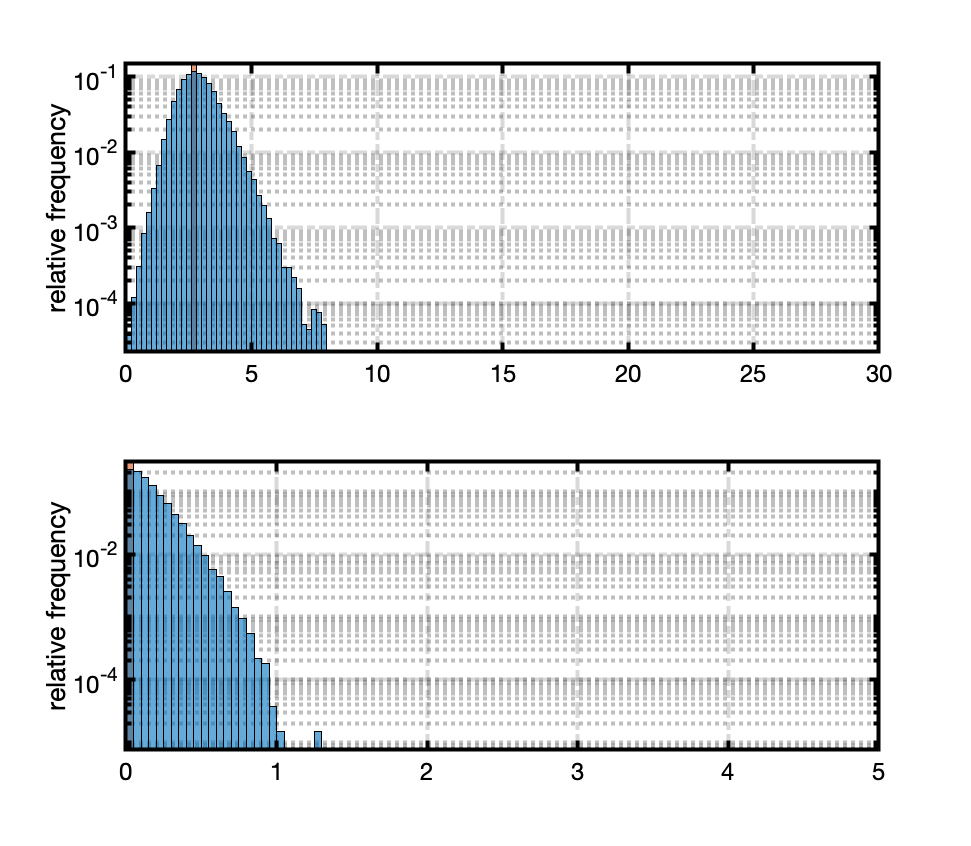
Figure 7 reports the distance and z-offset distributions between atoms initially nearest neighbors in the input data for the three ranges of evaporation fields ±5, ±10, and ±20%. The FWHM of the D-1NN distribution changes substantially, increasing from approximately 0.3 nm to 0.75 nm to 1.2 nm, and in depth (z-offset) from 0.04 nm to 0.075 nm up to 0.1 nm as the range of evaporation field increases. The precision of the measurement, hence, worsens with the compositional complexity increasing, with a clear mixing of nearest-neighbor positions. The depth coordinate is affected but not as much and the depth resolution is, hence, more robust against the distribution of evaporation fields within the material, agreeing with experimental observations.

Fig. 7. D-1NN and dz-1NN distributions between atoms initially nearest neighbors and located at the same depth in the input data after field evaporation simulation and data reconstruction for a range of evaporation field of (a) ±5%, (b) ±10%, and (c) ±20% around an average field.
General Discussion
Across the different cases we have studied here, we revisited two important aspects of APT analysis: (1) the spatial resolution is not isotropic, and the depth resolution remains higher than the lateral resolution; and (2) the depth resolution is optimal near the poles, that is in very specific locations within a dataset and not across the entire field-of-view. The depth resolution mostly relates to how sequential the field evaporation proceeds, which can be ascribed to how well the field localizes on the edges of terraces. On dense planes, with a wide interplanar spacing, terraces are wide and the unraveling of the atomic structure by field evaporation follows a well-defined sequence. On open planes, the concentration of the field is less on the edges of the terraces, but on individual atoms. This is what enables true atomic resolution in FIM, but also makes the sequence of evaporation less well determined. This underpins the compromise between lateral and depth resolution that was mentioned above. Evaporation field variations make this balance more difficult to achieve, because they firstly hinder a well-sequenced evaporation, and the atoms with a higher evaporation field remaining on the surface can further cause lateral aberrations. Ultimately, neighborhood analyses should typically be restricted to where atomic planes can be imaged as they are a sign that the field evaporation process is sufficiently well ordered to maintain the neighborhood relationships. However, they can also be locations of aberrant compositional analyses. Let us discuss specific aspects.
Pure Metals
The results we presented herein are not meant to be dismissive of previously published reports in the literature, but merely to get the reflection going on what information APT can confidently provide. Some of the authors themselves have reported on the study of atomic neighborhoods (Stephenson et al., Reference Stephenson, Moody, Liddicoat and Ringer2007) and even on exploiting this information to try and reconstruct lattice positions in pure metals (Vurpillot et al., Reference Vurpillot, Renaud and Blavette2003; Moody et al., Reference Moody, Gault, Stephenson, Marceau, Powles, Ceguerra, Breen and Ringer2011; Breen et al., Reference Breen, Moody, Ceguerra, Gault, Araullo-Peters and Ringer2015) and alloys (Moody et al., Reference Moody, Ceguerra, Breen, Cui, Gault, Stephenson, Marceau, Powles and Ringer2014; Gault et al., Reference Gault, Cui, Moody, Ceguerra, Breen, Marceau and Ringer2017). A critical perspective should have arisen from the low signal-to-background ratio in the x-y-spatial distribution maps from which the lateral resolution of APT was estimated: even in pure metals, with a narrow distribution of evaporation fields (Yao et al., Reference Yao, Withrow, Restrepo, Windl and Marquis2015), only a small fraction of neighboring atoms is reconstructed at distances compatible with their actual first shell of nearest neighbors. This was evident in Moody et al. (Reference Moody, Gault, Stephenson, Haley and Ringer2009) and was discussed at length also in other reports (Haley et al., Reference Haley, Petersen, Barton and Ringer2009).
Instead, we maintained a misleading impression that despite its apparent limitations, the lateral resolution of APT remained sufficient to resolve the lateral extent of atomic arrangements. Many have heard of projects hoping to achieve full crystallographic analysis from APT data, for instance, Ziletti et al. (Reference Ziletti, Kumar, Scheffler and Ghiringhelli2018), especially motivated by the advent of machine-learning and its application in related fields (Butler et al., Reference Butler, Davies, Cartwright, Isayev and Walsh2018; Aguiar et al., Reference Aguiar, Gong, Unocic, Tasdizen and Miller2019). However, the physics governing the early stages of the departure of the charged particle from the surface critically limit the lateral resolution of APT. The probabilistic nature of the process makes it extremely challenging, if possible at all, to correct for the resulting aberrations.
Alloys
First, the set of simulations included herein also shows that detection of high-field species at the center of the poles is not only related to surface diffusion but to the difference in the evaporation field behavior between high field and low field. This affects, for example, AlCu or AlSi and can be ascribed to “chromatic aberrations” as discussed in Marquis & Vurpillot (Reference Marquis and Vurpillot2008).
Second, our results in the analysis of solutes segregated in a binary alloy point to limitations both in the lateral and depth coordinates. A 30% difference in evaporation field between solutes and solvent is reasonable. Based on tabulated values of the evaporation field, which is admittedly an approximation, this would be less than the difference between Al and Cu for instance, combinations for which the comparison between small-angle scattering data and APT in the analysis of clusters show strong differences (De Geuser & Gault, Reference De Geuser and Gault2020). Neighborhood relationships in these clusters are hence highly unlikely to be maintained and this raises questions as to the pertinence of nearest-neighbor-based cluster-search algorithms (Dumitraschkewitz et al., Reference Dumitraschkewitz, Gerstl, Stephenson, Uggowitzer and Pogatscher2018). Over the course of a single experiment and across the field of view, the actual distance to a first nearest neighbor can change due to the magnification being non-isotropic and associated with the change in the magnification as the specimen gets blunter due to field evaporation. These aspects make approaches based on radial distribution functions to extract the characteristics of populations of clusters (Zhao et al., Reference Zhao, Gault, Ponge, Raabe and De Geuser2018) relatively more robust.
Error Estimation
We feel it is pressing that the community comes to terms with these limitations and makes use of the technique for its strengths, without attempting to exploit it for what it is not. This should not prevent us from trying to push the performance limits of APT, and challenge its limitations, but keeping in mind that the limits are mostly bound by the physics and not by the way we extract or process the data. For instance, and despite its inherent limitation, there is still much that APT can do, including in the analysis of crystallographic features patterns (Gault et al., Reference Gault, Moody, Cairney and Ringer2012c), by focusing on the analysis of the desorption patterns to work out orientation (Wei et al., Reference Wei, Gault, Varanasi, Raabe, Herbig and Breen2018) or by using the more highly resolved information in the depth to investigate site occupancy (Li et al., Reference Li, Zhou, Colnaghi, Wei, Marek, Li, Bauer, Rampp and Stephenson2021). The difference in the evaporation field between species in a mixture may also preclude some of these analyses.
The depth resolution is relatively robust against changes in the base temperature in high-voltage pulsing mode and peak temperature in laser pulsing mode for pure metals (Gault et al., Reference Gault, Moody, De Geuser, La Fontaine, Stephenson, Haley and Ringer2010a, Reference Gault, Müller, La Fontaine, Moody, Shariq, Cerezo, Ringer and Smith2010b, Reference Gault, Chen, Moody, Ohkubo, Hono and Ringer2011a). However, the relative difference in the evaporation field between species can differ as a function of the temperature (Wada, Reference Wada1984), and, hence, the situation could worsen more substantially in specific cases and lead to a critical loss of resolution that was for instance observed in some ordered phases (Vurpillot et al., Reference Vurpillot, Bostel, Cadel and Blavette2000b; Boll et al., Reference Boll, Al-Kassab, Yuan and Liu2007). Performing these analyses might require careful experimental design, for instance, by preparing specimens along specific orientations as discussed in Jenkins et al. (Reference Jenkins, Danoix, Gouné, Bagot, Peng, Moody and Gault2020), optimizing the experimental conditions (pulsing mode, base temperature, detection rate), and targeting the search for short-range ordering in metallic alloys along the direction where the depth resolution is potentially sufficient to reveal the signal—that is, typically low-index sets of planes.
It is also critical that we accept that the precision of our measurement is limited and we should probably get better, as a community, at assessing the spatial error on the atomic positions. For instance, it is commonly accepted that error bars are included in the composition measurement in a composition profile. Even if these errors might be underestimated as they do not account for species-specific losses associated with detector pile-up (Meisenkothen et al., Reference Meisenkothen, Steel, Prosa, Henry and Prakash Kolli2015; Peng et al., Reference Peng, Vurpillot, Choi, Li, Raabe and Gault2018) or molecular dissociations leading to neutral fragments for instance (Gault et al., Reference Gault, Saxey, Ashton, Sinnott, Chiaramonti, Moody and Schreiber2016; Zanuttini et al., Reference Zanuttini, Blum, Rigutti, Vurpillot, Douady, Jacquet, Anglade and Gervais2017). However, using error bars on the distance axis is most uncommon.
It may be that the representation as a point cloud is misleading—the location at which we reposition a single atom is just one of the possible positions where this atom may have been reconstructed, and it might not be the most probable position where it was located. We do not offer ready-made solutions here, simply point to some of these issues and highlight their complexity, in the hope to raise consciousness and motivate, maybe, studies in this exciting direction.
Conclusion
To conclude, lateral neighborhood relationships within materials are modified and typically not maintained by the field evaporation and APT data reconstruction process. Measured relationships should not be readily interpreted, and only directional neighborhood analyses in the depth may contain relevant information. This was hinted at in previous works, and we provide further evidence here that this affects not only pure metals or metallic glasses, but also when atoms of different evaporation fields are segregated within a matrix, and in compositionally complex alloys. The resolution is more robust in depth, and it is necessary to develop approaches to probe neighborhoods selectively in this direction. This may enable to exploit the higher resolution in this direction to reveal neighborhood relationship, for example, short-range order. Since the aberrations arise in the early stages of the ionic flight, imaging of the atomic neighborhoods prior to the field evaporation, by using field-ion imaging and aFIM in particular, bears a lot of potential for the future.
Supplementary material
To view supplementary material for this article, please visit https://doi.org/10.1017/S1431927621012952.
Acknowledgments
We thank Uwe Tezins, Christian Broß, and Andreas Sturm for their support to the FIB and APT facilities at MPIE. Shyam Katnagallu (now at KIT) and Isabelle Mouton (now at CEA) are thanked for their help and support with the aFIM. L.T.S. and B.G. acknowledge financial support from the ERC-CoG-SHINE-771602. Y.L. and L.T.S acknowledge support from the Max Planck research network on big-data-driven materials science (BiGmax). F.F.M. acknowledges financial support from the International Max Planck Research School for Interface Controlled Materials for Energy Conversion (IMPRS-SurMat). The work was funded through EMC3 Labex BREAKINGAP and the EQUIPEX ANR-11-EQPX-0020 (GENESIS). Simulated samples were generated using the ATOMSK software (Hirel, Reference Hirel2015). Visualization was performed using OVITO software (Stukowski, Reference Stukowski2010). F.V. thanks also the financial support of the University of Rouen through a CRCT funding.


 Open access