


Introduction
Auger spectroscopy is a well-established surface analytical technique in materials science [Reference Watts and Wolstenholme1], where it is referred to by a variety of acronyms, principally AES (Auger electron spectroscopy) and SAM (scanning Auger microscopy). However, AES has not found widespread application in the geological sciences. This is largely due to problems with sample charging: since most geological samples are insulators, they need to be coated prior to analysis, which cannot be done in Auger spectroscopy because of the surface sensitivity of this technique. However, Auger spectroscopy has found an important niche application in planetary science, where it can be used for the characterization of sub-micrometer mineral grains.
Presolar grains, as their name implies, are grains that are older than the solar system. They formed in the outflows of evolved stars and in the ejecta of stellar explosions (supernovae) and were a significant component of the molecular cloud from which our solar system formed. A fraction of them survived solar system formation and can be found in small amounts (< 0.1%) in primitive meteorites that have remained essentially unaltered since their formation 4.6 billion years ago. Presolar grains are recognized by their isotopic signatures, which differ substantially from those observed in other solar system materials. These grains can be studied in the laboratory to gain a better understanding of stellar evolution and nucleosynthesis of the elements. They also provide information about conditions in the stellar sources in which they formed and the environments they have traversed subsequent to formation, including the interstellar medium, the early solar nebula, and the parent bodies of the meteorites in which they are found.
Auger spectroscopy first began to be applied to the elemental analysis of sub-micrometer mineral grains about ten years ago and, since that time, has advanced to the point where it is used routinely to characterize presolar silicate grains identified in primitive meteorites [Reference Stadermann2, Reference Floss and Haenecour3]. This article summarizes the development of this technique for planetary science applications and provides examples of how Auger spectroscopy has provided constraints on the stellar origin(s) of presolar silicate grains, as well as how they have been affected by secondary processing in the parent bodies of the meteorites in which they are found.
Materials and Methods
NanoSIMS
Presolar silicate grains are identified in situ in standard meteorite thin sections using nano-scale secondary ion mass spectrometry (Cameca NanoSIMS). In SIMS instruments (also known as ion microprobes), a high-energy primary ion beam is directed at a sample, from which secondary particles (neutrals, as well as positively and negatively charged species) are then ejected. Charged particles of one polarity (“secondary ions”) can then be extracted into a mass spectrometer and are counted by an ion detector (which can be an electron multiplier, a Faraday cup, or a channel plate). The NanoSIMS, which is well suited for presolar grain research, has a lateral resolution of better than 100 nm and multi-collection capability (Figure 1a). Samples are sputtered with a ~1 pA primary Cs+ focused ion beam that is rastered over an area of interest, typically 10 × 10 µm in size, in the fine-grained matrix of a primitive meteorite (Figure 2) to look for isotopically anomalous oxygen signatures. Secondary ions of the three oxygen isotopes (16O–, 17O–, 18O–) are collected simultaneously at a mass-resolving power (M/∆M > 5000) sufficient to separate the 17O peak from the adjacent 16OH peak. The ion images are then processed offline to produce oxygen isotope ratio images (Figure 3). Compared to the surrounding isotopically normal matrix material, the presolar grains exhibit unusual isotopic compositions, such as anomalously high 17O/16O ratios.
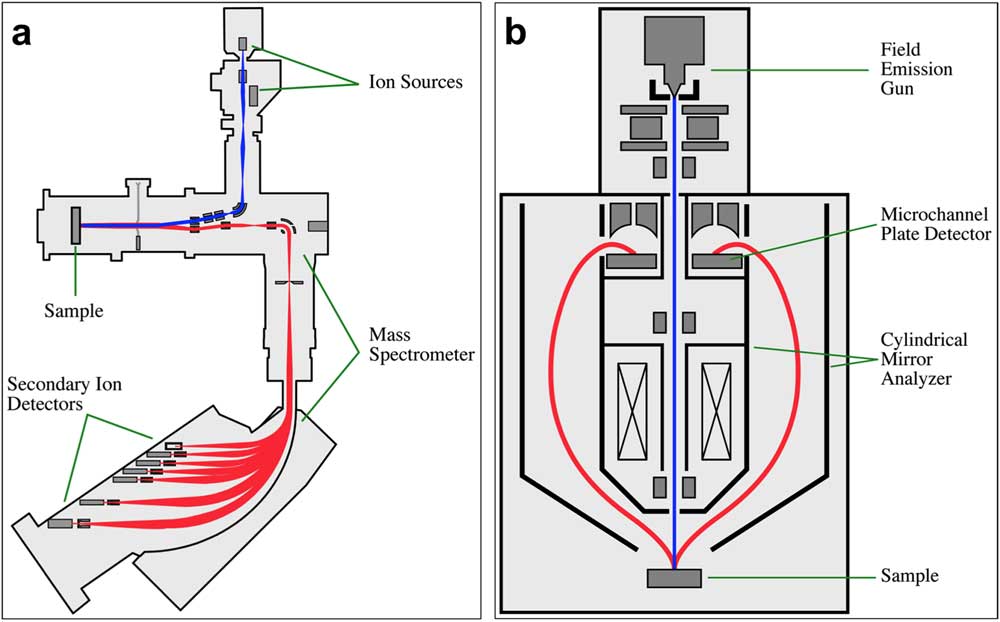
Figure 1 Schematics illustrating the coaxial beam optics of (a) the Cameca NanoSIMS 50 and (b) the Physical Electronics PHI 700 Auger Nanoprobe. In both diagrams the primary beams are shown in blue, and the secondary beams are shown in red.
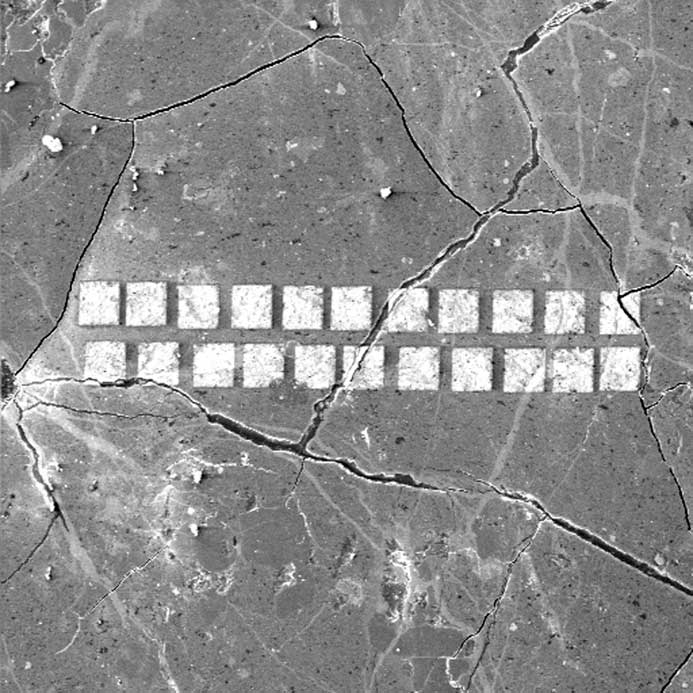
Figure 2 Secondary electron image, taken with the Auger Nanoprobe, of the fine-grained matrix from a thin section of the Queen Alexandra Range 99177 meteorite. The bright squares are areas measured with the NanoSIMS, where the carbon coat has been sputtered away. Each square measures 10 × 10 µm. Field of view = 200 µm.
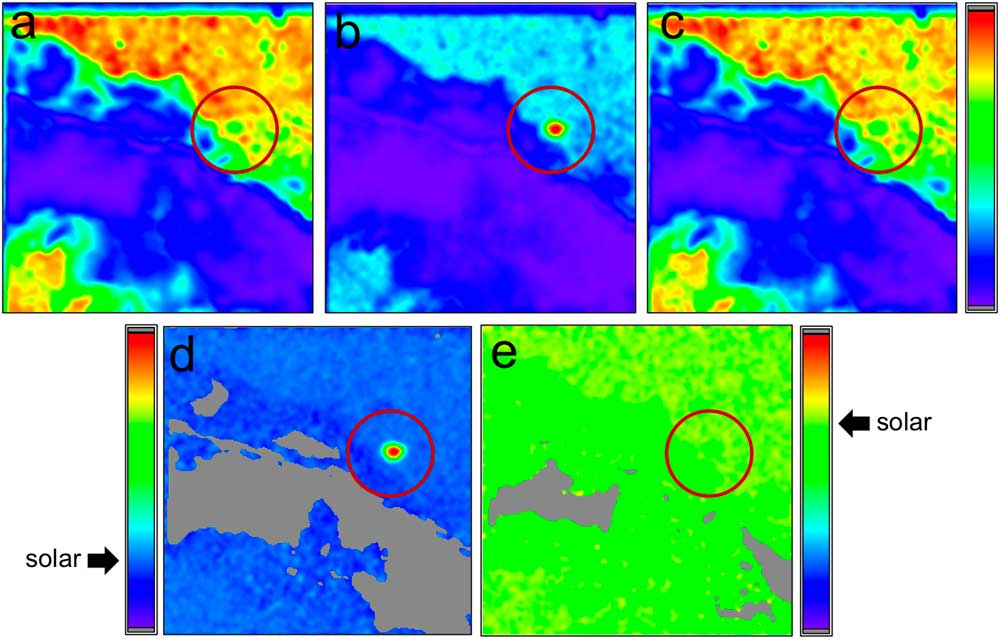
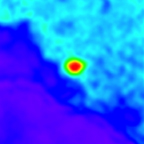
Figure 3 False color NanoSIMS raster ion images, showing signal intensities (violet = low, green = medium, red = high) for the three isotopes of oxygen: (a) 16O–, (b) 17O–, and (c) 18O–; and the ratios of those images: (d) 17O–/16O– and (e) 18O–/16O–. The red circle highlights a presolar grain from the Adelaide carbonaceous chondrite that is enriched in 17O relative to 16O and 18O. The isotopic signature of this grain indicates that it formed around a low-mass star in which 17O is produced during H burning in the core of the star. The arrows pointing to the color scales in the bottom two images refer to the solar system ratios for 17O/16O and 18O/16O, respectively. The field of view for each image = 10 µm.
Auger spectroscopy
Following the identification of the presolar grains in the NanoSIMS, elemental compositions are determined using Auger spectroscopy. In AES, identification of elements is accomplished by exciting atoms in the specimen with a primary electron beam of modest energy (2–20 keV) and measuring the energies of emitted Auger electrons, which are characteristic of the elements present. Analyses are conducted under ultra-high vacuum conditions so that the elemental concentrations measured reflect the actual sample composition without interference from contaminating surface layers. The primary electron beam can be focused to about 10 nm, and the spatial resolution of Auger elemental maps is of the same order.
The development of this technique for the analysis of presolar grains is discussed in detail elsewhere [Reference Stadermann2] and is summarized briefly here. Specific analytical protocols were established for the measurement of presolar silicates to reduce the possibility of electron beam damage, which can occasionally produce artifacts in the Auger spectra. These include the use of a low-beam current (typically 10 kV, 0.25 nA), beam rastering over the grain of interest, and acquisition of multiple spectral scans that are added together to obtain a single Auger spectrum. Auger spectra are typically smoothed and differentiated prior to peak identification. The Auger intensities can then be determined from the peak-to-peak heights in the derivative spectrum (Figure 4) in order to obtain quantitative compositional information [Reference Stadermann2]. In order to take into account matrix effects in our complex geological samples, sensitivity factors were determined for the major rock-forming elements from a variety of olivine and pyroxene standards. Reported errors are based on the 1σ uncertainties in the sensitivity factors (O: 3.6%; Si: 11%; Fe: 11.2%; Mg: 9.4%; Al: 24.9%; Ca: 10.8%). These values, which are based on the standard deviation of the Auger/electron probe ratios for the different elements in the standards used [Reference Stadermann2], can be considered lower limits since they do not include a correction for background noise or take into account other factors that can affect the quality of a spectrum (for example, sample charging, residual surface contamination). In addition to localized composition measurements, high-resolution elemental distribution maps can provide detailed qualitative information about the location of elements within and around the grains of interest (Figure 5).
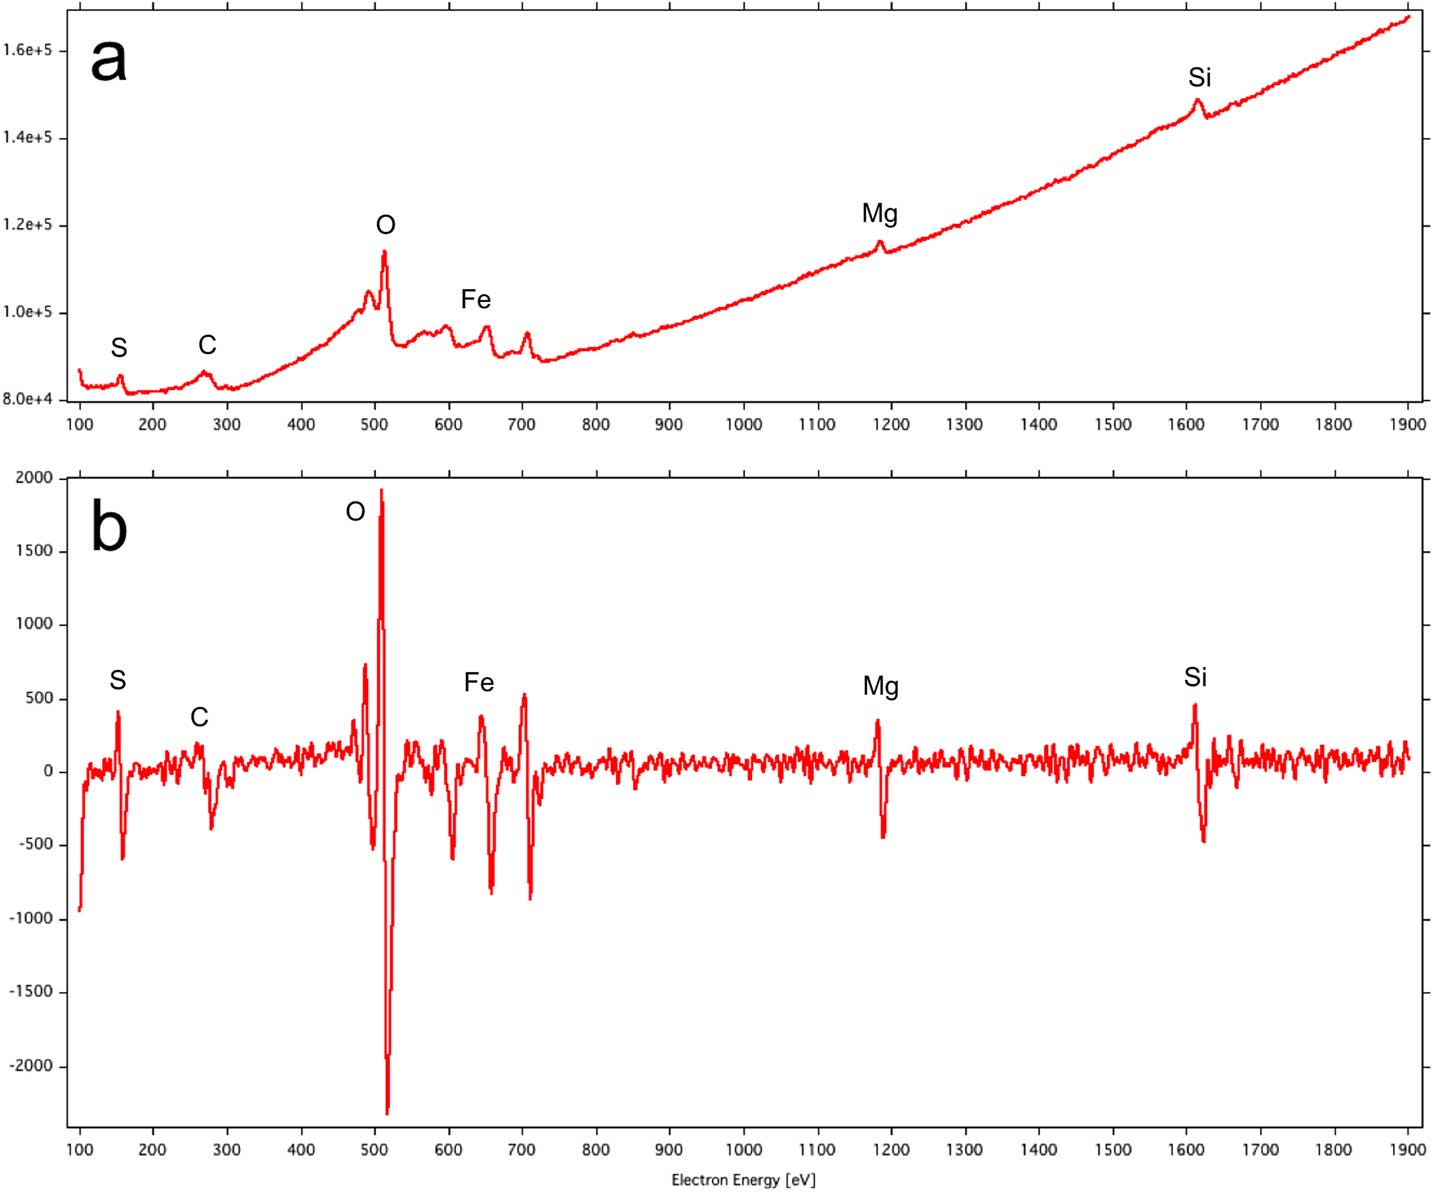
Figure 4 Auger electron energy spectrum of a presolar silicate grain from the carbonaceous chondrite Miller Range 07687: (a) direct spectrum with Auger intensities superimposed on a background of secondary and backscattered electrons; (b) derivative spectrum from which the Auger intensities for each element can be determined from the peak-to-peak heights.
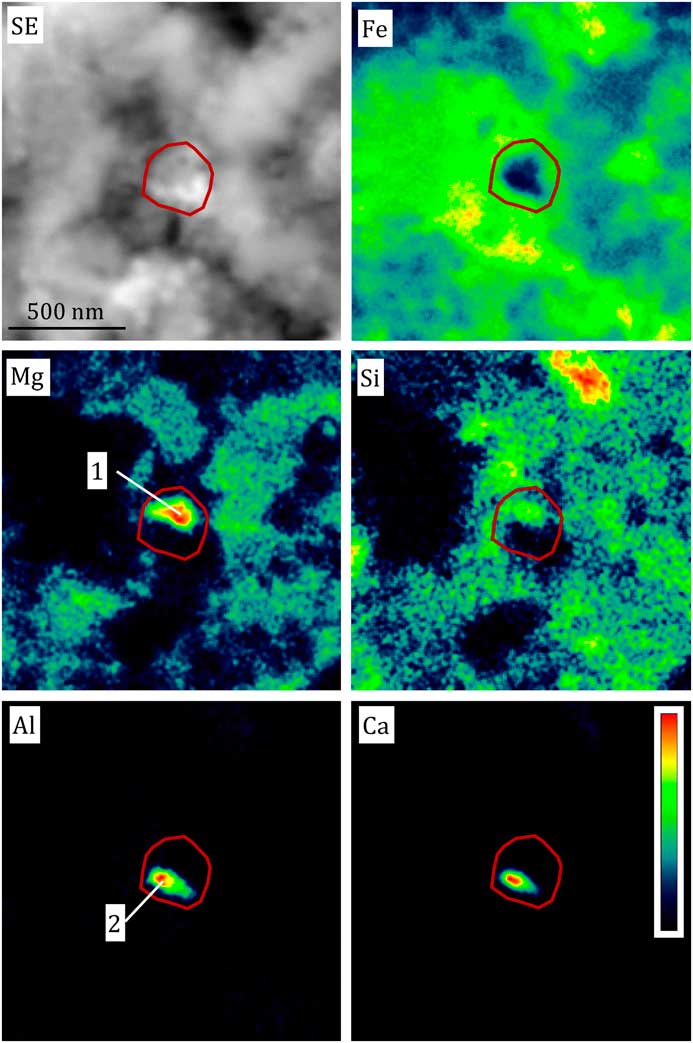
Figure 5 Secondary electron image and false color Auger elemental maps of a compound presolar grain from the carbonaceous chondrite Adelaide. The grain is outlined in red, based on the isotopic anomaly observed in the NanoSIMS raster ion images (not shown), and consists of a Mg- and Si-rich upper part (1) and an Al- and Ca-rich lower part (2). Figure adapted from [Reference Floss and Stadermann4].
A key feature of our Physical Electronics (PHI) 700 Scanning Auger Nanoprobe is that it has electron optics with coaxial primary and secondary electron paths (Figure 1b). This is accomplished through the use of a rotationally symmetrical “cylindrical mirror analyzer,” positioned around the primary electron beam column, for measuring the emitted electron energies. This is an important similarity to the NanoSIMS, which also has coaxial primary and secondary ion beams (Figure 1). Because SIMS is a sputtering technique, the measurement of geologically complex samples, like the meteorites we analyze, results in topographical variations because different phases sputter at different rates. Since our Auger instrument has coaxial electron optics, like the NanoSIMS, both instruments view the sample from the same relative point of view without geometrical distortions. This allows the precise alignment of images from the two instruments, which is necessary to obtain correlated isotopic and elemental information on these very small presolar grains, most of which are less than 500 nm in diameter. Image alignment is accomplished by comparing secondary electron images from the two instruments using custom-written software.
As noted above, sample charging is an important issue in the analysis of geological samples. Several factors in our application of Auger spectroscopy have fortuitously combined to mitigate sample charging issues in most of our analyses. Because the grains we are measuring are very small, less than the electron penetration range at typical primary beam energies [Reference Goldstein5], most of the electrical charge is actually deposited in the more conductive C-rich regions outside the grains of interest [Reference Stadermann2]. Most of the samples in which presolar grains are found contain enough carbonaceous matter to act as a conductor in these samples. In addition, the thin sections that we analyze, in fact, do need to be carbon-coated for the NanoSIMS analyses. This carbon coat is removed during the NanoSIMS measurements, leaving clean raster areas surrounded by material retaining the carbon-coating (Figure 2). This combination of factors ensures that sample charging generally is not a problem for the Auger analysis of these grains.
Results
The isotopic composition of a presolar grain provides information about its stellar origin [Reference Nitter6], but additional elemental information from Auger spectroscopy is useful in understanding the conditions under which a grain condensed and is necessary for comparison with astronomical data [Reference Henning7]. This is particularly true for silicates because of the large number of compositionally and structurally distinct entities in this class of minerals [Reference Deere8].
The elemental information obtained from Auger spectroscopy provides an overview of the diversity of the presolar silicate grain population. Auger analyses of the elements in over 40 presolar grains found in the carbonaceous chondrite meteorite Adelaide are given in [Reference Floss and Stadermann4]. In addition to single-phase grains, compound grains that consist of more than one distinct phase have also been found. In some cases these grains may consist of aggregates containing both silicate and oxide grains [Reference Floss and Stadermann4]. Figure 5 shows an example of such a grain, which consists of a Mg- and Si-rich upper part and an Al- and Ca-rich lower part. Compound grains consisting of compositionally diverse silicate grains have also been identified [Reference Bose9].
Discussion
Compositions of presolar grains
Over the last ten years more than 400 O-rich presolar grains have been measured by Auger spectroscopy. Some of these grains (~50) have been oxides, phases such as wìstite [Reference Floss10], magnetite [Reference Zega11], and silica (SiO2) [Reference Bose9, Reference Floss and Stadermann12 – Reference Haenecour13]. However, the majority of the grains are ferromagnesian silicates. Figure 6 shows the distribution of compositions based on the ratios of the cations Fe, Mg, and Ca, relative to Si. This ratio is 1 for pyroxene and 2 for olivine. Roughly 40% of the grains have stoichiometries consistent with either olivine or pyroxene. Ca-, Na-, and Al-bearing silicates such as melilite and feldspar do not appear to be present in the presolar silicate population. A large fraction of the grains, moreover, have non-stoichiometric compositions that do not correspond to any known minerals: 10% of the grains are more Si-rich than pyroxene, 20% are more Si-poor than olivine, and 28% have compositions that are intermediate between olivine and pyroxene.
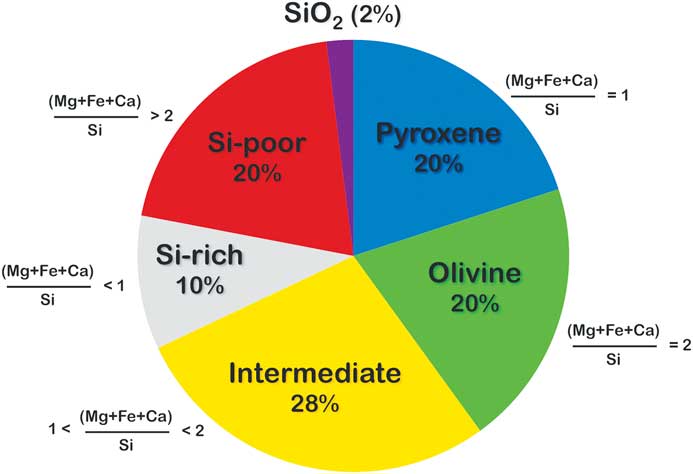
Figure 6 Distribution of elemental compositions in >400 presolar silicate grains, from a number of primitive meteorites, measured by Auger spectroscopy. Pyroxene = 1.0 ± 0.1; olivine = 2.0 ± 0.3. Data sources: [Reference Bose9, Reference Floss and Stadermann12–Reference Zhao17].
High Fe contents
Another observation arising from our Auger measurements of presolar silicates is that most of these grains have high (and highly variable) abundances of Fe (Figure 7). Iron contents range from 0 at% up to almost 50 at%, with median Fe contents of 12–14 at%. The high Fe abundances observed in many of the grains were unanticipated because equilibrium condensation calculations predict the formation of Mg-rich silicates, such as enstatite and forsterite [Reference Lodders and Fegley18]. Although secondary alteration can enhance Fe contents, and appears to have played a role in some meteorites (see below), most of the meteorites with high presolar silicate abundances show little evidence of alteration, suggesting that much of the Fe is primary.
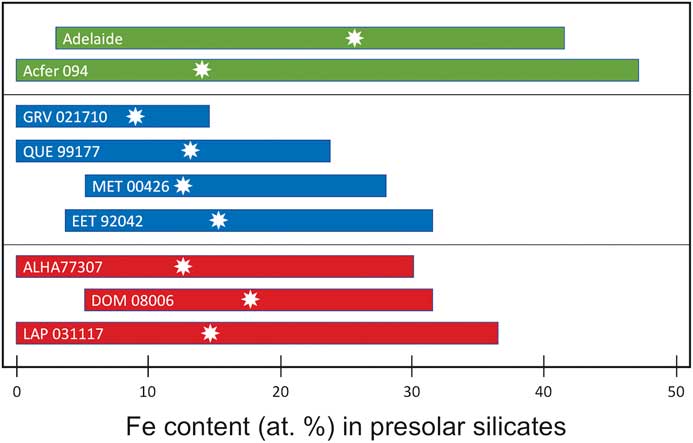
Figure 7 Range of Fe contents (at%) in presolar silicates from three different classes of carbonaceous chondrites. The white stars indicate the median Fe content of presolar silicate grains from that meteorite. Figure adapted from [Reference Floss and Haenecour3].
Models of grain growth indicate that significantly higher amounts of Fe can be incorporated under kinetic or non-equilibrium conditions than during equilibrium condensation. Thus, together with the fact that the majority of presolar silicate grains have non-stoichiometric compositions (Figure 6), this suggests that many, if not most, presolar silicates condensed under non-equilibrium conditions in the stellar envelopes where they formed. Indeed, as discussed below, this is consistent with the types of stars these grains are thought to come from based on their O isotopic compositions.
Stellar sources of the grains
The majority of O-rich presolar grains belong to one of two groups. Grains that exhibit enrichments in 17O, with 18O/16O ratios that are close to the solar system value are thought to originate in low-mass evolved stars, such as red giant or asymptotic giant branch (AGB) stars. Modeling work on the formation of dust in such evolved stars indicates that most silicate dust forms during short high mass-loss episodes that occur after thermal pulses in thermally pulsing AGB stars [Reference Gail19]. The stellar environment during these episodes is highly variable, with strong stellar winds and large temperature variations, consistent with the observations from presolar silicate grains. A second group of grains, those that are enriched in 18O, probably have origins in supernovae. Dust formation in supernovae takes place in the ejecta after the star experiences core collapse and explodes. This is also an environment that is very unstable and rapidly changing, consistent with what is observed in the grains.
New types of presolar grains
Auger spectroscopy has also led to the discovery of new types of presolar grains. In some cases this has confirmed astronomical observations suggesting their presence in stellar outflows. For example, infrared spectra of AGB stars have suggested the presence of silica [Reference Sloan20], despite the fact that this mineral is not expected to condense in stellar environments [Reference Lodders and Fegley18]. Observations of supernova remnants have also suggested the presence of SiO2 [Reference Rho21]. The identification of actual presolar silica [Reference Zega11–Reference Haenecour13, Reference Nguyen15] provides ground truth confirmation for such observations.
Adelaide presolar silicates
Finally, elemental mapping with the Auger Nanoprobe has led to insights into the effects of secondary processing on presolar grains. For example, presolar silicates from the ungrouped carbonaceous chondrite Adelaide exhibit a number of compositional features not seen in the presolar silicates from other primitive meteorites. Adelaide presolar silicates have a median Fe content that, at ~26 at%, is roughly twice as high as that observed in other carbonaceous chondrites (Figure 7). Moreover, the distribution of their compositions is starkly different from that of other presolar-silicate-bearing meteorites (Figure 8). The vast majority of the grains in Adelaide have (Fe+Mg)/Si ratios greater than the nominal value for olivine (that is, Si-poor compared to olivine). Elemental mapping of the grains in Adelaide shows that the elevated ratios are due to the infiltration of Fe into the grains (Figure 9). Matrix grains in Adelaide show evidence for recrystallization, indicating that this meteorite appears to have experienced some thermal annealing [Reference Brearley22]. This process is likely responsible for the elevated Fe contents in most of its presolar silicates, with Fe entering the grains from the surrounding Fe-rich matrix [Reference Floss and Stadermann4].
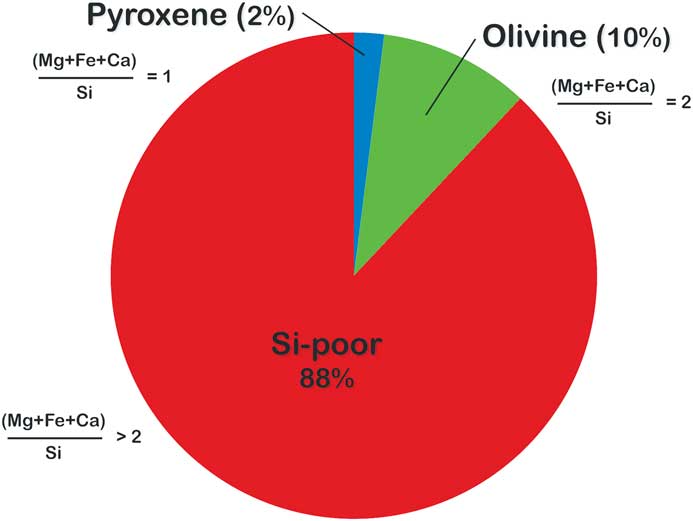
Figure 8 Distribution of elemental compositions in 42 presolar silicate grains measured by Auger spectroscopy in the carbonaceous chondrite Adelaide. Pyroxene = 1.0 ± 0.1; olivine = 2.0 ± 0.3 [Reference Floss and Stadermann4].
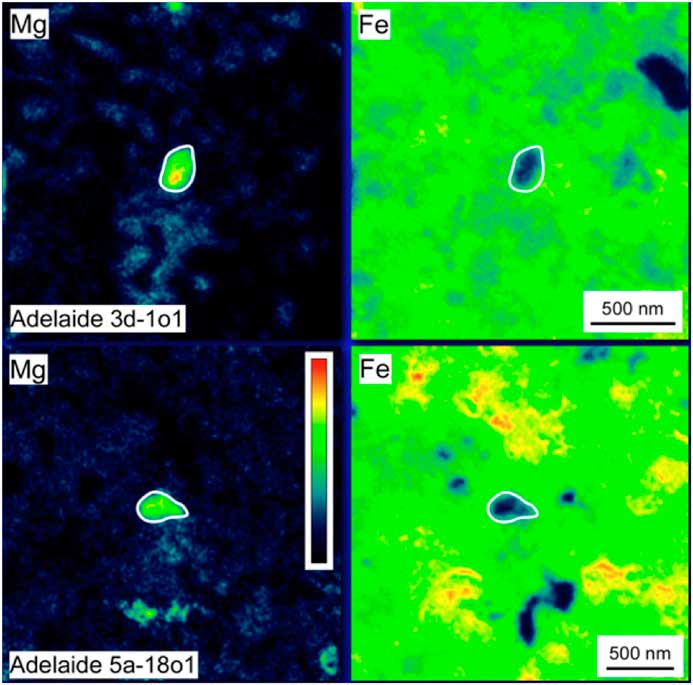
Figure 9 False color Mg and Fe Auger elemental maps of presolar silicates from the carbonaceous chondrite Adelaide. The grains, outlined in white, exhibit rims of Fe infiltrating from the surrounding Fe-rich matrix. Figure adapted from [Reference Floss and Stadermann4].
Conclusions
Auger spectroscopy has found an important application in planetary science, in the analysis of O-rich presolar grains identified by NanoSIMS. This technique is ideal for the routine characterization of these grains and has given us a good overview of the compositions of the presolar silicate population. Through this, we have a gained an understanding of the environments in which these grains formed and the effects of the secondary processing they may have experienced on their meteorite parent bodies. Auger spectroscopy has also led to the identification of interesting and unusual grains, which can be investigated further by other techniques.
Acknowledgements
This work was funded by NASA grant NNX14AG25G.


