


Introduction
Scanning probe microscopy (SPM) techniques have become a mainstay of nanoscience and nanotechnology by providing easy-to-use, gentle, structural imaging and manipulation on nanometer length scales. Beyond topographic imaging, SPMs have an extremely broad range of applications in probing electrical, magnetic, and mechanical properties. Despite impressive growth in applications, the traditional approach to SPM measurements—based on detection of cantilever response to a well-defined periodic excitation at a single frequency—has remained virtually identical for almost twenty years [Reference Binnig, Quate and Gerber1].
However, the information on tip-surface interactions that can be obtained at a single frequency is fundamentally limited, as can be illustrated by a simple example of a mass-spring, simple harmonic oscillator (SHO) model. The SHO is characterized by four independent parameters, namely the resonant frequency, amplitude and phase at resonance, and the quality-factor Q. The resonance frequency is primarily determined by the cantilever and tip-surface spring constants, that is, it provides a measure of conservative tip-surface interactions. The amplitude and phase depend on the driving force, whereas the Q-factor (or peak width) is a measure of dissipative tip-surface interactions. In conventional single-frequency measurements, a lock-in amplifier measures the amplitude and phase of the cantilever at the drive frequency. Because two independent parameters are measured, only two independent model parameters can be extracted by single-frequency detection methods, whereas four parameters are needed to uniquely determine both conservative and dissipative interactions. Furthermore, even the basic premise of this analysis, namely the cantilever behaving as a SHO, is in many cases not true. If, for example, the nonlinear interactions between the tip and sample are taken into account, the appropriate models will involve more than four parameters, exacerbating the lack of information from the single-frequency measurement.
This limitation can be overcome if the cantilever response is probed at multiple frequencies for each spatial pixel. By doing this, a segment of Fourier space, rather than a single point, can be explored. Measuring the amplitude and phase at multiple frequencies also allows unambiguous determination of SHO and more complex model parameters. A number of approaches for multiple frequency measurements have been developed using the ring-down response to pulse excitation [Reference Proksch and Dahlberg2], dual frequency measurements [Reference Rodriguez, Callahan and Kalinin3], fast lock-in sweeps [Reference Kos and Hurley4], intermodulation microscopy [Reference Platz, Tholen and Pesen5], and rapid multifrequency imaging [Reference Nath, Chu, Polomoff, Ramesh and Huey6]. Here, we discuss the recently commercialized Band Excitation (BE) method as applied to acoustic, electromechanical, and magnetic imaging [Reference Jesse, Kalinin and Proksch7]. Band Excitation is available exclusively on The Cypher and MFP-3D Atomic Force Microscopes from Asylum Research.
Principles of Band Excitation
The BE approach provides an alternative to single-frequency and frequency-sweep methods by exciting and detecting response at all frequencies simultaneously. The process is outlined below in Figure 1. The probe is excited using a synthesized digital signal that spans a continuous band of frequencies, and the response is monitored within the same or a larger frequency band. The excitation can be mechanical, optical, electric, or magnetic, mirroring classical SPM techniques. The cantilever response is detected using high-speed data-acquisition hardware and is subsequently Fourier transformed. The resulting amplitude vs. frequency and phase vs. frequency curves are collected at each point and stored in 3D data arrays (x, y, and amplitude and x, y and phase). These data are analyzed to extract the relevant parameters of the cantilever behavior. For example, in the SHO approximation, the resonance frequencies, response amplitude, and Q-factors are fitted from the measured amplitude and phase curves and stored as images.
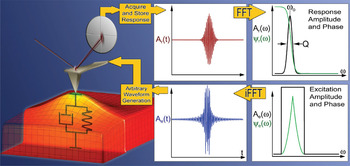
Figure 1: Principle of BE SPM. The excitation signal is digitally synthesized to have a predefined amplitude and phase in a given frequency window. The cantilever response is detected and Fourier transformed at each pixel in an image. The ratio of the fast Fourier transforms of the response and excitation signals yields the cantilever response (sometimes also called the “transfer function”). Fitting the response to the simple harmonic oscillator yields amplitude, phase, resonance frequency, and Q-factor, plotted as 2D images or used as feedback signals.
In addition to returning information on various sample properties, the acquired amplitude and phase data can be used during scanning to modify the data-acquisition process. One example can be an adaptive Band Excitation, as implemented on Asylum Research AFMs, where the sampled frequency range is continuously adjusted to track a moving resonance.
BE Piezoresponse Force Microscopy
Originally, the BE method was developed in the context of piezoresponse force microscopy (PFM) [Reference Jesse, Kalinin and Proksch7, Reference Proksch and Kalinin8]. PFM is based on the detection of the minute strains generated in solids responding to an electric bias applied to the tip. In the last 15 years, PFM has become the primary method for probing ferroelectric and multiferroic materials and devices, biological and polymer materials, and, more recently, energy storage and conversion materials. In PFM, the lack of a well-defined relationship between the phase of the response and proximity to the resonance has precluded the use of standard frequency tracking methods, while the strong dependence of contact resonance frequency on topography has resulted in unacceptably high topographic cross-talk in high-frequency imaging [Reference Jesse, Kalinin and Proksch7]. Because of these consid-erations, PFM is a good method to illustrate the advantages of BE operation.
Figure 2 shows an example of BE response, that is, amplitude and phase (Figure 2a) vs. frequency curves acquired at a single spatial location. This response improves on the amplitude and phase at a single frequency in constant frequency SPM and can be acquired at comparable rates. In single-frequency SPMs, the pixel acquisition time is ~3 to 10 ms, corresponding to ~300 oscillation cycles of a periodic excitation at ~100 kHz. With the BE approach, these oscillations have slightly differing frequencies, allowing the sampling of a segment of Fourier space without significant loss of signal level. Figures 2b and 2c show the amplitude and phase, respectively, along a single line scan, giving rise to the 2D amplitude and phase spectrograms. The data in Figure 2d show the evolution of the response across a grain boundary in a polycrystalline ferroelectric ceramic. Note that the contact resonance frequency (corresponding to the maximum in the amplitude spectrogram) changes very significantly across the sample surface, reflecting the changes in the surface topography and elastic properties of the surface. At the same time, the maximal amplitude, that is, the measure of the local polarization within the material, is much more uniform. The phase spectrogram shows a jump of 180 degrees across the grain boundary, evidencing the antiparallel orientation of ferroelectric domains in the adjacent grains. There are two significant things to note from this example: (i) a constant frequency measurement along the same line scan would provide strong crosstalk between the amplitude and phase due to the resonant frequency shift, and (ii) if the constant frequency were chosen to be far from resonance to minimize crosstalk, the signal level would be smaller by a factor of ~100, necessitating progressively longer data-acquisition times or yielding a much noisier data set.
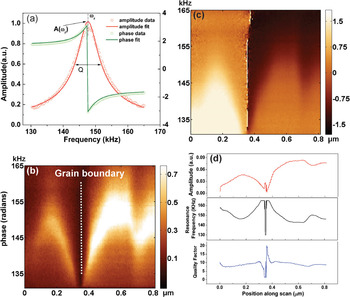
Figure 2: (a) BE amplitude and phase response at a single spatial location and a fit by the simple harmonic oscillator model. 2D BE (b) Amplitude and (c) phase vs. frequency and location profiles, analogous to line profiles in single-frequency SPM. In contrast to a line profile, the amplitude and phase as a function of frequency (vertical axis) are represented by a color scale. (d) Amplitude, resonant frequency, and phase across the interface extracted from data in (b) and (c).
Band Excitation PFM imaging is illustrated for a ferroelectric nanoparticle in Figure 3. Surface topography, electromechanical response amplitude, and phase provide information on the morphology of the nanoparticle and the ferroelectric domain structure—information similar to that provided by standard single-frequency PFM. However, for BE PFM there is almost complete absence of cross-talk between the topography and PFM signals, even on extremely rough surfaces. The resonance frequency image in Figure 3d is dominated by topographic features and (presumably) variations of elastic properties between the nanoparticle and substrate, providing information similar to atomic force acoustic microscopy (AFAM) [Reference Rabe and Arnold9]. Note the AFAM signal is independent of PFM, that is, these two channels of information on materials properties are now decoupled. The Q factor image (Figure 3e) provides information on mechanical and electromechanical dissipation at the tip-surface junction, as well as the error map of the SHO fit. Finally, the phase image at a constant frequency in Figure 3f illustrates large spurious phase changes unrelated to domain structure and controlled by surface topography.
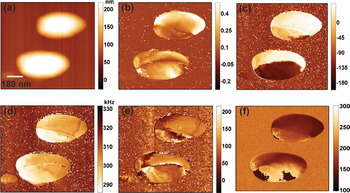
Figure 3: (a) Surface topography, (b) resonant amplitude, (c) phase, (d) resonant frequency, (e) quality factor, and (f) phase map (single-frequency PFM) for BiFeO3 nanoparticle on (LaxSr1–x)MnO3 substrate. Imaging by R. Vasudevan (University of New South Wales, Australia) and A. Kumar (ORNL). Sample courtesy P.A. Joy and H.S. Potrar, HSP/ PAJ, NLL, India.
Mechanical Property Measurements in Polymers
The capability of BE to map local elastic and dissipative properties of materials allows it to be effectively used for data acquisition in the AFAM mode. In AFAM, the sample is excited mechanically, and the amplitude and phase of vibrations transferred to the cantilever provide a measure of the elastic properties of the material surface. In BE AFAM, the measured full amplitude-frequency curve allows both elastic properties and dissipation to be mapped quantitatively.
Figure 4 illustrates BE AFAM mapping of a cryo-microtomed sample consisting of polystyrene (PS) spheres suspended in a polypropylene (PP) matrix. The amplitude image in Figure 4b is relatively featureless, consistent with uniform driving by the sample actuator. The resonant frequency (Figure 4c) signal illustrates relatively weak changes in contact resonant frequency, as is expected because of the similar storage (conservative) moduli for the two materials (E′ ~ 2.4 × 10⁹ N/m2 for PS and E′ ~ 2.8 × 10⁹ N/m2 for PP where these values were calculated at room temperature, 250 kHz [near the cantilever contact resonance] using time-temperature superposition from 1 Hz dynamic mechanical tensile analyzer (DMTA) measurements). However, the quality factor image (Figure 4d) shows very strong contrast, consistent with the relative large difference in the loss (dissipative) moduli of the two materials (E″ ~ 5 × 10⁷ N/m2 for PS and E″ ~ 1.4 × 10⁸ N/m2 for PP where these values were calculated at room temperature, 250 kHz [near the cantilever contact resonance] using time-temperature superposition from 1 Hz DMTA measurements). Finally, in both the frequency and quality factor images, small-scale features attributable to topographic crosstalk between the contact area and mechanical properties are clearly seen.
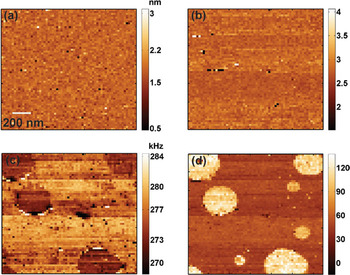
Figure 4: (a) Surface topography, (b) resonant amplitude, (c) resonant frequency, and (d) quality factor for contact resonance (AFAM) microscopy performed on polystyrene spheres suspended in a polypropylene matrix. Model sample blends of PS/PP and bulk moduli values courtesy of Dalia Yablon and Andy Tsou, ExxonMobil Research and Engineering.
Future Perspectives—BE and BEyond
The BE method also allows novel applications of SPM well beyond classical data acquisition. For systems with strongly non-linear responses, the peak shape can be analyzed to yield quantitative information about local nonlinearities [Reference Nayfeh10]. In cases where the analytical theory is unavailable, the signal can be identified and analyzed using multivariate statistics and artificial intelligence methods, giving rise to recognition imaging microscopy based on “fingerprinting” relevant materials behavior. This approach was demonstrated recently for bacterial identification [Reference Nikiforov, Vertegel, Reukov, Thompson, Kalinin and Jesse11]. Finally, BE can be used for local spectroscopic methods, in which local response is probed as a function of electric potential, temperature, or time, giving rise to multidimensional spectroscopic SPM methods probing dynamic, rather than static, materials functionality [Reference Kalinin, Morozovska, Chen and Rodriguez12].
Conclusions
The BE method described here is a universal data-acquisition method that can be broadly applied to virtually all ambient and liquid SPM methods. Compared to single-frequency SPM, BE allows unambiguous decoupling of the conservative and dissipative interactions, removing topographic cross-talk and allowing identification of non-linear responses. BE can be universally applied to all ambient and liquid SPM modes, as well as many ultra-high vacuum methods.
Acknowledgments
Research is supported by the ORNL SEED program (SVK and SJ) and conducted at the Center for Nanophase Materials Sciences (CNMS), which is sponsored at Oak Ridge National Laboratory by the Division of Scientific User Facilities, U.S. Department of Energy. Band excitation PFM and other SPM modes are available as a part of the user program at the CNMS, www.cnms.ornl.gov.


