
Figure Al. Household inflation expectations for the year ahead are stable

Figure A2. Private and public sector nominal wage growth


Figure A3. Goods exports volumes to the EU have just regained pre-recession levels

Figure A4. Per capita consumer spending is expected to reach its pre–recession peak in 2020 (2007Q4=100)


Figure A5. Household income gearing

Figure A6. We expect households' propensity to save to rise over the medium term (per cent of gross disposable incomes)


Figure A7. Productivity in the UK remains around pre-recession levels

Figure A8. National saving is not expected to recover pre–crisis levels over our forecast horizon (per cent of GDP)
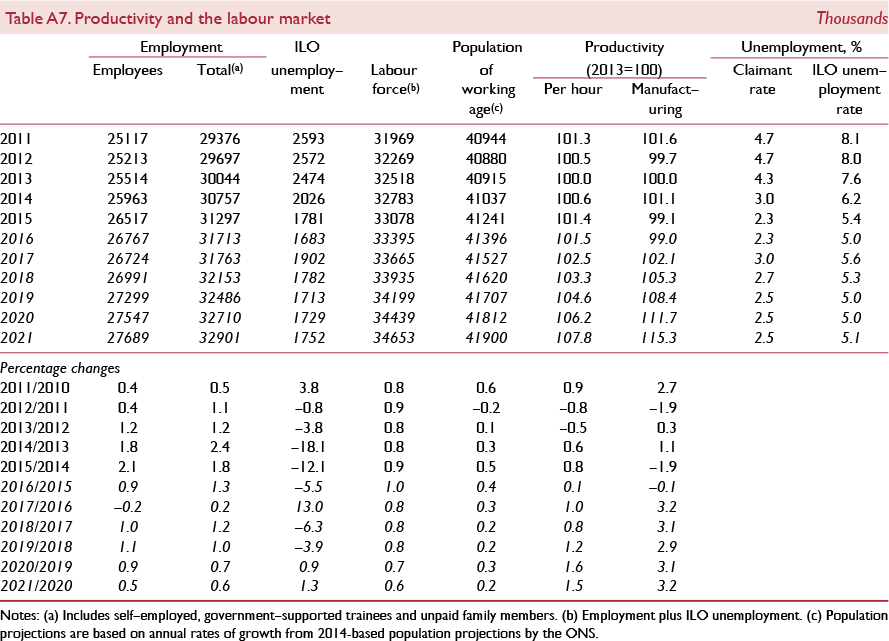

Figure A9. In 2016Q2 GDP was 7.7 per cent higher than its pre-crisis peak and employment is estimated to be 7 per cent higher

Figure A10. The Beveridge curve suggests continued improvement in the labour market matching process