


1 Introduction
If stories are the engines of political identity and collective action, then the best politicians will also be the best storytellers (Patterson and Monroe Reference Patterson and Monroe1998). Motivated by such ideas, and building on the well-established work in psychology on how narratives shape human perceptions and constructions of social reality (Armstrong Reference Armstrong2020; Bruner Reference Bruner1991; Polkinghorne Reference Polkinghorne1988; White Reference White1980), an expanding social-science literature has begun to attend to how narratives drive political, social, and economic outcomes (Bénabou, Falk, and Tirole Reference Bénabou, Falk and Tirole2018; Branch, McGough, and Zhu Reference Branch, McGough and Zhu2022; Eliaz and Spiegler Reference Eliaz and Spiegler2020; Kuhle Reference Kuhle2020). Across disciplines, there is a growing recognition that narratives play a fundamental role in both individual and collective decision-making (Akerlof and Shiller Reference Akerlof and Shiller2010; Shiller Reference Shiller2019). Hence, both science and policy would benefit from a better understanding of how narratives form, spread, and influence behavior.
Nonetheless, quantitative analysis of narratives is still largely unexplored (Shiller Reference Shiller2019). A principal impediment to the production of such evidence is the challenge of measuring narratives in written or spoken texts. In particular, such a measure must capture relationships between entities—characters, concepts, organizations, or objects (e.g., Sloman Reference Sloman2005). The existing text-as-data approaches in social science do not account for these relationships (Gentzkow, Kelly, and Taddy Reference Gentzkow, Kelly and Taddy2019; Grimmer and Stewart Reference Grimmer and Stewart2013). This paper describes a new method that satisfies this requirement—by identifying who does what to whom, and by mapping the relationships and interactions among entities in a corpus. The accompanying open-source package, relatio, allows researchers to measure interpretable narratives from plain text-documents. These narratives can be used as inputs in empirical social science analysis.Footnote 1
The starting point of the narrative mining method is semantic role labeling (SRL), a linguistic algorithm that takes in a plain-text sentence and identifies the action, the agent performing that action, and the patient being acted upon. The resulting feature space of agents, actions, and patients is much more informative about narratives than the feature space generated by standard text-as-data methods. Yet, that space is too high-dimensional to be useful for most narrative analyses. Hence, the next part of our narrative mining method is a set of dimensionality reduction procedures. Our entity clustering approach takes the multiple phrase variants referring to the same entity (e.g., “taxes on income” and “income taxation,” or “Former President Reagan” and “Ronald Reagan”) and resolves them into a single entity label.
We demonstrate the usefulness of the method in an application to speeches in the U.S. Congress (1994–2015). The set of extracted entities is interpretable and includes key actors in the U.S. political economy—Republicans, Democrats, the budget, terrorists, or Medicare, to name just a few. For each entity, our approach highlights what actions (i.e., verbs) connect it to other entities. For instance, we capture that “Republicans” and “Medicare” are related such that “Republicans end Medicare.” “Medicare,” in turn, is also connected to other entities, such as “Medicare provides healthcare.” Overall, the resulting narrative statements are intuitive and close to the original raw text.
The method captures salient narratives around historical events, such as the September 11th attacks and the subsequent U.S. invasion of Iraq. We find that religious invocations such as “God bless America” and “God bless the troops” increased in response to these events. Ranking narratives by relative party usage reveals articulations of partisan values: Democrats are concerned about “Americans losing unemployment benefits,” “budget cuts to Medicare,” and “oil companies making profits.” Republicans want “Americans to keep their money,” decry “government control of healthcare,” and affirm that “Americans rely on oil.”
Besides showing how narratives divide the parties, our approach also demonstrates how narratives connect up with each other to form a broader discourse. We propose a network-based approach to combine several narrative statements in a directed multigraph, linking up entities with their associated actions. The resulting narrative networks form a visual expression of political worldviews, establishing rich context for qualitative researchers. Further, applying node centrality and graph distance measures to these networks could help illuminate new dimensions of narrative discourse.
The paper concludes with a discussion of how narrative mining fits in with other text-as-data methods. The narrative statements produced by relatio are often more informative and interpretable than bag-of-words or n-gram representations of text documents. Finally, we discuss our method’s limitations along with opportunities for improvement and extension.
2 Method: Mining Narratives from Plain Text Corpora
According to the Oxford English Dictionary, a narrative is an “account of a series of events, facts, etc., given in order and with the establishing of connections between them.” In a leading framework from social psychology, narratives are similarly defined as sets of relationships between entities that act on each other (Sloman Reference Sloman2005). In human language, such relationships are established through grammatical statements describing actors, actions, and the acted-upon.
This distinctive relational aspect of narratives is missing from the standard text-as-data-tools in social science. Dictionary methods rely on matching particular words or phrases (Baker, Bloom, and Davis Reference Baker, Bloom and Davis2016; Enke Reference Enke2020; Shiller Reference Shiller2019). Unsupervised learning methods such as topic models and document embeddings break sentences down into words or phrases and ignore grammatical information (Bybee et al. Reference Bybee, Kelly, Manela and Xiu2020; Hansen, McMahon, and Prat Reference Hansen, McMahon and Prat2017). These previous methods recover information on mentioned entities and mentioned actions, but without connecting them. This section outlines our method for uncovering the recurring relationships established between latent entities and actions in a corpus.
2.1 Semantic Roles as Narrative Building Blocks
Semantic role labeling is a computational-linguistics algorithm that answers basic questions about the meaning of written sentences—in particular, who is doing what to whom.Footnote 2 The agent (“who”) is the actor in an event—for example, the grammatical subject of the verb in an active clause. The verb (“what”) captures the action in the clause. The patient (“whom”) is the entity that is affected by the action—that is, the object or the target.Footnote 3 For example, in the sentence “Millions of Americans lost their unemployment benefits,” “Millions of Americans” is the agent, “lost” the verb, and “their unemployment benefits” the patient.Footnote 4

Figure 1 Examples of semantic role labeling annotations. Examples of semantic role annotations based on allennlp’s programmatic implementation (Gardner et al. Reference Gardner2017). See https://demo.allennlp.org/semantic-role-labeling for additional examples. ARG0 refers to the agent, V to the verb, and ARG1 to the patient. The last example shows additional semantic roles, modality (ARGM-MOD), negation (ARGM-NEG), and temporality (ARGM-TMP). Our implementation considers negations (ARGM-NEG). While not further discussed here, it also allows for modal indicators (but not yet for temporality).
Not only do semantic roles differentiate actions and entities within a sentence, but they also map the relationships between them. For example, SRL would extract the same directional relation for “Millions of Americans lost their unemployment benefits” as the inverted sentence “Unemployment benefits were lost by millions of Americans.” In some cases, the directions of actions contain pivotal information to understand the narrative.Footnote 5 This robustness to word ordering is an important feature of SRL relative to other approaches in natural language processing, such as topic models, which ignore semantic relations in the sentence.
We show additional example sentences, with semantic role annotations, in Figure 1. These examples come from the state-of-the-art model implemented by AllenNLP (Gardner et al. Reference Gardner2017), used in the empirical application below. The sentences illustrate the flexibility of SRL in capturing variation in sentence content and word order. For example, the agent and patient can both be at the beginning or end of the sentence. Further, while all complete sentences in English have a verb, some sentences lack an agent, patient, or both.Footnote 6 A number of additional semantic features, such as modality, negations, and temporal content, are labeled as well.
Our model of language is based on the information contained in semantic roles. Formally, define $\mathcal {A}_0$
,
$\mathcal {A}_0$
, $\mathcal {V}$
, and
$\mathcal {V}$
, and $\mathcal {A}_1$
as the sets of phrases, respectively, annotated as agents, verbs, and patients. A sentence can be decomposed into a sequence of semantic roles:
$\mathcal {A}_1$
as the sets of phrases, respectively, annotated as agents, verbs, and patients. A sentence can be decomposed into a sequence of semantic roles:
For example, our previously discussed sentence would be represented as
 $$ \begin{align*} \text{Millions of Americans} \xrightarrow{\text{ lost }} \text{their unemployment benefits.} \end{align*} $$
Negation is encoded as a modification of the verb. For example, “did not lose” is replaced with the verb “not-lost.” So, a similar statement with a negation would be represented as
 $$ \begin{align*} \text{Americans} \xrightarrow{\text{ not-lost }} \text{their unemployment benefits.} \end{align*} $$
2.2 From Semantic Roles to Interpretable Actions and Entities
Let $\mathcal {S}= \mathcal {A}_0 \times \mathcal {V} \times \mathcal {A}_1$
comprise the space of semantic roles observed in the corpus. These semantic roles capture the relationships between entities that are characteristic of narrative statements. In most real-world corpora, however,
$\mathcal {S}= \mathcal {A}_0 \times \mathcal {V} \times \mathcal {A}_1$
comprise the space of semantic roles observed in the corpus. These semantic roles capture the relationships between entities that are characteristic of narrative statements. In most real-world corpora, however, $\mathcal {S}$
is too high-dimensional for further analysis. Thus, the next step is to compress the set of actions and entities to a lower-dimensional yet sufficiently informative representation.
$\mathcal {S}$
is too high-dimensional for further analysis. Thus, the next step is to compress the set of actions and entities to a lower-dimensional yet sufficiently informative representation.
For instance, most people would agree that “Millions of Americans lost their unemployment benefits” and “Many Americans were losing their much-needed unemployment checks” refer to the same underlying narrative. In particular, “much-needed unemployment checks” and “their unemployment benefits” both refer to “unemployment benefits.” Similarly, “Many Americans” and “Millions of Americans” both refer to “Americans.” These examples illustrate that observed agents and patients are drawn from a smaller set of latent entities, E, such that $|E| \leq |\mathcal {A}_0 \cup \mathcal {A}_1|$
. Thus, our dimension reduction aims to infer these latent entities and their associated text realizations.
$|E| \leq |\mathcal {A}_0 \cup \mathcal {A}_1|$
. Thus, our dimension reduction aims to infer these latent entities and their associated text realizations.
We proceed in two steps for dimension reduction. First, we directly extract coherent entities using named entity recognition (e.g., Jurafsky and Martin Reference Jurafsky and Martin2020, Ch. 8). This algorithm automatically extracts references to specific people, organizations, events, and locations. In the second sentence from Figure 1, for example, “Saddam Hussein” is identified as a named entity. In practice, we build a vocabulary of named entities as the L most frequent named entities recognized in the corpus. If a semantic role refers to a named entity from the vocabulary, it is labeled as such. In applications, we have found that it is straight-forward to inspect the list of entities ranked by frequency and set the threshold L to balance dimensionality and interpretability. Section C of the Supplementary Material lists examples of frequent named entities.
The second step of dimension reduction, applied to the remaining agent and patient phrases that do not contain a named entity, consists of semantic clustering. These phrases usually refer to coherently separable entities or groups of entities that we would like to group together—for example, “unemployment benefits” and “unemployment checks.” Our approach for clustering the phrases associated with such entities begins with a phrase encoder, applied to compress each plain-text entity snippet to a low-dimensional dense vector. As a computationally efficient default, we use a weighted average of the word vectors across each word in the agent or patient segment (Arora, Liang, and Ma Reference Arora, Liang and Ma2016). We then apply a clustering algorithm (e.g., K-means) to the matrix of entity encodings to produce K clusters. For interpretability, each cluster can be labeled by the most frequent term within the cluster.
Unlike the selection of L for named entities, the selection of K for clustered entities is not straightforward. Entities are not clearly demarcated and the preferred level of granularity will depend on the application. For example, should “tax credit” and “tax rebate” be clustered? What about “Republicans” and “conservatives”? Hence, hyperparameter choices for clustering entity embeddings require more care. Automated cluster-quality metrics such as the silhouette score can work as a starting point. But for best results, the phrase clustering output should be produced and inspected for different K and selected based on the goals of the application.
So far, we have not discussed dimension reduction for verbs. In practice, we find that embedding-based clustering of verbs produces unreliable results, in particular, because it frequently assigns antonyms (e.g., “decrease” and “increase”) to the same cluster. In our application, the number of unique verbs is relatively small (60 times smaller than the number of unique agents and patients), so we decide not to dimension-reduce verbs. Hence, we do not make any changes to verbs, except for normalizing the verb tense and adding the “not-” prefix to negated verbs.
2.3 Narrative Statements and Narrative Structure
After dimension reduction, we obtain narratives of the form
The set $\mathcal {N} = E \times V \times E$
is the space of all potential narrative statements for a given corpus. Its dimensionality is determined by the number of unique entities and verbs. The set of entities contains named entities and clustered entities.
$\mathcal {N} = E \times V \times E$
is the space of all potential narrative statements for a given corpus. Its dimensionality is determined by the number of unique entities and verbs. The set of entities contains named entities and clustered entities.
These narratives can then provide inputs to qualitative or quantitative analysis. In the Congressional Record, for example, we will produce counts by legislator and year for each item in $\mathcal {N}$
. Such counts can be used for descriptive analysis, as variables in regressions, or as a feature set for machine-learning algorithms.
$\mathcal {N}$
. Such counts can be used for descriptive analysis, as variables in regressions, or as a feature set for machine-learning algorithms.
Moving beyond such counts, a key feature of narratives is that they embed entities and relations in a broader, enmeshed structure. Consider, for instance: “Taxes fund hospitals and hospitals save lives.” Our method represents this sentence as two separate narrative statements:
 $$\begin{align*} & \text{Taxes} \xrightarrow{\text{ fund }} \text{hospitals,} \\ & \text{hospitals} \xrightarrow{\text{ save }} \text{lives.} \end{align*}$$
It is easy and intuitive to combine these two simple narrative statements to reveal a more complex narrative chain. This broader narrative has a network structure
 $$\begin{align*} & \text{Taxes} \xrightarrow{\text{ fund }} \text{hospitals} \xrightarrow{\text{ save }} \text{lives.} \end{align*}$$
More generally, a list of simple narrative statements (as captured by Equation (2)) can be represented as a directed multigraph, in which the edges are actions and the nodes are entities. Formally, let $n \subset \mathcal {N}$
be a subset of the narrative space. Let
$n \subset \mathcal {N}$
be a subset of the narrative space. Let $e \subset E$
be the set of distinct entities in n. We define a narrative graph as a tuple (e, n), in which e represents the vertices and n represents the edges of the directed multigraph.
$e \subset E$
be the set of distinct entities in n. We define a narrative graph as a tuple (e, n), in which e represents the vertices and n represents the edges of the directed multigraph.
2.4 Open-Source Implementation
Figure 2 provides an illustrated summary of our pipeline. The input is a plain-text corpus [a], which is segmented into sentences [b]. Those sentences are the inputs to named entity recognition [c], semantic role labeling [d], and training (or fine-tuning) a phrase embedding model [e]. The outputs of that first round of operations are a set of named entities [f], annotated semantic roles [g,h], and an embedding model for vectorizing phrases [i]. After tagging named entities [j], the roles containing named entities [l] are finalized for the output. The roles without named entities [m] are vectorized using the phrase embedding model [k], and then piped to the K-means clustering model to produce clustered entities [n]. The final narrative statements [o] are built from the named entities [j], verbs [h], and clustered entities [n].
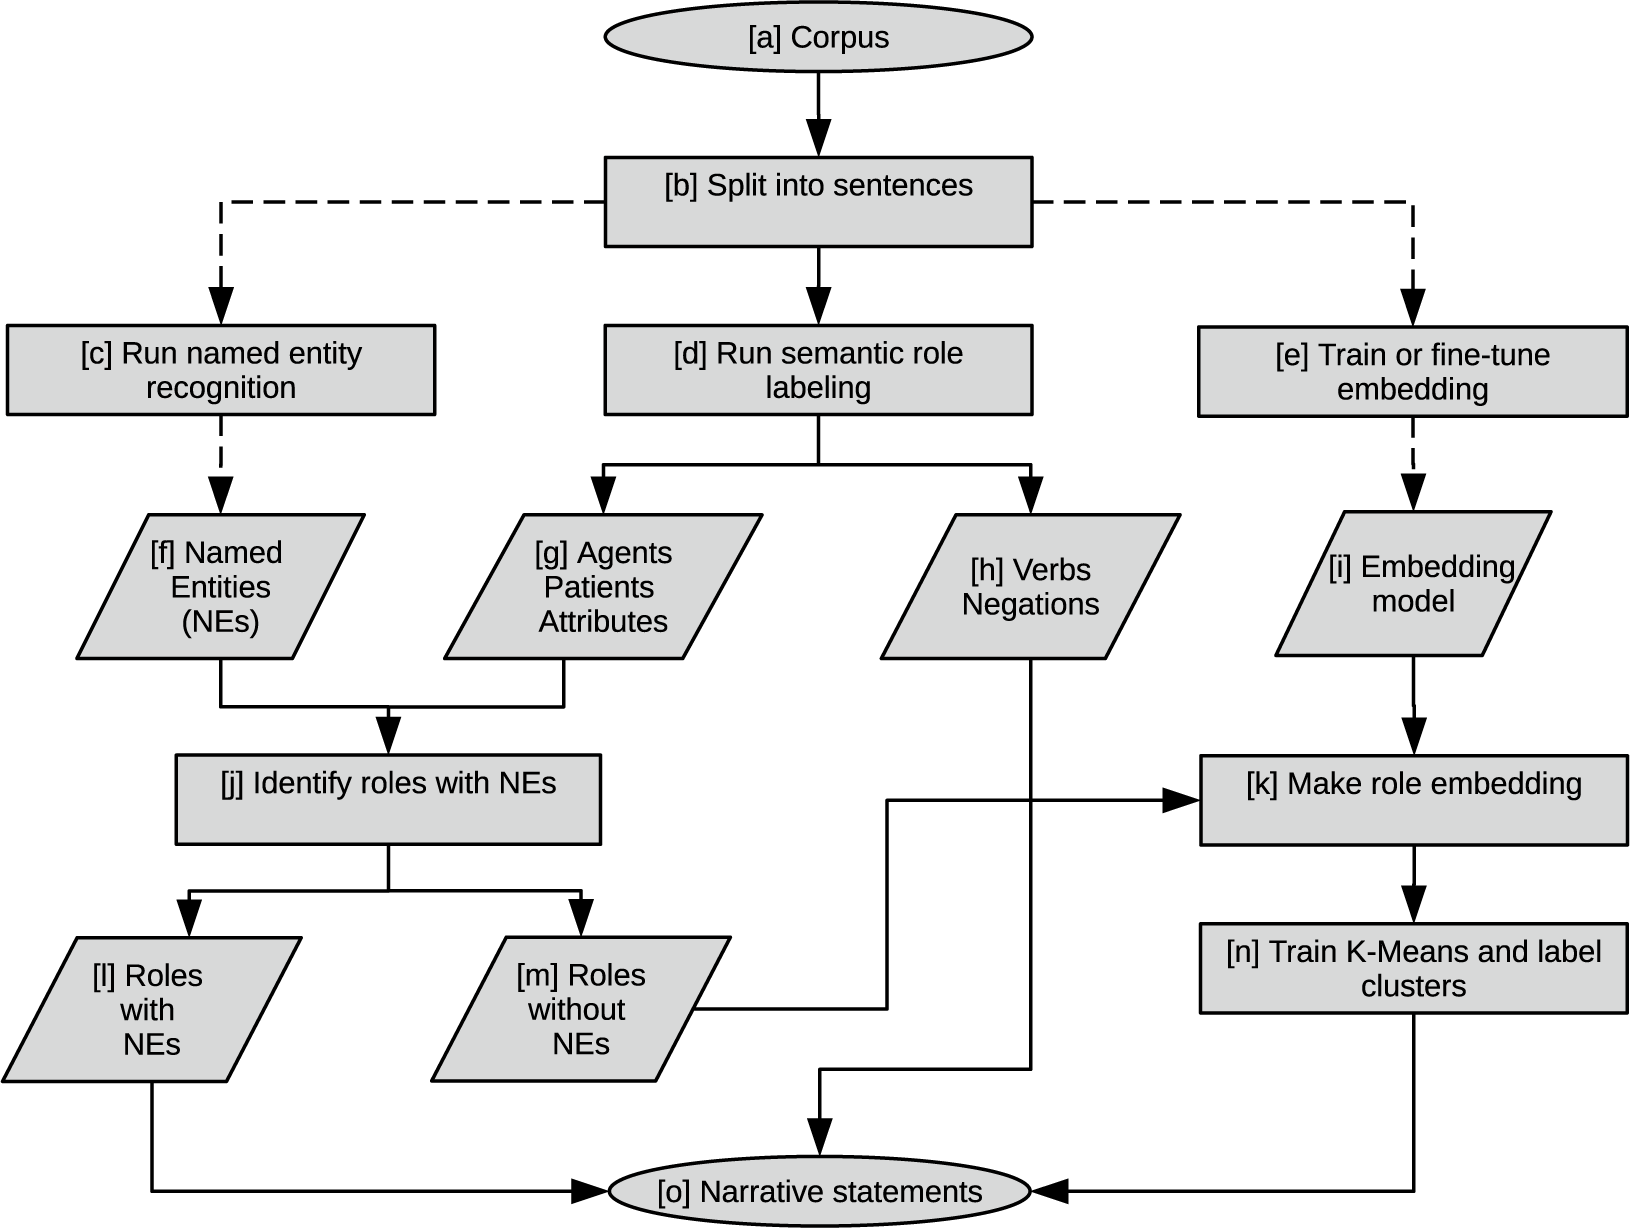
Figure 2 Flowchart for relatio. Code flowchart for programmatic implementation, open-sourced as the Python relatio package (github.com/relatio-nlp/relatio). Circles represent the start and the end of the pipeline. Rectangles represent arithmetic operations and data manipulations. Parallelograms represent inputs and outputs.
This system is automated and streamlined as part of the accompanying Python package, relatio. A baseline narrative feature set can be produced with only a few lines of code. More advanced users can customize and adapt the inputs, settings, and outputs. For more details, see Section A of the Supplementary Material or the package repository, github.com/relatio-nlp/relatio.
3 Application to the U.S. Congressional Record
To demonstrate the workings of our narrative mining method, we apply it to a large corpus of floor speeches in U.S. Congress. The application is designed to illustrate how the method can be used for qualitative and quantitative analysis in social science and digital humanities.
3.1 Implementation
3.1.1 Data
Our application uses the U.S. Congressional Record for the years 1994–2015. The Record is an exact transcript of speeches given on the floor of the House and the Senate, published in digital format since 1994 by the U.S. Government Publishing Office (GPO). It has been widely used for text-as-data applications in the social sciences (e.g., Ash, Morelli, and Van Weelden Reference Ash, Morelli and Van Weelden2017; Gennaro and Ash Reference Gennaro and Ash2021; Gentzkow, Shapiro, and Taddy Reference Gentzkow, Shapiro and Taddy2019; Lauderdale and Herzog Reference Lauderdale and Herzog2016). We link the congressional speeches to the speakers’ metadata (importantly, name and party affiliation).
3.1.2 Choice of Hyperparameters
We run our pipeline with the default settings on the entire Congressional Record. Section A of the Supplementary Material provides some additional material on how the narrative mining system is adapted to the corpus. We limit our analysis to “complete” narratives containing an agent, a verb, and a patient. After some hyperparameter tuning, we select 1,000 named entities and 1,000 clustered entities (see Section B of the Supplementary Material for details). Clustered entities are first labeled by the most frequent term, with some manual relabeling done after brief inspection.
As the distribution of narrative frequencies is heavily skewed to the left, and since we are interested in recurring narratives, we restrict our attention to narratives pronounced at least 50 times overall in the corpus (i.e., at least twice a year on average across all speakers).Footnote 7
3.1.3 Resulting Narratives
Table 1 lists the 10 most frequent narratives, after excluding sentences related to parliamentary procedure. For each narrative, we show two original sentences that the narrative represents. Section E of the Supplementary Material shows more examples of sentences of these most frequent narratives in context. The narratives are easily interpretable and semantically close to the original raw text. Thus, the approach satisfies our objective of preserving the important information of who does what to whom.
Table 1 Most frequent non-procedural narratives.

Section D of the Supplementary Material provides summary tabulations on the statements, roles, entities, actions, and narratives extracted from the Congressional Record. The dimensionality reduction is substantial, with the 17.3 million plain-text sentences in the original corpus eventually reduced to 1,638 unique narratives. Besides clustering of entities (see Section 2.2), this reduction is achieved by requiring “complete” narratives (with both an agent and a patient), by the filtering out infrequent narratives (see Section 3.1.2), and by dropping narratives containing entities that are procedural or otherwise not related to politics or policy (Section L of the Supplementary Material shows a complete list of these entities). The list of narratives, reported in full in Section K of the Supplementary Material and readable in a few minutes, provides a concise summary of political discourse in the United States.
3.2 Analysis
Now, we use our mined narratives for a descriptive analysis of discourse in U.S. Congress. Starting with Figure 3, we first show that narratives capture salient historical events and how those events are framed. Second, we show that narratives contain emotional and partisan resonance. Third, we produce narrative graphs and analyze how political discourse relates entities to one another.
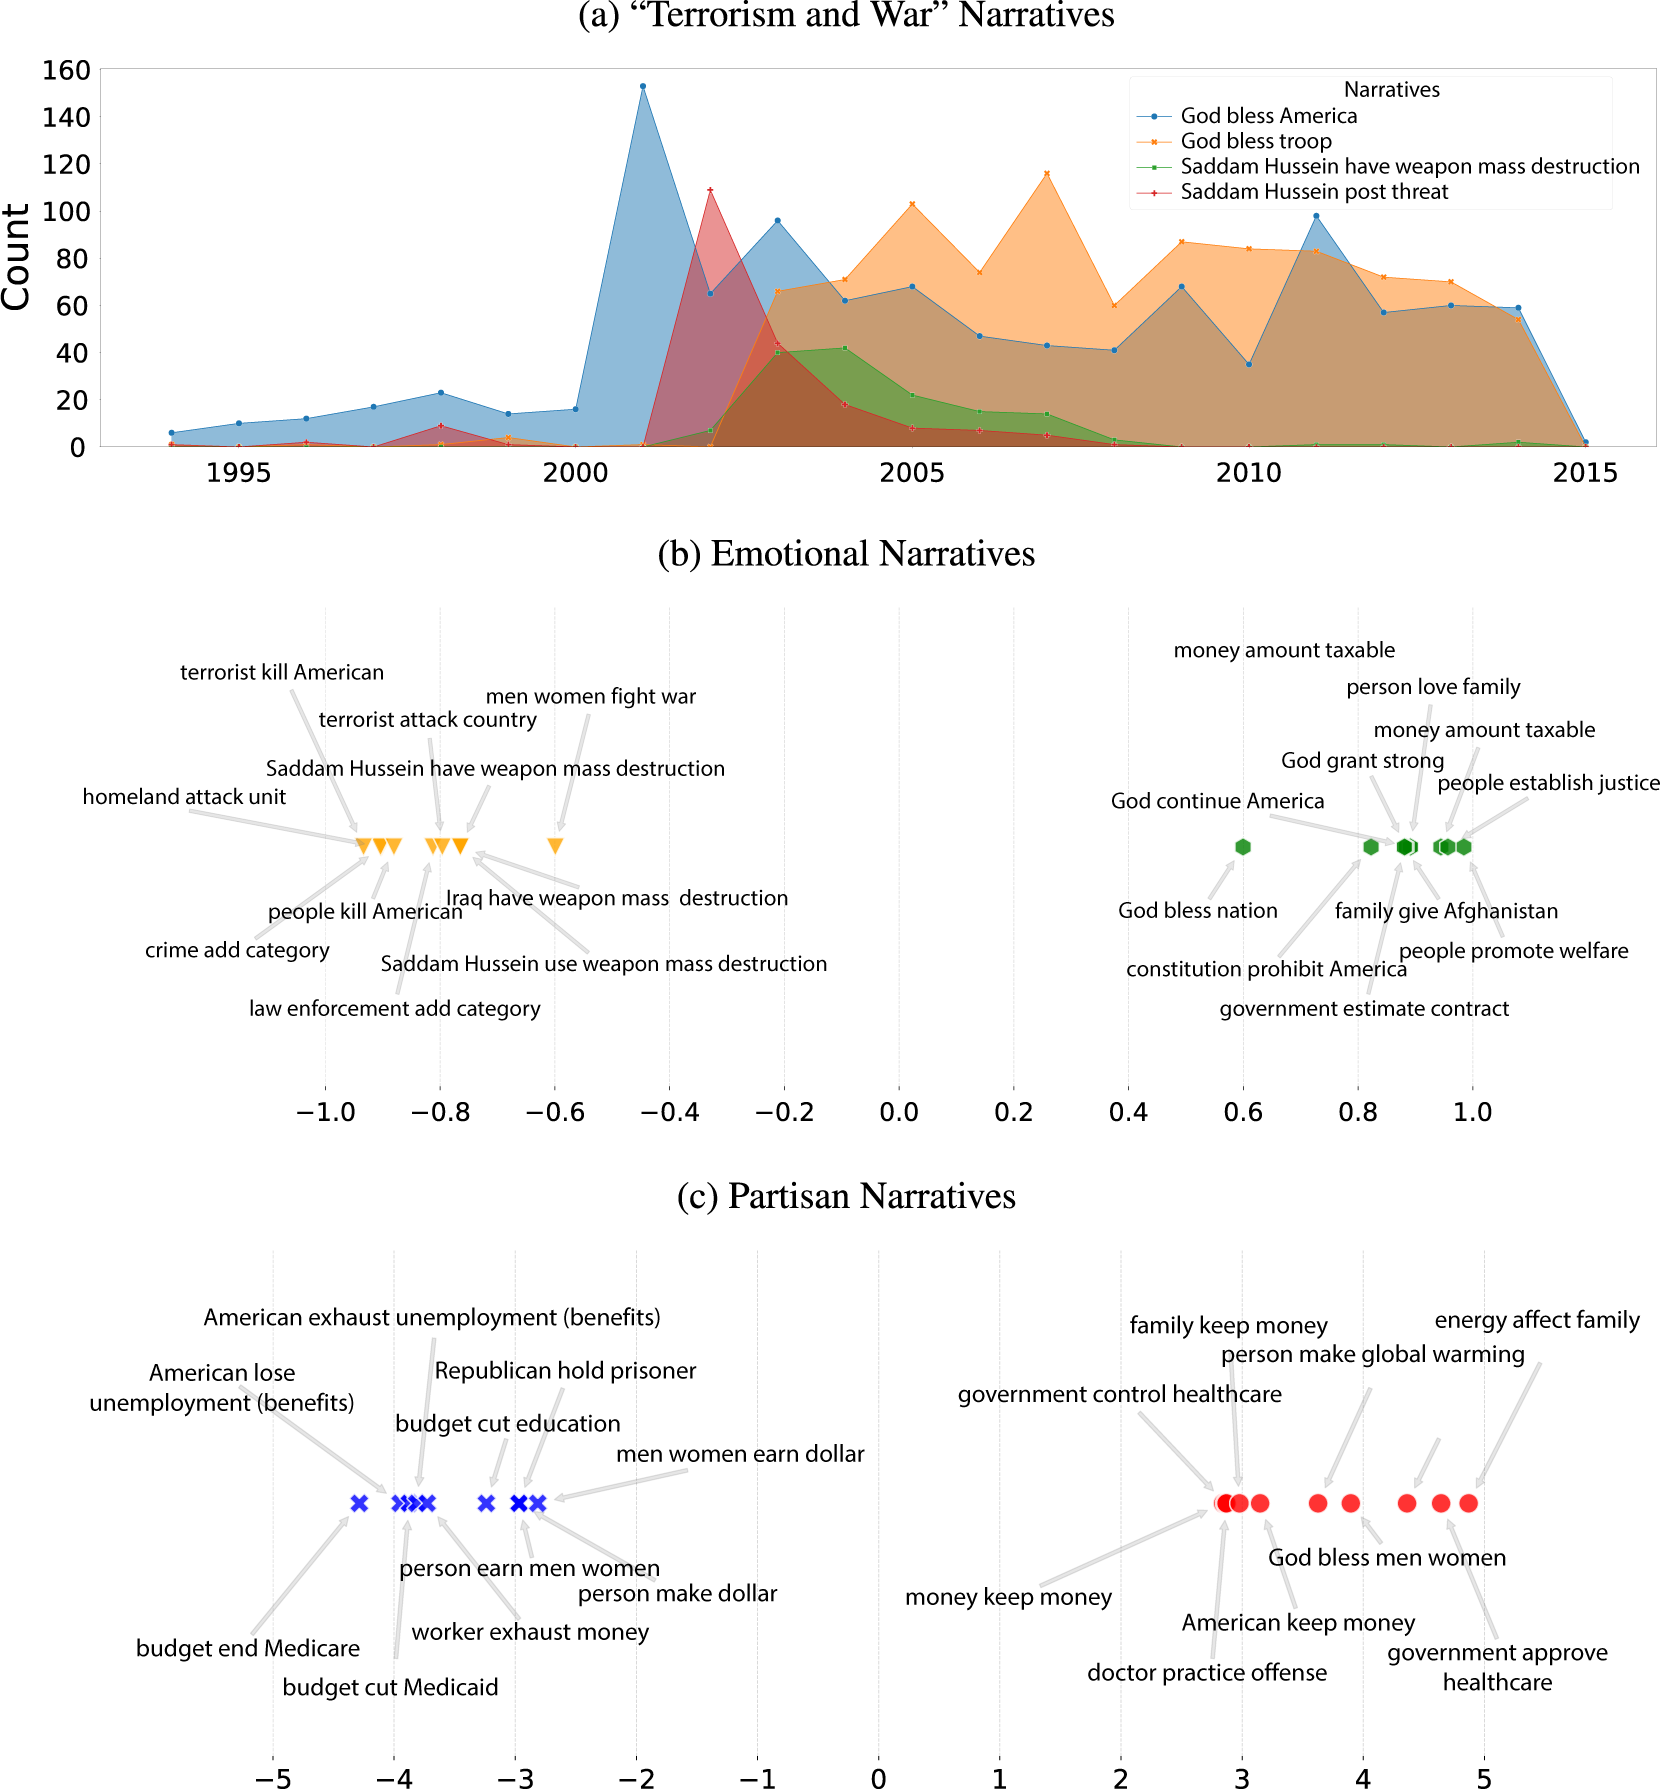
Figure 3 History, sentiment, and politics in narrative discourse. This figure shows how narratives may help researchers make sense of speeches in the U.S. Congress. To provide some historical perspective, Panel (a) presents time-series counts of a selection of prevalent narratives in the wake of the 9/11 attacks. The counted narratives are “God bless America” (blue), “God bless troop” (orange), “Saddam Hussein have weapon mass destruction” (green), and “Saddam Hussein pose threat” (red). Panels (b) and (c), respectively, plot the 20 most extreme narratives in the U.S. Congressional Record along the sentiment and partisanship dimensions. Panel (b) displays the most positive and negative narratives. The sentiment compound measure, computed using the NLTK VADER package, is averaged over all sentences in which the narrative appears. A high compound sentiment indicates positive sentiment (in green), whereas a low compound sentiment indicates negative sentiment (in orange). Panel (c) displays the most Republican and Democrat narratives. A high log-odds ratio reflects narratives pronounced more often by Republicans relative to Democrats (in red), and vice versa for a low log-odds ratio (in blue).
3.2.1 Narratives Reflect Key Events in U.S. History
A first task for which our narrative features are useful is to describe changes in discourse over time. To illustrate how dynamic shifts in narratives reflect historical events, we explore the discourse around the September 11th attacks and the subsequent Global War on Terror.Footnote 8
Figure 3a shows a time series for a selection of narrative statements pertaining to terrorism and war over the years 1994–2015. First, we see that the narrative on the threat posed by Saddam Hussein spikes in 2002, as the Bush Administration pushed its case for war and for congressional authorization. The supporting narrative of Hussein having or using weapons of mass destruction spikes at the same time (Kull, Ramsay, and Lewis Reference Kull, Ramsay and Lewis2003), continuing over the subsequent years. Meanwhile, appeals to God blessing America surged in the wake of the September 11th attacks (Klocek and Hassner Reference Klocek and Hassner2019). Furthermore, starting in 2003 with the Iraq invasion, a second religious narrative of God blessing the troops gained hold and persisted for a decade.
In Section I of the Supplementary Material, we show that the statements in Figure 3a are part of a broader political story on the American response to 9/11 and the intervention in Iraq. Narratives around Saddam Hussein and Iraq posing a threat are accompanied by a political case for intervention: on people needing help, the nation taking action, and the need to make sacrifices (Table I.1 in the Supplementary Material). The constellation of related narratives also includes those used by the anti-war opposition—for example, that the Bush administration was misleading Americans.
3.2.2 Popular Narratives Have Emotional Resonance
A commonly discussed feature of narratives is that they appeal to people’s sentiments (Angeletos and La’O Reference Angeletos and La’O2013; Eliaz and Spiegler Reference Eliaz and Spiegler2020). To analyze this dimension in the congressional speeches, we use a sentiment analyzer to score each narrative by the average sentiment of sentences where the narrative appears.Footnote 9 We then produce a ranking of narratives by sentiment, both in the positive and negative directions.
The highest-ranked narratives by positive and negative tone are presented in Figure 3b. The most positive narratives include those related to the Constitution and Founding, of the benefits of healthcare, and of small businesses providing jobs. The negative set includes narratives about providing help in times of need and of the threats posed by terrorists.Footnote 10 Again, the results provide a qualitative window into the priorities and values held by U.S. Congressmen.
3.2.3 Partisan Narratives Map Ideological Disagreements
Scholars have long studied how competing ideologies are reflected in speech, using alternatively n-grams (Ash, Morelli, and Van Weelden Reference Ash, Morelli and Van Weelden2017; Gentzkow, Shapiro, and Taddy Reference Gentzkow, Shapiro and Taddy2019) or topic models (Quinn et al. Reference Quinn, Monroe, Colaresi, Crespin and Radev2010). These previous approaches identify those entities and concepts that, when mentioned, tend to signal party affiliation. Our narrative features provide another angle by identifying the connections between entities and concepts that, when expressed, signal partisanship.
To explore this dimension, we produce an odds ratio for each narrative as its relative usage by Republicans or Democrats (Monroe, Colaresi, and Quinn Reference Monroe, Colaresi and Quinn2008). Figure 3c displays the narratives that are most partisan, with a negative coefficient indicating Democrat-slanted and a positive coefficient indicating Republican-slanted. For example, Democrats are concerned about budget cuts for public programs and Americans losing unemployment benefits, whereas Republicans care about government interference with healthcare and Christian values.Footnote 11 These narratives highlight the mirroring of partisan policy priorities during this recent time period.
To see better how the expressed connections between entities signal partisanship, we compute a narrative divisiveness score for each entity, as the average (absolute value) log-odds ratio of the narratives where the entity appears, minus the log-odds ratio of the entity itself. The highest-ranked entities on this score are those agents and patients for which the political parties most differ in their articulated connections to other entities, after adjusting for the partisanship of the entity itself.
Table 2 Entities associated with the most divisive narratives.
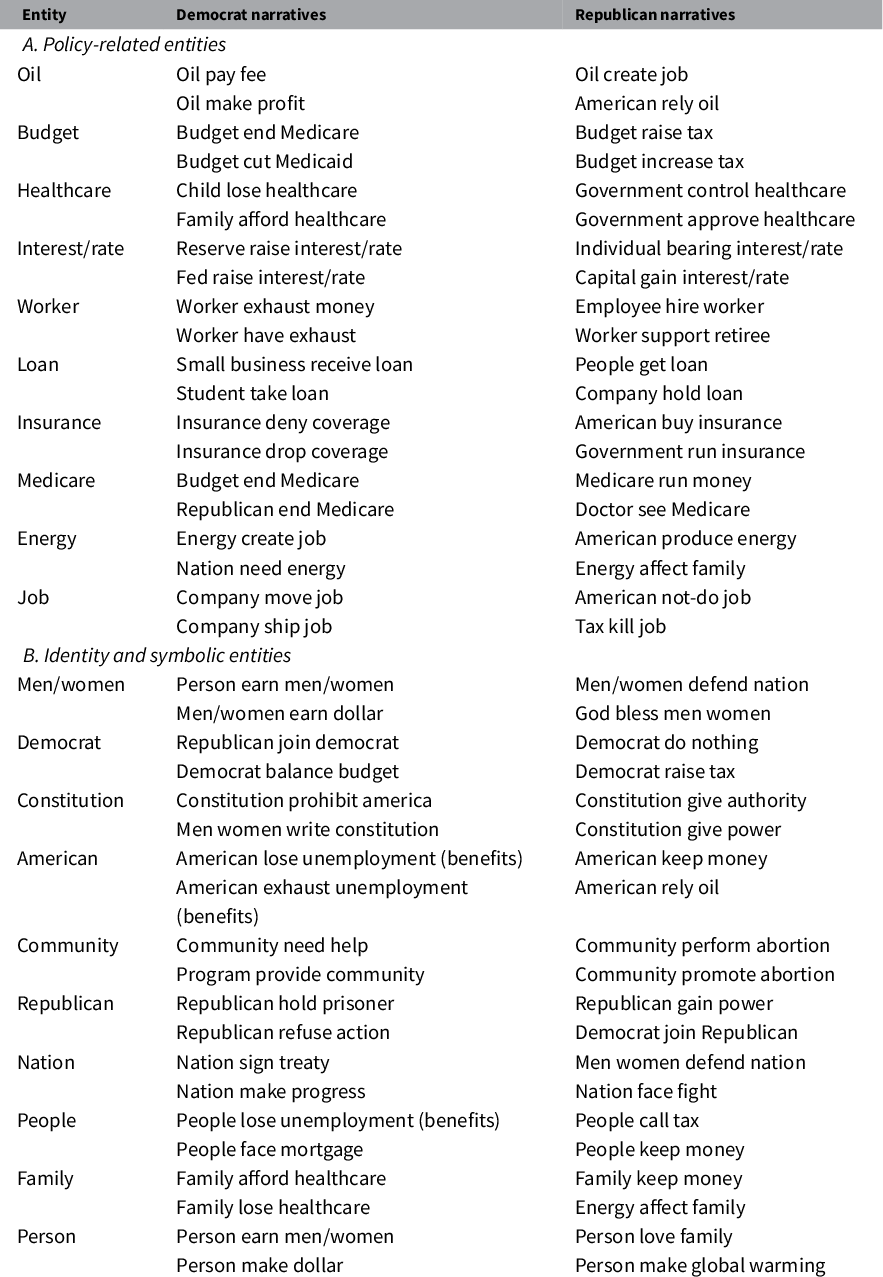
Note: This table shows the set of entities that appear in narratives with a high average log-odds ratio by partisan mentions, adjusted for the log-odds ratio of the entity itself. Panel A includes policy-related entities, whereas Panel B includes entities are related to groups or ideas. Democrat narratives and Republican narratives show the associated narratives with the lowest and highest log odds ratios, respectively.
The entities with the highest narrative divisiveness are listed in Table 2.Footnote 12 Panel A shows the top 10 policy-related entities, whereas Panel B shows the top 10 entities related to identity groups or symbols. The second and third columns, respectively, show the most Democrat-slanted and most Republican-slanted narratives associated with the entity, again as measured by the log-odds ratio.
The list of divisive entities illustrate how the same entities can be used in very different narratives by different parties. On the policy side (Panel A of Table 2), Democrats lament the profits earned by oil companies, whereas Republicans retort that Americans rely on oil. Democrats worry about budget cuts to Medicare and Medicaid, whereas Republicans are concerned that the budget will increase taxes. Meanwhile, Democrats complain that companies are shipping jobs overseas, whereas Republicans assert that taxes kill jobs. On the identity side (Panel B), Democrats attend to men and women’s earnings, whereas Republicans celebrate their defense of the nation and invoke God’s blessings. For Americans, Democrats emphasize that “Americans lose unemployment benefits,” while Republicans stress that “Americans rely on oil.” Overall, the narratives associated with divisive entities illuminate the key divergences in political priorities between Democrats and Republicans. Identifying such partisan connections would be infeasible with standard text-as-data approaches, such as n-grams.
A lingering question is whether mentions of narratives—that is, connections between entities—are overall more polarized than mentions of singular entities. We test this possibility formally following the approach in Peterson and Spirling (Reference Peterson and Spirling2018). Specifically, we train machine classifiers to predict a speaker’s partisanship (Republican or Democrat) in held-out data, using as features either the entities or the narratives pronounced in speeches.Footnote 13 The narrative features predict partisanship more accurately: we obtain an out-of-sample accuracy of 81% with narratives, but only 74% for entities.Footnote 14 The higher test-set accuracy for narratives suggest that they are more informative about partisanship than mentions of topics or specific entities. The connections between entities framed by narratives help politicians tell stories in line with their partisan values.
3.2.4 Narratives Reveal the Connected Structure of Political Debates
So far, we have analyzed narratives in isolation, as two entities connected by one verb. Yet, a defining feature of narratives is that simple statements link up to form more complex stories.Footnote 15 As previewed in Section 2.3, we map the narrative space of U.S. congressional speeches as a directed multigraph, with entities composing nodes and verbs composing link between nodes.
The resulting graph of linked entities can be used for a variety of network-based analyses. In particular, centrality measures can be used to determine which entities are pivotal to political narrative structure (e.g., Hanneman and Riddle Reference Hanneman and Riddle2005). Entities with high closeness centrality, for example, are the most connected to the broader narrative network.Footnote 16 Out-degree centrality captures influential agents who tend to act on many other entities,Footnote 17 whereas in-degree centrality captures the most receptive patients—for example, policies to be enacted and the beneficiaries of those policies.Footnote 18 Such analyses can be further enriched with metadata, notably political party of the speakers.
The narrative graphs are useful to support qualitative descriptive analysis of political corpora. Using an interactive web browser applet, even the full set of 1,638 congressional narratives—353 entities interwoven by 140 verbs—can be explored efficiently and informatively. Since the entire network is too large to depict as a static figure, we visualize the 100 most frequent narratives here. Figure 4 shows this subset of the narrative graph, with thicker arrows indicating higher frequency and colors indicating partisanship—blue for Democrat, and red for Republican. The network summarizes in a single figure many of the stylized facts we have previously discussed. For example, while Democrats lament the problem of “people losing jobs,” Republicans applaud the success of “small businesses creating jobs.” While Democrats want that “Americans have healthcare,” Republicans worry about “government-run healthcare.” Overall, the graph provides a distilled view on the worldviews expressed in the U.S. Congress.

Figure 4 Top 100 most frequent narratives in the U.S. Congress. This figure displays the 100 most frequent narratives in the U.S. Congressional Record. We represent our narrative tuples in a directed multigraph, in which the nodes are entities and the edges are verbs. Node and edge sizes are, respectively, scaled by node degree and narrative frequency. The resulting figure is obtained via the Barnes Hut force-directed layout algorithm. The direction of edges reflects the direction of the actions undertaken. The color of edges indicates partisan narratives—statistically significant log-odds ratios (95% level) are colored in red for Republicans and in blue for Democrats, with nonpartisan narratives in gray.
Figure 4 is just one example of many potentially informative visualizations of the narrative networks. Section H of the Supplementary Material provides party-specific network graphs (see Figures H.2 and H.3 in the Supplementary Material). Moreover, our GitHub repository provides interactive versions of such network graphs.Footnote 19
4 Discussion
To recap, we have designed and implemented a new text-as-data method that provides an intuitive mapping from a corpus of plain-text sentences to a sequence of low-dimensional narrative statements. In this section, we discuss how narrative mining fits in with other text-as-data methods, identify some of its limitations, and propose potential extensions.
4.1 When Should Researchers Use relatio?
In the application sections above, we focus on results that would be difficult to produce with other text-as-data methods. Mainly, this means looking closely at the narratives themselves. In Figure 3a, the depicted narratives capture the dynamics of War on Terror discourse better than plots of specific phrases like “Saddam Hussein” or “God” by themselves. Further, the most emotive and partisan narratives from Table 2 and Figure 3 are more informative than standard representations (like bag-of-words) because they map explicit relationships, requiring less contextual knowledge to interpret them. Finally, the narrative graphs exemplified by Figure 4 have no analog in other commonly used text methods.
The promise of this mode of quantitative description using narratives is not limited to our particular setting. relatio can be used to track the evolution of language in a range of corpora, such as social media and newspapers. In particular, the narrative graphs offer a novel opportunity for data-driven study of worldviews. Section J of the Supplementary Material provides an additional application of our method to President Donald Trump’s tweets from 2011 through 2020. Furthermore, since we open-sourced our Python package in August 2021, several working papers have come out using the code for descriptive analysis in different settings, including Sipka, Hannak, and Urman (Reference Sipka, Hannak and Urman2021) on social media posts about Q-Anon conspiracy theories and Ottonello and Song (Reference Ottonello and Song2022) on newspaper coverage of banks.
To take a broader view, we now discuss how narrative mining complements existing text-as-data methods. First, the narrative features output by relatio can be examined and analyzed the same way that specific word or phrase patterns are used in common dictionary methods. For example, Baker, Bloom, and Davis (Reference Baker, Bloom and Davis2016) count articles mentioning both an economy-related word and an uncertainty-related word to measure “economic policy uncertainty.” A relatio-based alternative could count narratives containing economy-related entities linked with uncertainty-related attributes or entities. The advantage of the narrative approach over dictionaries is that narratives can more easily specify semantically subtle links, such as distinguishing uncertainty caused by the economy, versus uncertainty caused by policy.
Second, the outputs of relatio are similar to approaches using syntactic dependency parsing to identify agents, actions, and objects. In principle, SRL is designed to out-perform syntax-based methods for this purpose; so, for example, relatio could be used to produce measures of relative worker-firm authority in labor union contracts, as an alternative to the dependency-based approach from Ash et al. (Reference Ash, Jacobs, MacLeod, Naidu and Stammbach2020). A caveat is that SRL is a more complex and error-prone linguistics task than dependency parsing. The costs of those parsing errors might outweigh the benefits from using SRL, but the methods have not been systematically compared.
Third, topic models such as LDA (Blei, Ng, and Jordan Reference Blei, Ng and Jordan2003) are, like relatio, designed to perform informative dimension reduction of documents. Narrative statements could provide an alternative to topics for research questions concerning the prevalence of specific concepts or issues. For example, Catalinac (Reference Catalinac2016) applies a topic model to parliamentary speeches, manually inspects and labels topics as being related to local pork or national policy, and then examines changes in the pork/policy categories in response to an institutional reform. An alternative approach using narrative mining would be to extract narratives (rather than topics) from those speeches and then label the narratives as being related to pork or policy. Whether topics or narratives are preferred will depend on the use case. Broadly speaking, topic models will identify the prevalence of relatively generic topics in documents, while relatio will detect the presence of distinctive arguments or claims.
Besides being useful by themselves, the narrative statements produced by relatio can be used as an informative and interpretable feature set in downstream text-as-data applications. For example, document-level counts or frequencies over narrative statements provide an alternative to N-gram frequencies, topic shares, or document embeddings as inputs to text classifiers or text regressions. Similarly, document distance can be computed using cosine similarity between narrative frequency vectors the same way it can be done between N-gram, topic, or embedding vectors. Finally, topic models like LDA can be applied on top of the narrative representation of documents, allowing narrative statements to be topically bundled for further descriptive or empirical analysis.Footnote 20
A systematic comparison of relatio features to these existing alternatives for such tasks is a high priority for future work. Our analysis above showing that narrative features are more predictive of partisanship than entity features provides a promising indication in this direction. Holding the quality of the algorithmic outputs constant, narratives might be preferred to other feature sets due to their interpretability and tractability. relatio extracts distinctive entity-action tuples which summarize the core claims made in a corpus. This type of interpretable dimension reduction serves the same goals as other text-as-data methods, such as TF-IDF weighting (Grimmer and Stewart Reference Grimmer and Stewart2013), supervised feature selection (Monroe, Colaresi, and Quinn Reference Monroe, Colaresi and Quinn2008), or filtering on parts of speech to extract noun phrases (Handler et al. Reference Handler, Denny, Wallach and O’Connor2016). For either supervised- or unsupervised-learning algorithms, the dimension-reduced inputs will be computationally tractable, while the learned outputs will be informative and interpretable.
4.2 Limitations and Potential Extensions
While our narrative mining system shows some promising preliminary results, there are still a number of limitations and opportunities for improvement.
4.2.1 SRL Quality
The quality of narrative outputs depends on the quality of the SRL tags. When SRL fails, it produces nonsense data that will mostly be dropped in the pipeline’s filtering steps. The quality of SRL tags correspondingly depends on the quality of text inputs. Hence, messy text with digitization errors, for example, due to optical character recognition (OCR), may not produce usable results. A further source of SRL errors is grammatical complexity; SRL performs best on simpler language, such as that in social media posts. The Congressional Record—where long, potentially rambling spoken sentences are the norm—is actually a difficult test case for the method.
From the perspective of empirical research design, a relationship between speech complexity and SRL quality is concerning because the performance of our method may differ across subgroups. In our setting, for example, we have evidence that Democrats use somewhat more sophisticated language than Republicans.Footnote 21 If SRL errors are higher for these more sophisticated sentences, then they will tend to be selectively dropped from the sample, potentially biasing downstream results.
Our hope is that these issues will diminish as more robust automated SRL models are introduced. For more difficult corpora, such as historical speeches digitized by OCR, it may be fruitful to adapt the approach to work with syntactic dependencies rather than semantic roles.
4.2.2 Entity Extraction
A persistent practical difficulty is in the extraction of clustered entities. With more clusters, the entities become more coherent and specific, at the expense of higher dimensionality. With fewer clusters, semantically related yet contradictory phrases—for example, “tax hike” and “tax cut”—will often be combined into the same entity. The standard cluster quality metrics, such as silhouette scores, provide limited guidance.
As with SRL, this is partly due to limitations with the associated algorithms. It could be that improved or domain-specific named entity recognition, alternative phrase encoding approaches (e.g., Reimers and Gurevych Reference Reimers and Gurevych2019), or alternative clustering approaches (e.g., Stammbach and Ash Reference Stammbach and Ash2021), could mitigate these problems. The software package will be continuously updated following such developments.
Even with improved algorithms, however, entity extraction may produce imperfect outputs. For example, say one wants to resolve “American” and “people” to one entity—for example, for “American lose job” and “people lose job.” This is currently not straightforward: by default, “American” is a named entity while “people” comes from a clustered embedding. A further wrinkle is that the optimal clustering may be context-dependent: for instance, clustering “people” and “worker” together might make sense for the “[…] lose job” narrative, but it may erase useful information in others—for example, “government support worker” has a different ideological valence from “government support people.” Finally, our entity extraction algorithm cannot directly identify implicit references to entities, such as using the phrase “White House” to refer to the president. In sum, obtaining the entities most relevant to an application with relatio is art as much as science.
4.2.3 Further Extensions and Limitations
There are a number of additional extensions to consider. In the SRL step, additional semantic roles could be included, such as temporality or adverbial clause modifiers. The named entity recognizer could be improved to resolve co-references to the same entity. Further experimentation could be done with dimension-reducing verbs, for example, by combining an embedding-based and dictionary-based approach (to prevent clustering of antonyms). For small corpora, a pre-trained phrase encoder might be required.
The first version of our method was implemented in English. In principle, however, the approach should be applicable in any language where a pre-trained SRL model or, alternatively, a syntactic dependency parser is available. We encourage users to refer to the package repository for ongoing developments, including extensions to other languages.
Acknowledgment
A special thanks to Andrei Plamada and ETH Scientific IT Services for pivotal contributions to the programmatic implementation relatio. We also thank Johannes Binswanger, Jordan Boyd-Graber, Paul Dutronc-Postel, Kfir Eliaz, Malka Guillot, Kai Gehring, Theresa Gessler, Roland Hodler, Philip Resnick, Alessandro Riboni, Michael Roos, Ran Spiegler, and Ekaterina Zhuravskaya for insightful comments. We are grateful for feedback from conference participants at PolMeth U.S., PolMeth Europe, the Swiss Society of Economics and Statistics Conference, the Monash-Warwick-Zurich Text-as-Data Workshop, as well as seminar attendees at CREST, ETH, the Paris School of Economics, and the Universities of Zurich and St.Gallen. We thank all (early) users of relatio for providing valuable feedback, in particular Andrea Sipka and Wenting Song.
Supplementary Material
For supplementary material accompanying this paper, please visit https://doi.org/10.1017/pan.2023.8.
Data Availability Statement
Our replication materials are available at https://doi.org/10.7910/DVN/3BRWKK (Ash, Gauthier, and Widmer Reference Ash, Gauthier and Widmer2022). The open-source software relatio is available at https://pypi.org/project/relatio/. Consult the GitHub repository https://github.com/relatio-nlp/relatio for additional information and ongoing developments.
Funding
This work was supported by the Swiss National Science Foundation Spark Grant 190203 and ERC Starting Grant 101042554 (funded by SERI). Germain Gauthier was supported by a grant of the French National Research Agency (ANR), “Investissements d’Avenir” (LabEx Ecodec/ANR-11-LABX-0047).


 Open access