


During the past two decades China’s manufacturing exports to advanced industrialized democracies have grown enormously. As a result of its liberalization of product and financial markets, its growth in productivity, and its World Trade Organisation accession in 2001, China became the world’s largest exporter of goods in the span of two decades between early 1990s and 2010 (OECD 2012). Given China’s enormous volume of low-wage labor, illustrated by the massive rural–urban migration, its rapid exports growth can be considered as an export shock that can have substantial consequences for employees in OECD countries.
Globalization as such has a long history of being examined as a cause of rising inequality of labor market outcomes in the comparative political economy literature. An important branch of this literature has been focused on the association between economic globalization and earnings inequality. As a measure of economic globalization, studies tend to use imports and exports with less developed countries summed together as a percentage of gross domestic product (GDP) as indicator. Most studies report insignificant associations between this measure and various measures of earnings inequality (Rueda and Pontusson Reference Rueda and Pontusson2000; Pontusson et al. Reference Pontusson, Rueda and Way2002; Oliver Reference Oliver2008). Huber and Stephens (Reference Huber and Stephens2014) do not find significant effects of total imports and exports as a percentage of GDP on earnings inequality. Yet, these studies do not devote specific attention to China’s rise on the global economic stage. In addition, trade is measured at the country level even though there are substantial differences in the degree to which sectors within countries are exposed to trade. Furthermore, an important theoretical channel through which trade has an impact on labor market outcomes is neglected. Traditional measures of trade only capture direct linkages between trading partners. These approaches disregard that exporting sectors are also affected by the rise of China when foreign export markets switch to Chinese imports instead.
Recent studies in international economics and labor economics reveal strong distributive effects of the rise of China on the global economy in single-country studies. Autor et al. (Reference Autor, Dorn and Hanson2013) and Autor et al. (Reference Autor, Dorn and Hanson2015) find that rising Chinese import competition on US labor markets has reduced employment and wages in manufacturing sectors. For Norway, Balsvik et al. (Reference Balsvik, Jensen and Salvanes2015) find also negative employment effects, but no indications of wage effects. These authors attribute these dissimilarities in results to the lower flexibility of Norwegian labor market institutions compared to the United States. Although these case studies insightfully depict country-specific developments, they do not allow for a general assessment of labor market outcomes of Chinese trade competition across a broader group of OECD countries with diverse political–economic institutions. Therefore, the research question of the present study is how to explain the variation in employment across sectors and over time.
We aim to complement our existing knowledge of determinants of the distribution of labor market outcomes by analyzing the developments in sectoral employment size and the share of hours worked by low-skilled workers in 17 sectors across 18 OECD countries between 1990 and 2007. In our analysis, we look at the manufacturing industry, which consists of the sectors that are most exposed to Chinese trade competition. On average across our sample, 23 percent of all workers are employed in these sectors, making it a vital part of the economy and society.
We focus on trends in employment for two reasons. First, the distribution of hours worked across skill groups distils employment effects, whereas indicators of total earnings inequality, defined as hours worked times the hourly wage, would mix wage and employment effects. The distribution of hours worked accounts for an important part of total earnings inequality in developed countries, and its importance is increasing over time (Checchi et al. Reference Checchi, García-Peñalosa and Vivian2016). Second, for employment we have internationally comparable time series data on both trends in the relative amount of employment as well as the distribution of employment across skill groups at the sectoral level.
This approach allows us to examine the distributive effects of Chinese trade competition, while we can account for institutions found to be relevant in the comparative political economy literature (e.g., Rueda and Pontusson Reference Rueda and Pontusson2000; Mahler Reference Mahler2004). With respect to this literature, we seek to make three contributions.
First, existing comparative political economy research pertains to distributive effects of international trade in general, but does not devote attention to effects of Chinese trade in particular. This is remarkable given the importance of employment loss and inequality in labor market outcomes in the real world politics. We empirically test whether increased Chinese trade competition is associated with lower employment and lower shares of working hours for the low-skilled, in order to contribute to our knowledge on determinants of rising levels of earnings inequality in Western countries (Huber and Stephens Reference Huber and Stephens2014). Second, we extend our analysis of trade effects by taking into account Chinese competition on foreign export markets. This route of trade competition has been neglected thus far in the existing inequality literature. Third, we take the sector as the unit of analysis. Exposure to international trade and therefore its labor market effects vary substantially across sectors (Hays Reference Hays2009; Walter Reference Walter2010; Oesch Reference Oesch2013; Thewissen et al. Reference Thewissen, van Vliet and WangForthcoming). Our central hypothesis is that sectors with greater exposure to Chinese trade competition experience stronger labor market effects. Furthermore, our study is complementary to recent research on deindustrialization in political science. We inspect the evolution of the manufacturing sectors in detail, while recent accounts mainly focus on developments in the services sectors (Rehm Reference Rehm2009; Wren Reference Wren2013; Dancygier and Walter Reference Dancygier and Walter2015).
LITERATURE AND HYPOTHESES
Our theoretical understanding of the distributive effects of Chinese exports is based on two standard trade models from international economics. In the Ricardo–Viner model, sectors are the central unit of analysis as it is assumed that factor mobility is limited. Employees in sectors with higher exports as a result of the reduction of trade restrictions benefit, whereas employees in sectors with increased imports loose (Samuelson Reference Samuelson1971; Hays Reference Hays2009). In contrast, the Stolper-Samuelson model, in which factor mobility is assumed to be perfect, hinges on factor endowments (Stolper and Samuelson Reference Stolper and Paul1941). Owners of abundant production factors profit from trade.
Increased trade competition stemming from China may affect workers in OECD countries in two ways. First, Chinese imports in OECD countries can substitute the domestic production of goods, resulting in a reduced labor demand. Hence, it can be expected that sectors with more Chinese exports experience more shedding of labor. The findings of Autor et al. (Reference Autor, Dorn and Hanson2013) and Balsvik et al. (Reference Balsvik, Jensen and Salvanes2015) for respectively the United States and Norway support this hypothesis. Second, Chinese exports may also affect sectors by generating increased competition in the foreign markets where sectors sell their products. As an example, it could be that a German manufacturer has a large market share in France, but sees its exporting opportunities to France decline as France substitutes German imports for Chinese products (Balsvik et al. Reference Balsvik, Jensen and Salvanes2015). Thus, we hypothesize that the relative employment size of sectors more exposed to Chinese trade competition will shrink.
Within sectors, we predict that labor market effects of Chinese trade competition are not equally shared across all workers. Given the relative abundance of low-skilled labor in China, mainly the low-skilled employees in exposed manufacturing sectors in OECD countries will be affected by Chinese exports. Therefore, we hypothesize that within sectors, sectoral exposure to Chinese trade competition is associated with relatively less work for low-skilled employees. For high-skilled workers, however, expectations are less clear-cut. Based on an empirical analysis for the United Kingdom, Bloom et al. (Reference Bloom, Draca and Van Reenen2016) find positive wage effects of Chinese trade competition for high-skilled workers. As more competition from China does not imply more exports to China, on the contrary, these positive effects are not an indication of the typical winners from the Stolper–Samuelson model. Instead, according to recent insights from international economics (e.g., Melitz Reference Melitz2003), increased competition triggers firms to increase their productivity in order to survive. Indeed, Bloom et al. (Reference Bloom, Draca and Van Reenen2016) find that Chinese trade competition has a positive impact on innovation and productivity. In order to achieve this, firms hire more high-skilled workers. This increased demand can be expected to lead to positive labor market effects for high-skilled workers in sectors that are more exposed to Chinese competition.
Another explanation for employment loss and rising levels of labor market inequality is technological change. According to Frey and Osborne (Reference Frey and Osborne2013), automation of jobs puts 47 percent of total US employment at risk. Moreover, within sectors these employment effects are not equally shared among skill groups according to the so-called skill-biased technological change (Goldin and Katz Reference Goldin and Katz2008; Oesch Reference Oesch2013; Wren Reference Wren2013). Technological innovation complements the high-skilled, while it substitutes routine labor by capital. The demand for high-skilled labor increases, leading to better labor market opportunities for highly educated workers. In contrast, the demand for low-skilled labor decreases, resulting in fewer jobs and lower wages for workers with low levels of education. These effects of technological change are supported by empirical studies on the US (Goldin and Katz Reference Goldin and Katz2008). Focusing on the labor market effects of information and communication technologies (ICT), Michaels et al. (Reference Michaels, Natraj and Van Reenen2014) extend this empirical evidence to sectors in Japan and nine European countries. We hypothesize that exposure to technological change is associated with less employment for low-skilled and more employment for high-skilled labor within sectors. With regard to the overall employment level of a sector, we expect that technological progress is associated with automation of work, and hence a lower relative employment size.
A third line of explanations for the variation in labor market outcomes emphasizes the importance of labor market institutions. As employers and employees bargain over wages and other working conditions, the outcomes of these negotiations are a function of a country’s system of labor relations and political power distributions (Huber and Stephens Reference Huber and Stephens2014). First, the share of employees covered by wage bargaining agreements and the level of coordination of wage bargaining may affect labor market outcomes. The main hypothesis on this score is that centralized wage bargaining creates fewer and smaller wage differentials as more firms and industries are covered by the same wage settlements (Wallerstein Reference Wallerstein1999; Rueda and Pontusson Reference Rueda and Pontusson2000; Mahler Reference Mahler2004). Through these wage compression effects, the bargaining coverage and coordination of bargaining may also affect the employment distribution. High-wage settlements may have adverse effects on employment if wages are not in line with productivity. Hence, as multiple sectors are involved in the bargaining, the resulting wage settlement may harm employment in low-productivity sectors (Iversen and Wren Reference Iversen and Wren1998).
Furthermore, labor market outcomes may be influenced by employment protection legislation (EPL) and unemployment benefit schemes. It can be expected that EPL protects especially the workers with low levels of education because of a substantial component of fixed costs (Koeniger et al. Reference Koeniger, Leonardi and Nunziata2007). As to unemployment benefits, these increase the reservation wage of workers. Hence, generous unemployment benefits exert a positive effect on wages, especially on wages at the lower end of the wage distribution. These higher wages could go hand-in-hand with lower employment possibilities for low-skilled workers.
Finally, the political ideology of governments might also have an impact on the distribution of labor market outcomes. First, since governments are extensively involved in private-sector wage setting in many advanced industrial countries, the ideology of governments might have a direct effect on inequality. Hence, left-wing governments can be expected to pursue policies protecting the low-skilled compared to liberal or conservative governments (Wallerstein Reference Wallerstein1999). Second, governments might influence labor market outcomes through minimum wage legislation, taxes, and other forms of income policies. Again, it may be expected that left-wing governments adopt policies that lead to less inequality (Rueda and Pontusson Reference Rueda and Pontusson2000; Pontusson et al. Reference Pontusson, Rueda and Way2002; Oliver Reference Oliver2008).
DATA, MEASURES, AND METHOD
Dependent Variables
We use two main dependent variables and data from multiple sources.Footnote 1 First, we analyze sectoral employment effects, using the relative employment size. This measure is defined as the number of individuals engaged (employees and self-employed) in a sector divided by the number of individuals engaged in the national economy. As this measure is defined as a share of total employment, it captures employment effects or inequality between sectors. Data are taken from the EU-KLEMS (2007) database.Footnote 2
As our second dependent variable, we analyze the hours worked by low-skilled workers as a share of the total hours worked.Footnote 3 This measure has been used in other studies (OECD 2011a; Michaels et al. Reference Michaels, Natraj and Van Reenen2014). The low-skilled shares are interpreted here as tapping into the employment distribution between skilled and low-skilled workers, since they are also influenced by changes in the hours worked of the high-skilled through the denominator. The data come from the EU-KLEMS March 2008 release.
We focus on employment effects as a key component of earnings inequality for two reasons. First, for employment we can examine both the relative size, for example, the relative amount of employment in exposed sectors, as well as the distribution of employment across skill groups. Second, for employment the EU-KLEMS contains a more distilled indicator of earnings inequality. The data set also has wage bill share information analogous to our hours worked measure, but this indicator mixes wage and employment effects, making it impossible to attribute the effects to either employment or wages.Footnote 4 Using a decomposition analysis, Checchi et al. (Reference Checchi, García-Peñalosa and Vivian2016) find that dispersion in hours worked accounts for up to 40 percent of total earnings inequality in their sample of the United States, United Kingdom, Germany, and France between 1989–2012. Moreover, the authors find that the contribution of the distribution of hours worked is growing over time.
The analysis focuses on 17 sectors at the two-digit International Standard Industrial Classification (ISIC) 3.1 levelFootnote 5 across 18 capitalist countriesFootnote 6 and utilizes annual data for the years 1990–2007.
Measuring Chinese Trade Competition
For our measure of exposure to Chinese import competition, we follow existing sectoral studies (Mahler et al. Reference Mahler, Jesuit and Roscoe1999; Michaels et al. Reference Michaels, Natraj and Van Reenen2014) and measure this as the value of the total imported goods as a share of the value added for sector i in country j in year t. This measure is the sectoral equivalent of imports as a share of GDP at the country level.Footnote 7 Data on imports come from the OECD (2011b) STAN Bilateral Trade Database and value added is taken from EU-KLEMS (2007).
To capture the Chinese competition in foreign markets p to which sectors export their goods, export competition for sector i in country j at time t is measured as follows:
 $$\mathop{\sum}\limits_p {\left( {{{Exports_{{ijpt}} } \over {Exports_{{ijt}} }}{\times}{{\left( {{Chinese}\,exports_{{ipt}} \,{\minus}\,Exports_{{ijpt}} } \right)} \over {{Total\,exports}_{{ipt}} }}} \right)}$$
The second part of Equation 1 measures the difference in exports from the sector type i of China and country j to country p, relative to the total exports—from all countries—of sector type i to country p.Footnote 8 Hence, this measure indicates the difference between the export market shares of the sectors i from China and country j in country p. Subsequently, the pressure from the Chinese competition in the foreign market p depends on the relative importance of foreign market p for sector i in country j. Therefore, the competition in foreign market p is weighted by the first term of Equitation 1, which is the value of the exported goods from sector i in country j to country p divided by the total exports of sector i in country j.Footnote 9 An advantage of the export competition measure used in this study over the measures used by Autor et al. (Reference Autor, Dorn and Hanson2013) and Balsvik et al. (Reference Balsvik, Jensen and Salvanes2015), is that our measure accounts for the temporal variation in the exports from sector i in country j, whereas the other measures only include the initial market share of this sector. For the export competition measure, sectoral data from the OECD STAN Bilateral Trade Database are collected for 59 partner countries p, including all OECD countries, all European countries, the BRIICS, Malaysia, Pakistan, the Philippines, and Thailand, which amounts to little over half a million observations, covering around 85 percent of all imports for our sample of countries.
In Figure 1 we display our measures of import competition and competition in foreign export markets graphically. As an example, we take an industry in Germany. The double lined arrow on the right-hand side pointing upwards shows the exposure to import competition for this industry, coming from (direct) imports from China. The pivoted arrows on the left-hand side together show the amount of export competition. The two solid arrows are the exports from the German and Chinese sector industry to the same industry in the Netherlands. The difference between these Chinese and German exports to the Netherlands, weighted by total exports to the Netherlands, measures the amount of export competition the German sector experiences from China in the Netherlands. This is calculated for more countries, such as France (the dashed lines), and 57 other countries (the dotted lines).
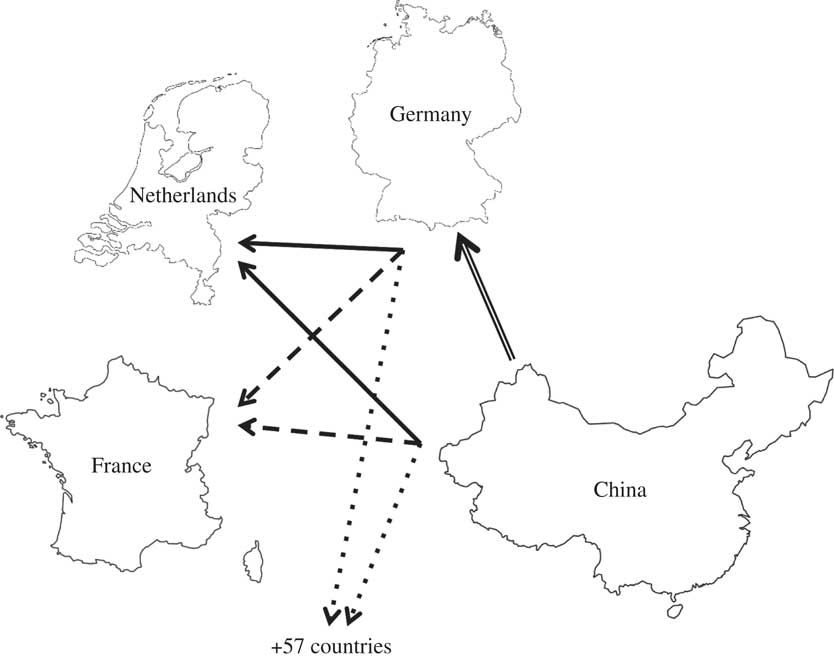
Fig. 1 Import competition and competition in foreign export markets illustrated for a German industry
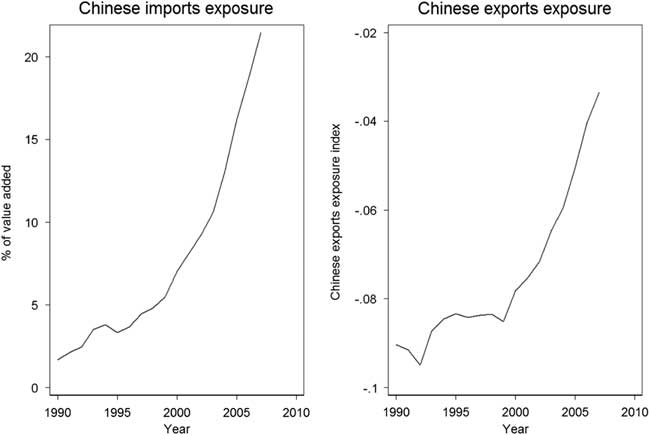
Figure 2 and Table 1 show that China is becoming an increasingly important trading partner for advanced industrialized countries. Figure 2 presents averages for all sectors, whereas Table 1 presents trade exposure per sector averaged across countries. Between 1990 and 2007, the imports from China as a percentage of value added increased in all sectors but the mining industry. The export competition measure shows negative values for all sectors in 1990. This indicates that in the foreign markets, the value of the exports from the OECD countries is on average larger than the value of the Chinese exports. Over time, the exposure to Chinese competition has rapidly increased for exporting firms, as indicated by less negative values.
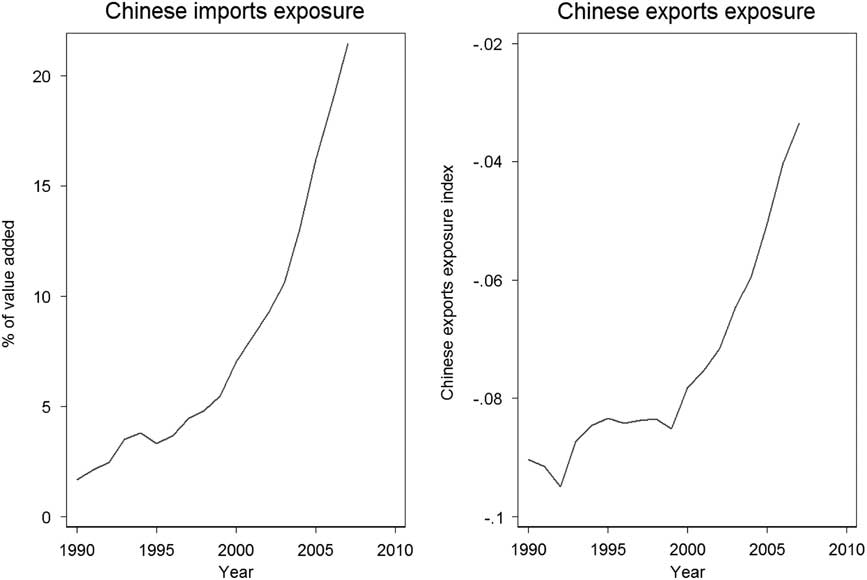
Fig. 2 Evolution of Chinese imports and exports competition Note: unweighted averages across all countries and sectors in our sample.
Table 1 Imports and Exports Exposure

Interestingly, the exposure to import and export competition from China varies considerably across sectors. This is also reflected by a low correlation between the two measures (0.25). For instance, exposure to Chinese export competition in the electrical manufacturing sector increased between 1990 and 2007, whereas it hardly changed in the paper industry. However, exposure to Chinese imports in the home markets did increase substantially in the paper industry.
Other Independent Variables
We include a measure of total imports excluding Chinese imports as a share of sectoral value added to account for the effects of other imports. Chinese imports and total imports excluding Chinese imports are substantively and empirically distinct, as indicated by a low correlation (0.14) and a much more rapid rise of Chinese imports (15.2 instead of 2.0 percent on average per year for our sample).
To account for effects of skill-biased technological change on employment, we follow Michaels et al. (Reference Michaels, Natraj and Van Reenen2014), Massari et al. (Reference Massari, Naticchioni and Ragusa2013), and Wren (Reference Wren2013) and include ICT capital compensation as a share of sectoral value added from the EU-KLEMS (2007) dataset.Footnote 10 As international trade and skill-biased technological change affect labor market outcomes given a certain labor supply (Goldin and Katz Reference Goldin and Katz2008), we also account for the heterogeneity in the relative skill supply across countries. We use the percentage of the total population with tertiary education completed from Barro and Lee (Reference Barro and Lee2015).
To account for wage-setting institutions, we include the bargaining coverage, defined as the proportion of employees covered by wage bargaining agreements, and the level of wage coordination. Both measures are taken from the ICTWSS database (Visser Reference Visser2013).Footnote 11 We use two measures for the strictness of EPL, both taken from the OECD (2014a). We take the EPL strictness index for regular contracts, and the index for temporary employment. For unemployment benefit schemes, we take replacement rates from Van Vliet and Caminada (Reference Van Vliet and Caminada2012).Footnote 12 To analyze the impact of left-wing governments, we use the percentage of total cabinet posts held by left-wing parties from the Comparative Political Data Set (Armingeon et al. Reference Armingeon, Knöpfel, Weisstanner and Engler2012).
To control for cyclical dynamics (Thewissen Reference Thewissen2014), we include the sectoral volume of gross value added. Data are taken from the EU-KLEMS (2007) data set. To control for more general economic conditions at the country level, we include the unemployment rate. Unemployment rates are taken from the OECD (2014b) Labour Force Statistics. Finally, we include real GDP per capita from the OECD (2014c) National Accounts.
Method
The error correction model (ECM) has become a conventional estimator in studies on pooled time series cross-section data. The model is able to capture both long-term structural effects and short-term transitory effects (De Boef and Keele Reference De Boef and Keele2008). Recently, the use of ECMs has become subject of debate. Grant and Lebo (Reference Grant and Matthew2016) argue that ECMs are problematic if equations are unbalanced or if data are stationary. Keele et al. (Reference Keele, Linn and Webb2016) agree on the point of unbalanced equations, but they maintain—as in De Boef and Keele (Reference De Boef and Keele2008)—that ECMs can be applied to stationary and non-stationary data alike. Indeed, we find evidence for non-stationarity in our data.Footnote 13 An ECM can be applied in case of non-stationarity, if there is evidence of cointegration within the model (Grant and Lebo Reference Grant and Matthew2016). We test for model cointegration with a three-step procedure. First, we run a static model. Second, we predict the residuals from this model. Third, we run the model specified in first differences in which we include the predicted residuals—the error correction term.
The coefficient of the error correction term is negative and strongly significant for the relative employment size and the share of hours worked by low-skilled workers. Therefore, we rely on ECMs for our main estimations. The estimated equation of the ECM is:
 $$\Delta y_{{ijt}} \,{\equals}\,\alpha _{{\rm 0}} {\plus}\alpha _{1} y_{{ijt{\minus}{\rm 1}}} {\plus}\beta _{{\rm 0}} \Delta X_{{ijt}} {\plus}\beta _{1} X_{{ijt{\minus}{\rm 1}}} {\plus}\beta _{2} z_{{it{\minus}{\rm 1}}} {\plus}\gamma _{i} {\plus}{\varepsilon}_{{ijt}}$$
Here, Δyijt denotes the first difference in the dependent variable in sector i in country j and year t; α 0 the intercept, and ε the error term. For the vector of independent variables x the short-term effects are indicated by β 0. The long-term effects are indicated by β 1/−α 1. Unit fixed effects γ i are included to account for unobserved sector-specific heterogeneity.Footnote 14
Given the fact that the recent debate has highlighted some important weaknesses of ECMs (Grant and Lebo Reference Grant and Matthew2016; Keele et al. Reference Keele, Linn and Webb2016), we also estimate partial adjustment models. As will be discussed below, the partial adjustment models yield highly comparable results. The estimated equation of the partial adjustment model is:
 $$y_{{ijt}} \,{\equals}\,\alpha _{{\rm 0}} {\plus}\alpha _{1} y_{{ijt{\minus}{\rm 1}}} {\plus}\beta _{{\rm 0}} X_{{ijt}} {\plus}\beta _{1} z_{{it}} {\plus}\gamma _{i} {\plus}{\varepsilon}_{{ijt}}$$
Despite the fact that the lagged dependent variable absorbs autocorrelation in the error term, Breusch–Godfrey tests indicate that there is still autocorrelation left. Therefore, the error term is specified to follow a panel-specific AR(1) process. In addition, we use panel-corrected standard errors to correct for panel-heteroskedasticity and contemporaneous spatial correlation (Beck and Katz Reference Beck and Katz2011).
EMPIRICAL ANALYSIS
Relative Employment Size
The estimation results with the relative employment size as dependent variable are presented in Table 2. This variable is measured as the number of people working in a sector divided by people working in the national economy. As this ratio sums to one for each country-year observation, the country-level variables lose their interpretation and are not included. In terms of significance and magnitude, the results of the ECM (1) are comparable to the results of the partial adjustment model (2). Chinese imports are negatively associated with the relative employment size. This result provides empirical support for the hypothesis that imported Chinese goods substitute domestically produced goods leading to negative employment effects. The employment effects of total imports excluding Chinese imports are comparable but smaller. Exposure to Chinese export competition seems to have a negative effect on the relative employment size, but only in the short run as the coefficient for the lagged level is not significant.Footnote 15
Table 2 Chinese Import and Export Competition and Relative Employment Size

Note: Panel-corrected standard errors and panel-specific AR(1) structure, 1990–2007. The regression also includes sector fixed effects (not shown here). t-Statistics in parentheses.
*p<0.1, **p<0.05, ***p<0.01.
The results indicate a negative association between technological change and the relative employment size of sectors. This suggests that in sectors with rapid technological progress workers have been substituted, resulting in lower relative employment levels. Furthermore, the results provide some evidence for positive employment effects of the value added.
Next, we graphically assess whether the long-term effects of Chinese import competition on the relative employment size are quantitatively important (Williams and Whitten Reference Williams and Whitten2012; DiGiuseppe Reference DiGiuseppe2015; Clay and DiGiuseppe Reference Clay and Digiuseppe2016).Footnote 16 Using the estimates of the partial adjustment model, Figure 3 presents dynamic simulations for Chinese import competition and for technological change for a period of ten years, allowing us to compare the magnitude of the effects of these two independent variables.Footnote 17 The simulations begin with the relative employment size at the sample median. For import competition and technological change, we present two scenarios: a “low scenario” (we hold the value of the covariate at the 5th percentile of the sample) and a “high scenario” (in which we take the 95th percentile).Footnote 18 As an illustration, in Canada, manufacturing of paper has a Chinese import competition value around the low scenario, whereas import competition for manufacturing of textiles is around the high scenario value. In the United Kingdom, a low scenario level of technological change can be found in manufacturing of coke, while manufacturing of electrical and optical equipment shows high scenario values. All other variables are held at the sample mean.Footnote 19 The vertical bars indicate 95 percent confidence intervals around the simulated values.
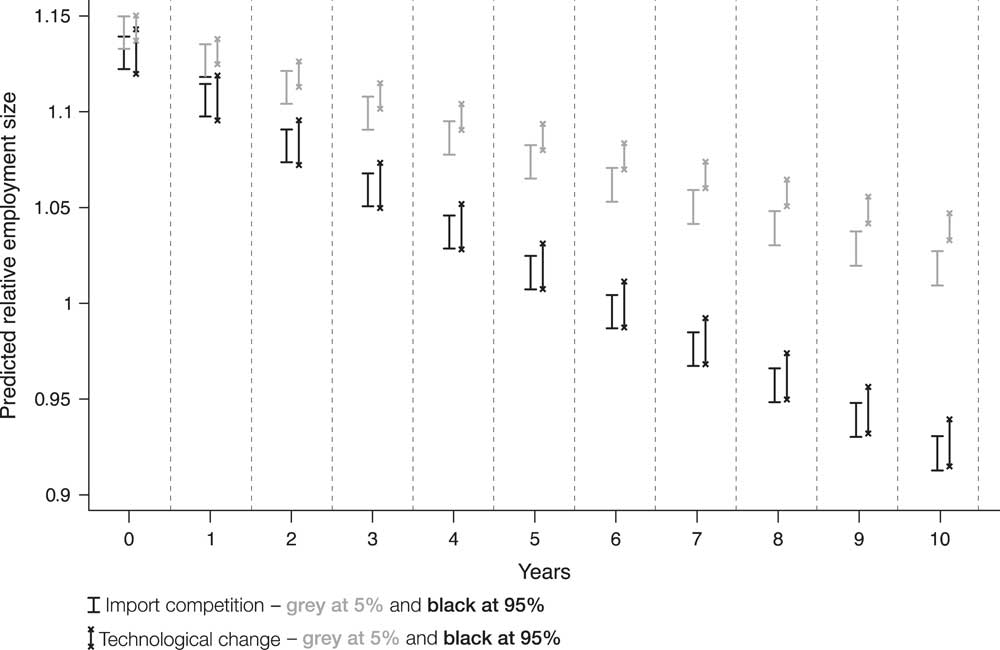
Fig. 3 Simulated long-term effects of Chinese import competition and technological change on relative employment size Note: vertical lines indicate the 95% confidence intervals for each year. They are slightly jittered to avoid overlap.
The simulations highlight several aspects. First, for Chinese import competition the 5 percent scenario differs significantly from the 95 percent scenario from t+1 (the second vertical bar) onwards, as the bounds of the confidence intervals do not overlap.Footnote 20 Second, within both scenarios, the confidence intervals surpass the boundaries of previous values in the course of time. This indicates the significance of long-term effects of import competition on the relative employment size. Third, the figure shows that the gaps in predicted relative employment size between the two scenarios increase when time progresses. The relative employment size under a 5 percent Chinese import scenario shows a predicted decrease from around 1.14 to 1.02 percent over ten years. For a 95 percent Chinese import scenario, however, the predicted decrease in employment size is 0.10 percentage points larger or the predicted decrease is almost twice as large, to 0.92 percent. Thus, on average for each of the manufacturing sectors, the difference between low and high exposure to Chinese imports matters by an estimated 0.1 percent of total employment over ten years, which seems to be a quantitatively meaningful effect size.Footnote 21
Figure 3 shows that the predicted effects on the relative employment size of Chinese import competition and technological change are very comparable. Also for technological change, the 5 percent scenario becomes statistically significant from the 95 percent scenario from t+1 onwards. The bounds of the 95 percent scenario of technological change and Chinese import competition overlap over the entire ten years. For the 5 percent scenario, the bounds overlap for the largest part of the ten years as well.
Hours Worked Low-Skilled
Table 3 presents the results with the share of the hours worked by low-skilled workers as dependent variable. Again, the ECM and partial adjustment model results are very comparable. Chinese imports and Chinese export competition are negatively associated with the share of hours worked by workers with low levels of education. These results suggest that in sectors more exposed to Chinese trade competition, workers with low levels of education are confronted with negative consequences in their hours worked. Furthermore, the results suggest that total imports excluding Chinese imports are positively associated with the share of the hours worked by low-skilled workers in the short run, as the coefficient for the lagged level is insignificant.Footnote 22
Table 3 Chinese Import and Export Competition and Hours Worked Low-Skilled

Note: Panel-corrected standard errors and panel-specific AR(1) structure, 1990–2004. The regressions also include sector fixed effects (not shown here). t-Statistics in parentheses.
EPL=employment protection legislation.
*p<0.1, **p<0.05, ***p<0.01.
We find a negative association between technological change and the share of hours worked by low-skilled workers. This is in line with the hypothesis that skill-biased technological change negatively affects the employment position of low-skilled workers.
Regarding the institutional variables, we find a negative association for the coordination of wage bargaining. The positive association for EPL for workers with a regular contract suggests that EPL provides primarily protection for low-skilled workers. As to the economic control variables, the education level of the population has a positive association. This could follow from a supply and demand effect, when the increase in relative supply of high-skilled decreases their gains, leading to relative improvements for the lowly educated (Goldin and Katz Reference Goldin and Katz2008). Finally, the results provide some evidence for employment effects of GDP per capita.
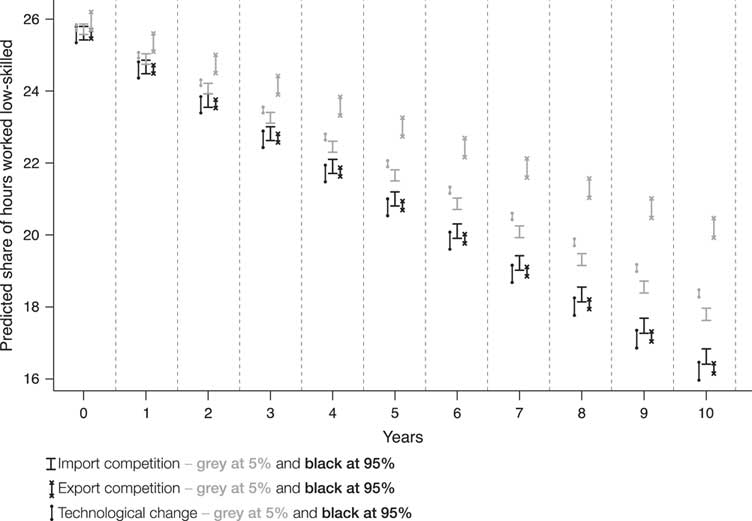
Subsequently, we assess the long-term effects for the share of hours worked by low-skilled workers based on the estimates of Model 4. Following the same approach as discussed above, Figure 4 illustrates the simulated effects from Chinese import competition, Chinese export competition and technological change, as all three variables are significant. Earlier we gave examples of sectors showing low and high scenarios for import competition and technological change. For export competition, in Canada manufacturing of wood shows low scenario values while manufacturing of textiles displays high scenario values.
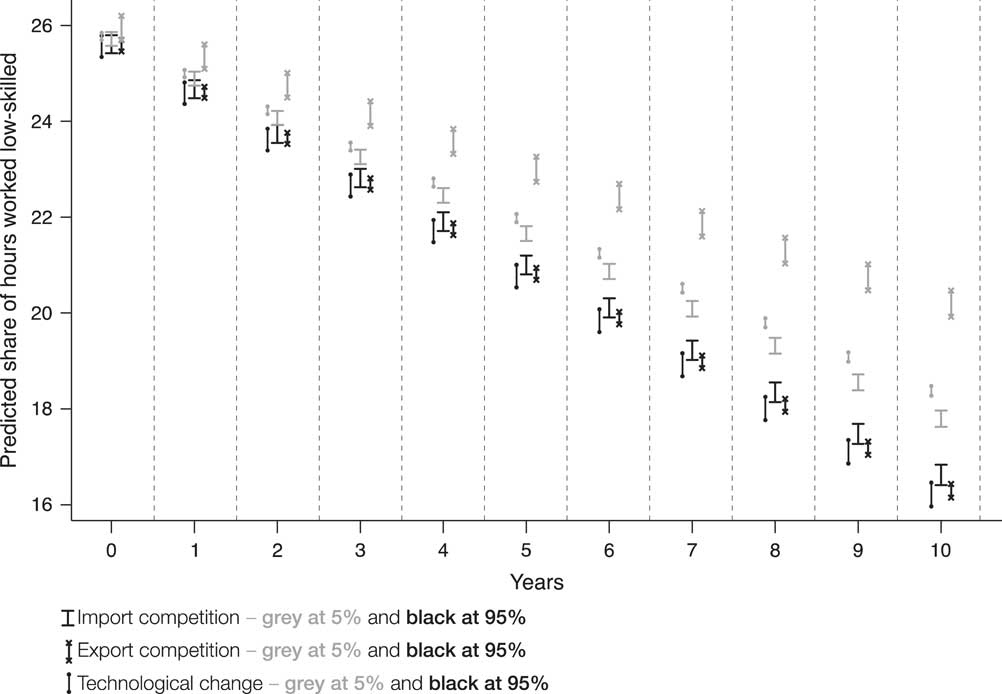
Fig. 4 Simulated long-term effects of Chinese import competition, Chinese export competition and technological change on hours worked low-skilled Note: vertical lines indicate the 95% confidence intervals for each year. They are slightly jittered to avoid overlap.
For export competition and technological change, the 5 and 95 percent scenarios differ significantly from each other from t+1 onwards. For import competition, this is the case from t+3 onwards. We again find quantitatively meaningful predicted effect sizes. For the 95 percent scenario the predicted shares of hours worked by the low-skilled are comparable for the three variables, but for the 5 percent scenario there are differences. In year t+10, the predicted difference between the 5 and 95 percent scenario is the largest for export competition. A sector experiencing a 5 percent exposure to Chinese export competition scenario has a predicted share of 20.5 percent of hours worked by the low-skilled, compared to a predicted share of 16.5 percent for a sector experiencing 95 percent exposure after ten years.Footnote 23
Sensitivity Analysis
We perform additional tests to examine the robustness of our results.Footnote 24 First, the rise of the Chinese economy may not only increase the competition for sectors in OECD countries, but could also increase exports of China, which might have positive employment effects. To account for this, we include exports to China as a percentage of value added in our regressions. In ECMs, the coefficients for exports to China are never significant and do not affect the findings as presented above. In the partial adjustment models, exports to China are positively (p-value <0.1) associated with the relative employment size; other results remain the same.
In addition, we account for other emerging economies to examine the uniqueness of the Chinese trade competition. The sum of imports from India, Malaysia, Mexico, the Philippines, and Thailand—which is lower and grew less than the imports from China—is never significant in the regressions. Apparently, the magnitude of the imports from other emerging economies is too small (still) to find any effects with regression analysis.
Our analysis accounts for a large number of trade and institutional variables that might play a role in labor market outcomes. Following other recent inequality studies (e.g., Michaels et al. Reference Michaels, Natraj and Van Reenen2014) we do not control for international flows of capital as another aspect of globalization (Mahler Reference Mahler2004) or patterns in the minimum wage in our regressions because of limited data availability. We perform additional sensitivity tests where we include bilateral data on foreign direct investment positions, inflows, and outflows, and the minimum wage relative to median or mean wage (OECD 2014b; OECD 2014d). We lose up to two thirds of the observations, and our included variables never reach significance.
CONCLUSIONS
With the rapid expansion of the Chinese economy, the international trade arena has changed substantially for manufacturing sectors in Western countries in the last two decades. Despite the fact that this surge of China has been subject of debate in many political arenas, to date it has not received much attention in comparative political economy. We contribute to our understanding of the effects of Chinese trade competition by analyzing employment effects for a broad set of advanced industrialized democracies. We use sectoral measures of Chinese trade competition between 1990 and 2007 for 18 countries. Moreover, we include a measure that taps into export competition stemming from China.
Accounting for institutional variation across countries, our analysis shows employment declines in sectors that are more exposed to imports from China. Existing studies report distributive effects of Chinese imports on employment levels in the United States and Norway (Autor et al. Reference Autor, Dorn and Hanson2013; Balsvik et al. Reference Balsvik, Jensen and Salvanes2015). Our study generalizes these findings to a set of 18 OECD countries with diverse labor market institutions.
Within sectors, employment effects are not equally shared across skill levels, as we hypothesized. The results suggest that the low-skilled workers bear the brunt of the substitution of domestic production by Chinese imports. These distributive effects are also shown by the results for the increased competition from China in foreign export markets. Sectors with greater exposure to export competition experience declines in the share of employment for low-skilled workers. These results are in line with the hypothesis that production work of low-skilled workers is substituted by Chinese exports, resulting in a lower demand for low-skilled labor. A wider implication of these results seems to be that current studies where competition for exporting sectors is neglected leads to underestimation of the distributional effects of trade competition.
Skill-biased technological change is often put forward as an additional determinant of the labor market outcomes at hand. Indeed, we find a negative effect of technological change on the relative employment size of sectors. Furthermore, in sectors with greater technological innovation, we find that the relative employment position of low-skilled workers worsens.
With regard to effect sizes, we find evidence indicating that Chinese trade competition has a quantitatively important association with the relative sectoral employment size and the distribution of employment across skill groups. The effect sizes are comparable to those found for technological change, a factor that has attracted wide attention in the academic literature (e.g., Frey and Osborne Reference Frey and Osborne2013).
More generally, our study stresses the importance of considering the substantial differences between Chinese imports and overall globalization, and the large variation in exposure across sectors. Theoretically, we would expect trade competition from China to have particularly strong distributive effects given its large volume of low-wage labor. Our empirical evidence supports this. The analysis shows overall employment declines in sectors more exposed to Chinese imports and to the increased Chinese competition in foreign markets. Yet, this association should be interpreted with caution, as our empirical approach does not identify exogenous variation in the main variables.
Nevertheless, our sectoral approach acknowledges the substantial sectoral variation in employment on the one hand, and the exposure to Chinese imports and technological change on the other. Hence, a sectoral approach seems to be a fruitful direction for the analysis of the determinants of the widely observed trend of unequal employment developments across OECD countries over the past decades. Future research could shed more light on individual employment shifts between sectors when detailed micro-level panel data becomes available.


 Open access