


Introduction
Human decision-making is now recognized to involve factors well beyond the rational computation of maximizing utility as theorized by some economists in the twentieth century. The field of behavioral economy emphasizes the deceptive incoherence that often emerges in everyday acts and decision areas of life (Glimcher, Reference Glimcher2014). In the financial context, one of such ‘irrationalities’ is asymmetric weighing of loss on gain leading to dampened loss aversion (Peng et al., Reference Peng, Miao and Xiao2013) whereby the accumulation of losses is associated with less sensitivity to risk, so people become more risk-seeking, as it happens on pathological gambling (Genauck et al., Reference Genauck, Quester, Wüstenberg, Mörsen, Heinz and Romanczuk-Seiferth2017). In the health context, investigation about why people engage in risky health behavior not avoiding future complications with high probability has a high neuroscientific and public health value. Risk-taking health behaviors are critical in chronic diseases such as diabetes (Ginter & Sinko, Reference Ginter, Sinko and Ahmad2013), in which management requires patient continuous daily decisions (self-monitoring of blood glucose, food, and exercise). In general, research highlights individual differences in proneness to maladaptive behavior or suboptimal decisions (van der Gaag, van den Berg, Kunnen, van Geert, & Paul, Reference van der Gaag, van den Berg, Kunnen, van Geert and Paul2020). Therefore, the early identification of risky profiles that predict treatment responses is therefore of paramount importance (St. John, Davis, Price, & Davis, Reference St. John, Davis, Price and Davis2010).
The challenge to collect information that comes close to real-world individual behavior leads to the need to apply alternative methods of measuring risk-taking in addition to limited self-reported instruments (risk perceived and individual traits). Experimental tasks are one of them and are based on ‘a decision variable approach’ (Smith & Huettel, Reference Smith and Huettel2010) focusing on potential outcomes and their values and the level of certainty of future rewards, translated into learning probabilities (uncertainty). This methodology has also been used to estimate individual risk-taking attitudes in normal and clinical populations with Alzheimer's disease, OCD, binge eating, pathological gambling, and other addictive disorders (Kim et al., Reference Kim, Kang, Namkoong, Jhung, Ha and Kim2015; Moallen & Ray, Reference Moallen and Ray2012). For example, the Balloon Analogue Risk Task (BART) (Canário et al., Reference Canário, Sousa, Moreira, Duarte, Oliveira, Januário and Castelo-Branco2019; Lejuez et al., Reference Lejuez, Read, Kahler, Richards, Ramsey and Stuart2002) is a widely used experimental task developed to assess actual risky behavior, choosing to risk for a higher reward or opt for a safe lower reward, without prior probability information (leading to high ambiguity).
This study aimed to investigate if HbA1C (A1C glycated hemoglobin) dynamic variations are associated with distinct risk-taking profiles. If correct, these behavioral phenotypes would serve as indicators for tailoring investment in terms of management policies. HbA1C is the standard dynamic biomarker for the adequacy of glycemic self-management (Mamykina, Smaldone, & Bakken, Reference Mamykina, Smaldone and Bakken2015). We designed a cross-sectional observational study with 91 patients aged between 22 and 55 years with type 1 diabetes mellitus (T1DM). We compared risk-taking performance profiles between 42 adults with type 1 diabetes NoMC (no metabolic control) and 49 MC aged and gender-matched patients (control group with metabolic control) while they completed a robust set of risk-taking measurements to allow for multidimensional clustering: self-reported risk-taking questionnaires and a risky decision-making experimental task under uncertainty with large ambiguity (BART). Concerning the latter, participants did not know outcome probabilities in advance, so their initial decisions were made under complete ambiguity with the possibility of learning across sequential feedback. Sociodemographic, cognitive, personality, psychophysical, and clinical data were also collected.
This is the first study to demonstrate a significant multidimensional risk decision-making profile that distinguishes between individuals with better and worse dynamic HbA1c values, linking behavioral and biochemical variables in diabetes. We tested whether groups could be independently discovered through data-driven cluster analysis. We predicted that a distinct decision-making risky profile would be identified. We expected that this would be associated with impairments in risk perceptions, more general present and past risk attitudes, and larger impulsivity. We hypothesized that the control group (with glycemic control) would yield more efficient game strategies, consistent with adaptive behavior (avoiding too aversive or too risky options). We hypothesized that individuals from the control group consider update values with choice impact, while no significant switching is expected in the group without metabolic control. Concerning relationships among variables, we expected to find positive associations between self-reported real-world risk behavior and BART performance, given the notion that both address the dimension of risk-taking.
Materials and methods
All subjects signed the informed consent of this study, which was approved by the Ethics Committee of the Faculty of Medicine of the University of Coimbra, in accordance with the Declaration of Helsinki. Written informed consent was obtained from the participants, after an explanation of the nature and duration of the study.
We designed a cross-sectional observational study with 91 patients aged between 22 and 55 years with T1DM. We compared risk-taking performance profiles between 42 adults with type1 diabetes NoMC (no metabolic control) and 49 MC aged and gender-matched patients (control group with metabolic control) while they completed a robust set of risk-taking measurements to allow for multidimensional clustering: self-reported risk-taking questionnaires and a risky decision-making experimental task under uncertainty with large ambiguity (BART). Concerning the latter, participants did not know outcome probabilities in advance, so their initial decisions were made under complete ambiguity with the possibility for learning across sequential feedback. Sociodemographic, cognitive, personality, psychophysical and clinical data were also collected. Participants fulfilled the protocol in one visit of one and half hour (visits between 08/2014 and 08/2017). They were at a relatively early stage (no severe complications).
Eligible subjects are all evaluated with the same procedures, regardless of their clinical status: (1) referred to the clinical assessment of Department of Endocrinology, Diabetes and Metabolism – University Hospital of Coimbra, Portugal (SEDM); (ii) only one person in the nuclear family diagnosed with diabetes for at least one year and no other current major chronic disease; (iii) having an IQ > 90. Participants are excluded if there is evidence of past or current history of neurological and psychiatric disorders, recent diseases, major medical illness (cancer, anemia, and thyroid dysfunction) and severe visual or hearing loss. In total, two patients were excluded by presenting a history of psychiatric disorder.
Sociodemographic and cognitive/neuropsychological measures
Participants filled out a demographic questionnaire providing information on gender, age, educational level, civil status, home distance to hospital (residence), household members, and household income. This last one was measured both as the level of income (500–1000; 1000–1500; 1500–2000; >2000 euros) and type of income (stable and unstable; stable is defined by the presence of permanent employment contract).
Cognitive and neuropsychological protocol, carried out by a psychologist, included fluid intelligence assessment (Raven Progressive Matrices) (Raven, Raven, & Court, Reference Raven, Raven and Court2009; Simões, Reference Simões, Almeida, Simões, Machado and Gonçalves2004), crystalized intelligence (Vocabulary Test of WAIS-III), and executive functions such as attentional processes and working memory (Digits Forward and Backward subtests of WAIS-III) (Wechsler, Reference Wechsler2008). Participants with more than 50 filled out MOCA (Montreal Cognitive Assessment) (Freitas, Simões, Alves, & Santana, Reference Freitas, Simões, Alves and Santana2011) allowing a cognitive screening to ensure that inclusion criteria were fulfilled (Ryan, Williams, Finegold, & Orchard, Reference Ryan, Williams, Finegold and Orchard1993; Sommerfield, Deary, McAulay, & Frier, Reference Sommerfield, Deary, McAulay and Frier2003).
Measures from clinical history
Current symptoms and complications were evaluated by the clinicians involved in the consultation at the University Hospital. Body mass index and biochemical data were also collected.
Values of HbA1c for the patient consultation history over multiple time points were first used to divide groups with or without successful metabolic control. Patient's medical history and biological status were inferred based on at least three and up to five samples of HbA1c since they began hospital treatment. For the first group (MC), we included patients with the following dynamic profiles: continuously descending and improving values of HbA1c over time, patients with low (normal) stable/invariant values that did not change beyond 0.5, and patients whose values varied more than 0.5, but the maximum value of this oscillation was lower than 8.0 (64 mmol/mol). For the second group (NoMC), we included patients with the following dynamic profiles: continuously ascending values of HbA1c over time, patients with high (abnormal) stable values that did not change beyond 0.5 over the time and patients whose values varied more than 0.5, with the minimum value of this oscillation being more than 8.0.
Multidimensional risk-related constructs and self-reported real-world risk behaviors
Risk-taking profile was first measured by a comprehensive battery. To fully characterize personality traits and also exclude patients with psychiatry disorders, the Eysenck Personality Questionnaire (EPQ) (Portuguese version, Castro-Fonseca, Eysenck, & Simões, Reference Castro-Fonseca, Eysenck and Simões1991) was administered, in four dimensions: psychoticism (P), extraversion (E), neuroticism (N), and a lie (L) scale. Barratt Impulsiveness Scale-11 (BIS-11),translated (Cruz & Barbosa, Reference Cruz and Barbosa2012) andvalidated for the Portuguese population (Fernandes, Reference Fernandes2014), evaluated impulsivity in general, lack of planning and inhibitory control, as risk-related constructs. Additionally, to achieve individual self-reported real-world risk profile, participants were confronted with two types of questionnaires:
1. Individual perception of risk-taking in health and financial contexts (DOSPERT) (Blais & Weber, Reference Blais and Weber2006); Portuguese translation (Silva, Reference Silva2012).
2. Variations of risk profile in the life span (past and present risk-taking in six distinct areas – leisure, health, career, finance, safety, and social life).
Additionally, perception of family functioning and eating behavior was also considered since diabetes care requires a diet and weight management made mainly at home. Family functioning was assessed by the Systemic Clinical Outcome and routine Evaluation (SCORE-15) (Stratton et al., Reference Stratton, Lask, Bland, Nowotny, Evans, Singh and Peppiatt2014; Portuguese version from Vilaça, Silva, & Relvas, Reference Vilaça, Silva, Relvas, Relvas and Major2014). SCORE-15 is a self-report family assessment instrument with a six-point Likert scale, which also gives specific information about family strengths (and family's adaptability), family difficulties (overcoming on family system), and family communication. Total lower values are related to good family functioning. The Portuguese validation of Dutch Eating Behavior Questionnaire (DEBQ) (Van Strien, Frijters, Bergers, & Defares, Reference Van Strien, Frijters, Bergers and Defares1986; Viana & Sinde, Reference Viana and Sinde2003) is a 33-item instrument, with a five-item Likert scale evaluated three types of eating styles: restrained (avoid eating more than was initially defined), external (to eat motivated by external factors such as good food smell and how it looks), and emotional (to eat in response to emotions) (Fig. 1).

Fig. 1. Representation of conceptual framework underlying our hypothesis as a two-cluster risk profile. DM1 risk profile including individual and family variables, named Multidimensional Self-report Risk Behavior Perception (assessed by three questionnaires), Eating Behavior (evaluated by Dutch Eating Behavior Questionnaire), Real Risk Behavior (acquired by Balloon Analogue Risk Task, a computerized measure of risk-taking), and Family Functioning (represented by Systemic Clinical Outcome Routine Evaluation-15).
Balloon Analogue Risk Task
BART is a computerized direct measure of risk-taking behavior with an ambiguous and unpredictable reward. Participants were told that they would be presented with 30 balloons. By pumping up a balloon (through a button click), participants have the chance to earn (if they decide to stop inflate), or to lose money (if they let the balloon explode). Riskier option (reward-seeking) might confer greater potential reward and safer option (avoiding loss) gives fewer but more certain reward. Participants are not informed about the balloons' breakpoints. The absence of this information allows for testing participants' behaviors such as: (1) the first play move, initial decision-making under uncertainty, (2) the sequential play move, it means the adjusted decision-making over the game, studying changes in responding as they gain experience with the task contingencies (learning with experience; choice impact as switching from risk-averse to risk-seeking behavior and vice-versa), and task efficiency (final amount of money earned) (Fig. 2).
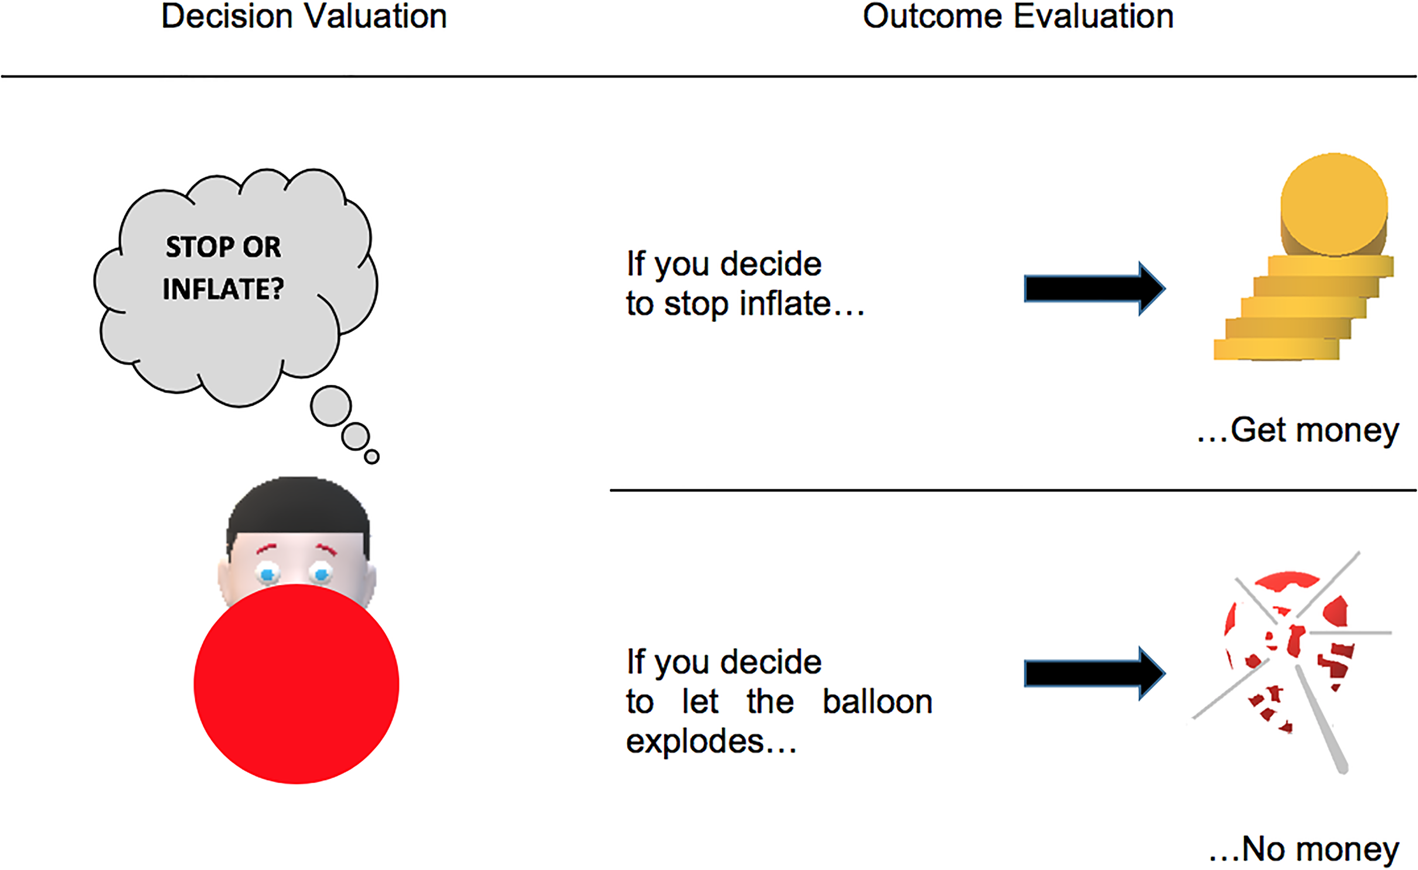
Fig. 2. Representation of Balloon Analogue Risk Task (BART) from Decision Valuation (stop or inflate) to Outcome Evaluation (earn money or not depending on balloon explosion).
Data analysis
Data were analyzed using IBM SPSS Statistics (v24). Descriptive statistics are reported as mean ± s.e.m. Prior to analysis, raw data were examined for normality by the Shapiro–Wilks goodness-of-fit test (Ghasemi & Zahediasl, Reference Ghasemi and Zahediasl2012).
First, two methods of non-hierarchical clustering analysis (two-step and K-means) and multivariate techniques were used to explore a partition driven by individual risk profile variables and to investigate whether they correspond to HbA1c values (Clatworthy, Buick, Hankins, Weinman, & Horne, Reference Clatworthy, Buick, Hankins, Weinman and Horne2005). General actual and past risk-taking, general impulsivity, general perception of risk, global earned money at BART, and eating behavior expressed by DEBQ's three subscales (to preserve each type of eating behavior as itself) were chosen given their correspondence with individual risk profile assessment. By using this methodology, we also aimed to determine the stability of clusters found, searching if different methods can replicate the same grouping (Kos & Psenicka, Reference Kos and Psenicka2000). Using an iterative partitioning method instead of hierarchical agglomerative cluster analysis allows us to minimize the probability of wrong case inclusion at the same cluster because it can reallocate entities continually. Following our methodological strategy, we also need to ensure that all introduced variables for both cluster analysis methods are the same. No continuous variables were excluded from this procedure. Before initiating the cluster analysis, variables were standardized so that all of them contribute equally to the same computations (Maroco, Reference Maroco2007). Data were examined for multivariate outliers and multicollinearity, resulting no significant correlation between variables selected (two outliers were found but all analyses were performed with and without outliers with no significant effect on the results). Therefore, all subjects are included in the analysis. Both K-means and two-step methods used centroid distance with squared Euclidean distance as the similarity measure. Concerning K-means measures, we calculated χ2 statistics to determine the percentage of correspondence between clusters found and dynamic HbA1c categories. Finally, we performed a series of independent-samples t tests so that we better understand the differences between the two groups formed by cluster analysis including also the remaining variables described in ‘Material and methods’ section. By performing these inferential statistical tests, we also got evidence about criterion-related validity to cluster analysis, by introducing no clustering variables as suggested by Ketchen and Hult (Reference Ketchen and Hult2000). We examined all data for intercorrelations (Pearson's). Null-hypothesis statistical tests were evaluated according to an α value of p = 0.05. The χ2 test was used to compare categorical variables and non-parametric tests (Kruskal–Wallis) were used to compare ordinal variables.
Results
Subjects and clinical features
Ninety-one type 1 diabetes adult patients (56 males and 35 females, ages 22–55), who presented to the university clinic, were first divided into two groups according to the dynamics of HbA1c values over time: 42 patients with no metabolic control [mean age: 36.19 ± 8.67, (20, 55), mean educational level (below and above 12 years): 1.36 ± 0.075] and 49 patients (clinical control group) with metabolic control [mean age: 37.20 ± 9.47, (21, 55), mean educational level 1.65 ± 0.07]. A healthy control group (n = 53) was also assessed, but since in this case metabolic status is by definition stable and not disrupted (unlike the clinical control group), the value of these data is normative and presented in Supplemental material (online Supplementary Table S2).
Table 1 summarizes the groups' demographic and clinical characteristics. Groups are matched for age, gender, and civil status. By using the χ2 test, we identified a significant association between HbA1c variations and the number of years of education [greater in MC group, χ2(1) = 7.47, p = 0.006] as well as the household income (stable, for MC). Results from cognitive assessment reveal no group differences. However, comparing groups in terms of disease onset suggests statistically significant differences on Digits Forward and Backward subtests of WAIS-III results (<18 years, M = 13.58, s.d. = 1.68; >18 years, M = 15.26, s.d. = 2.21; U = 1508, p < 0.001, d = 0.87). Additionally, memory impairments are also related to complications [yes, M = 13.82, s.d. = 1.77; M = 15.33, s.d. = 2.13, t(89) = −3.67, p < 0.001, d = −0.77]. Furthermore, NoMC and MC subjects showed no differences in all evaluated clinical characteristics, except for HbA1c values and complications related to DM1 disease (greater in NoMC, as expected from worse metabolic control). Table 1 summarizes the groups' demographic and clinical characteristics.
Table 1. Demographic characteristics, relevant clinical features for NoMc and MC groups (N = 91) and cognitive and personality traits results

a Household members (1 = living alone; 2 = living as a couple; 3 = living with children).
b Household income (1 = stable; 2 = unstable).
c Residence as distance to health services in spending time (1 = Coimbra; 2 = <1 h; 3 = >1 h).
d Educational level (1 = below 12 years; 2 = above 12 years); RPMT, Raven's Progressive Matrices Tests; BMI, body mass index.
Cluster characteristics
Both non-hierarchical cluster analyses revealed a two-cluster solution, even if we specified other number of clusters. Results showed a dichotomic partition that almost perfectly matched with a single dynamic biological parameter (HbA1c).
Through a K-means algorithm, we detected that, Health and Financial Risk, as well as Restrained Eating were the only ones that did not provide a significant contribution to the clustering, as shown by ANOVA (Table 2). Final output (right part of Table 2) revealed that all remaining variables had a significant role. Finally, we found a significant match with metabolic state, as defined by dynamic HbA1C, as proven by the χ2 output [χ2(1) = 29.56, p < 0.001, d = 1.27], concluding that 73.8% of participants from metabolic control group (MC) belong to cluster 1 and 86.7% of the other group belong to cluster 2.
Table 2. Non-hierarchical K-means cluster analysis for continuous risk-taking variables forming a two-cluster solution

RT, risk-taking.
a Money earned at BART.
We found similar results using a two-step cluster confirmatory analysis using the same final variables applied to calculate K-means algorithm. We examined the silhouette coefficient ( = 0.4) as well as size ratio ( = 2.03; 60/31). The Silhouette coefficient determines the distance between the mean distance of one cluster to the mean distance to the other cluster. It ranges between −1 and 1, being that close to 1 indicate that one point in the cluster is far away from its neighbor, so variables fit well within cluster agglomeration. Size ratio refers to the proportion of subjects inserted in each cluster. Knowing that our data have a size ratio of 1.16 (49/42) and introducing dynamic HbA1c variable forward, we concluded that cluster 1 corresponds to participants with diabetes with metabolic control (MC) and cluster 2 to the other group. Moreover, variables introduced are sorted by weight for cluster formation in descending order through a chart revealing their level of importance.
Self-reported real-world risk-related constructs
Groups differed in terms of general impulsivity [t (89) = 2.138, p = 0.035, d = 0.45] and lack of planning (measured by BIS-11) (U = 657.5, p = 0.003, d = 3.34). Higher scores were found in the NoMC group. Additionally, patients with impaired metabolic control over the time presented less health risk perception than MC patients (U = 1273, p = 0.029, d = 0.41). The groups did not differ in terms of risk perception in the financial context. The NoMC group also showed more perceived general past risk [t(89) = 3.83, p < 0.001, d = 0.81] and present risk than the MC (U = 566, p < 0.001, d = 0.80).
These results indicate that groups differ in all evaluated dimensions of self-reported real-world risk-taking (self-control, contextual risk perception, general risk profile over time, and delay reward discounting). Participants from NoMC group showed evidence for reduced self-control, misperception of risk in health context, higher past, and present general risk (Table 2).
Behavioral measure of the risk-taking task (BART)
Risk-taking behavior was analyzed in three components: The First Play Move, The Sequential Play Move, and Task Efficiency, as Final Gain.
For decision-making under uncertainty and ambiguity (the first play move), we examined initial strategy (‘let the first balloon explode’) and initial risk profile (number of successful inflations in first balloon), finding no associations with groups (p < 0.05).
Adjusted decision-making during probabilistic learning (sequential play move and probabilistic learning) was analyzed through several variables: distance to balloon explosion, magnitude of change behavior, minimum, maximum, mean successful inflations, and performance after loss.
First, we examined how groups performed in terms of estimating the distance toward the balloon burst, a so-called gain maximization strategy (balancing risk while avoiding losing). For this purpose, we divided the task into three parts, each one with 10 balloons. Groups differed in gain maximization values for the first two parts of the game (MC with a larger capacity to estimate unknown values). The NoMC group maintained the same behavioral pattern throughout the game, with no reaction to the changes of the context (no subsequent choice impact). In general, more efficient participants (who earned more money in BART) were more responsive to contextual clues. Afterwards, we examined the magnitude of this change comparing the initial number of pumps and the score mean of adjusted average pumps. MC presented a moderate change (−10 to 10 pumps) and NoMC showed an imperceptible magnitude (−5 to 5), so that change magnitude is significantly associated with group membership [χ2(2) = 8.11, p = 0.017, d = 0.63]. We also investigated the performance after a loss (subsequent choice after prediction error). We found no association, but both groups became more risk-seeking in the next balloon after a loss.
Final gain value, as task efficiency measure and expressed in Total Wins, was higher in the MC group as well as adjusted average pumps so participants with metabolic control are more efficient in gathering rewards.
In general, NoMC participants performed worse in BART than the control group in all evaluated levels (see online Supplementary Table S1).
Discussion
Our findings corroborate the hypothesis that a distinct decision-making profile can be identified in type 1 diabetes. We also confirmed the prediction that dynamic biological profiles of metabolic control are associated with such decision-making profiles which therefore define a clinically relevant behavioral phenotype. These profiles were first detected by two methods of non-hierarchical data-driven cluster analysis, showing two clusters matching distinct dynamics of metabolic control and corroborating a model-driven approach based on hypothesis testing. It is important to note that we included only patients with no or at least initial complications related to diabetes disease. This means that we consider that relationship between behavior and biology in this study is largely related to context and not to disease complications per se. These results suggest the existence of behavioral endophenotypes based on multidimensional risk-taking measures and underline the specificities of diabetes care as family functioning and individual eating behavior style assessment. It seems of paramount importance in personalized medicine programs namely the ones emphasizing improved treatment adherence.
Second, we hypothesized that an association should be present between self-reports real-world risk behavior and BART. Our results from self-report assessment showed indeed an association with the scores from the experimental task. The later seems therefore to be a good indicator that our protocol gathers a good approximation to the real-world behavior, maximizing the breadth of risk-taking assessment.
Interestingly, the initial riskiness in the experimental task (Peng, Miao, & Xiao, Reference Peng, Miao and Xiao2013) addressing risk-taking, impulsivity and decision (BART) was negatively correlated with scores on self-report measures of risk-related constructs (self-control) and with the self-report measures of real-world behavior (risk perception, general risk past and present profile). This is interesting because concerning uncertainty, ambiguity, and first level of feedback (first 10 balloons), similar results were found in the prosocial behavioral context (Vives & FeldmanHall, Reference Vives and FeldmanHall2018) explained as tolerance to ambiguity. Social interactions are equally considered ambiguous due to difficulty to predict how people will act. This leads to the interpretation that MC patients are more ambiguity-tolerant to engage in highly uncertain behavior as well as people typically involved in prosocial behavior. Towards an ambiguos stimulus (the first play) MC as people in prosocial behavior (the first interaction with a someone, a stranger) tend to be more optimistic about results in their own favor.
Fourth, we hypothesized that MC group would play more efficiently updating values with choice impact. We found that BART helps to discriminate groups so that MC participants (control group) seem to actively update their expected reward value, changing their initial risk-seeking decision-making strategy to a more effective one. A set of studies could help to get additional insights into this result. Earning more money (successful balloons), this group revealed a higher capacity to estimate unknown values getting closer to them, showing more continuous gain maximization and strategy. Bechara, Damasio, Tranel, and Damasio (Reference Bechara, Damasio, Tranel and Damasio1997) described a similar effect as making decisions advantageously and Dijksterhuis and Nordgren (Reference Dijksterhuis and Nordgren2006) called ‘intuition’ or ‘intuitive’, as presented in the theory of unconscious though, including a feeling based on past experiences. On the contrary, the NoMC group showed a tendency to inflexible risk strategy over time, misperception of risk or less adaptation to uncertain environmental changes (update error or lack of update). In addition, this unchanging strategy is characterized by lower risky options than the MC group. This could be explained by impulsivity or inability to engage with stressful situations given that less inflations led to quicker outcomes, reducing the exposure time to stressor reinforced as the balloon size increases (models of emotion-based choices and emotion sensory systems) (Damasio, Reference Damasio1996). According to the triadic neurocognitive model applied to additive and problematic eating behaviors (Chen et al., Reference Chen, Li, Turel, Sorensen, Bechara, Li and He2018), it could be also reported as an imbalance between a hyper functioning of impulsive system, a hypo-functioning reflective/inhibition and an altered interoceptive awareness system that suppresses cognitive processes to inhibit maladaptive behavior. Similarly, a systematic review about temporal discounting and reinforcement learning by Story, Vlaev, Seymour, Darzi, and Dolan (Reference Story, Vlaev, Seymour, Darzi and Dolan2014) posit that unhealthy behavior is explained by a trade-off between incorporating new information (flexibility) and good use of past experience, dividing decision makers into two strategies of learning action-value: a model-based, goal-directed, ruled-based with rapid sensitivity to change and, on the other hand, model-free, with a gradual integration of outcome values, becoming habits, as unhealthy behavior.
Limitations and future directions
Despite the reported findings, limitations should be considered. First, we are not able to differentiate different stages of the decision process to better understand the risk profile and learning results. The BART experiment focuses on successive action selection but does not allow to directly measure how participants are valuing an uncertain quantity before option selection and update outcomes after cash out or balloon explosions. Future studies that design contemplates partitioning decision-making process could be helpful to disentangle participants’ action intentions and understand if there is a learning impairment or difficulty to estimate uncertainty. Second, patients undergo a non-social decision-making task. Despite several results suggesting impairments in decision-making in the BART task in neurological disorders, it was interesting to investigate how patients perform on self-relevant contexts with health outcomes. Third, emotional states driven from balloon explosion (reaction to loss) could be relevant to understand mediator effects on subsequential decision-making. Further studies should be done to accomplish more evidence of connection between HbA1c and risk behavior profiles. Future work could measure the effectiveness of these interventions targeted to risk-taking decisions in clinical and no clinical populations. It would be helpful to consider other constructs and measures of risk-taking to complete risk profiles, as well as considering contextual and relational factors currently linked by the literature to patient adherence (Gray, Evans, Sweeney, & Lings, Reference Gray, Evans, Sweeney and Lings2003). Future neuroimaging studies could be helpful to understand the neural correlates of the distinctly observed decision-making profiles, helping to understand variability in decision-making.
Conclusion
In the present study, we provide data supporting distinct multidimensional risk behavior decision-making endophenotypes in subjects suffering from diabetes type 1, which were related to the success of metabolic control as defined by dynamic variations of the biological variable Hba1c. This early endophenotype of impaired decision-making under economic or health-related uncertainty and ambiguity impacts health outcomes and should be the target of future healthcare approaches. This work provides scientific evidence for biological association with decision-making profiles not necessarily causal, as validated by cluster analysis and provides important information for the future guidance of adherence improvement programs which is of great public health relevance.
Supplementary material
The supplementary material for this article can be found at https://doi.org/10.1017/S0033291721000386
Acknowledgments
The authors thank the staff of SEMD for their clinical assistance and the patients and health participants whose cooperation made this study possible.
Author contributions
H.J. researched/analyzed data and wrote the manuscript. I.C.D. programmed the experimental task. B.R.C. contributed to the statistical review. M.C.B. contributed to design the plan, reviewed the manuscript and analysis, and contributed to the discussion.
Financial support
This study was supported by the Foundation for Science and Technology Portugal under grants [SFRH/BD/132881/2017], INFARMED, Clinical Research Fund, FIS-FIS-2015-01_DIA, European Association for the Study of Diabetes, Innovative Outcomes – Sanofi-EFSD, FCT UID/4950/2020, CONECT-BCI | POCI-01-0145-FEDER-030852, PCIF/SSO/0082/2018, DSAIPA/DS/0041/2020.
Conflict of interest
None.
Ethical standards
The authors assert that all procedures contributing to this work comply with the ethical standards of the relevant national and institutional committees on human experimentation and with the Helsinki Declaration of 1975, as revised in 2008.


 Open access