


Introduction
The wheat trade between the US and the UK is often considered to be the cornerstone of the late nineteenth century’s “first era of globalization.” However, the American supply of wheat was important for many years prior to the onset of the French and Napoleonic Wars (Sharp and Weisdorf Reference Sharp and Weisdorf2013) and Corn Laws (Sharp Reference Sharp2010) despite interruptions by “exogenous” events such as attacks on wheat by insects and war. So, even though contemporaries saw the “invasion” of cheap American grain with the repeal of the Corn Laws in the 1840s as a new phenomenon, in fact its origins extended back into the eighteenth century. This precedes large improvements in transportation technologies often presented as the reasons for the late nineteenth-century globalization (Harley Reference Harley1988; O’Rourke and Williamson Reference O’Rourke and Williamson1999).Footnote 1 The evidence of early market integration in the North Atlantic in the age of sail (Jacks Reference Jacks2005; Reference Jacks2006; Findlay and O’Rourke Reference Findlay and O’Rourke2009; Sharp and Weisdorf Reference Sharp and Weisdorf2013) undercuts the relative importance of transportation technologies (which we will label as part of natural barriers to trade). In this paper, we innovate by adding the case of Canada which was similar to the US in terms of relative factor endowments and high overseas transport costs.Footnote 2 We start by identifying periods associated with various trading regimes between the three countries and then ask how these regimes influenced market integration.
The focus has long been on the US and Britain, which are clearly geographically very distant. The focus on two countries alone makes it difficult to investigate the relative significance of changes in the importance of distance (for example with improvements in transportation technology) and changes in policy (and other shocks to trade). Canada can help resolve this issue for multiple reasons. First, by virtue of being included in the British Empire, it enjoyed more favorable tariff rates on its grain. Second, it also enjoyed – unlike the US – an increasingly less restricted access to British markets prior to the 1850s. Third, Canada was a small open economy so that it might reflect a sensitivity to the international economy that the US might not, which would be reflected in higher price responsiveness to world conditions (i.e., price elasticity).Footnote 3 As such, because Canada shared similar transportation barriers as the US but generally smaller trade policy barriers, we can triangulate the relative contributions of transportation and policy barriers. Most importantly in the present context, Canada’s membership of the British Empire would eventually have eased Canadian integration with Britain and increasingly so as trade barriers against Canada were removed. Moreover, Canadians were geographically close to the US, but they became politically more distant over time. This also allows us to see the effects of policy barriers relative to transportation barriers.
We gather the available evidence on Canadian trade with the US and the UK and find that Canadian farmers exported appreciable amounts of wheat to the American colonies as well as the UK from the late eighteenth century. We then look for market integration using the price series for the US and the UK from Sharp and Weisdorf (Reference Sharp and Weisdorf2013), as well as new price series for the British colonies of Lower and Upper Canada from 1760 to 1858 (Geloso Reference Geloso2019). We first conduct variance analysis following Federico (Reference Federico2011, Reference Federico2012) and then measure market integration by estimating a cointegrated VAR model (CVAR), following Sharp and Weisdorf (Reference Sharp and Weisdorf2013). We find a Canada which is relatively well integrated into the American market prior to American independence, but increasingly integrated with the British market subsequently as there was an easing of trade barriers against Canada. Simply put, integration with the UK depended on the general movement toward lower tariffs after 1815. This suggests some benefit from membership in the Empire. However, it is a small benefit as the preferential access did not mean guaranteed access. Moreover, there is stronger integration between Canada and the US from 1760 to 1775 and after the Colonial Trade Act of 1831 when the grain trade between the two countries was progressively liberalized. This suggests that membership in the British Empire – when it meant that tariffs existed between Canada and the US – explains the divorce of Canadian and American markets.
The remainder of this paper proceeds as follows. Section “Canada in the North Atlantic wheat trade” describes the trade in wheat between Canada, the US, and the UK in order to set up the motivation behind our econometric strategy. Section “Data and variance analysis of wheat prices” explains the data and looks at the extent of market integration between the three countries using variance analysis. Section “Cointegration analysis” presents results from CVAR models, while section “Discussion and conclusion” discusses the findings.
Canada in the North Atlantic wheat trade
Trade between Canada and Britain
We start by considering how important the Canadian supply of wheat to Britain was in relation to that from the US. As Figures 1, 2 and 3 illustrate, from 1771 Canadian exports entered Britain almost every year. Sometimes they dominated the US exports. This was the case in 1822, for example, when Canadian wheat and flour comprised 54 percent of total imports as opposed to nine percent from the US. However, for most years, the US supply was the most important of the two sources.Footnote 4 The most important lesson from these graphs is that Canadian exports to Britain experienced large swings, similar to those from the US. This is also visible on a per capita basis as illustrated in Figure 3.
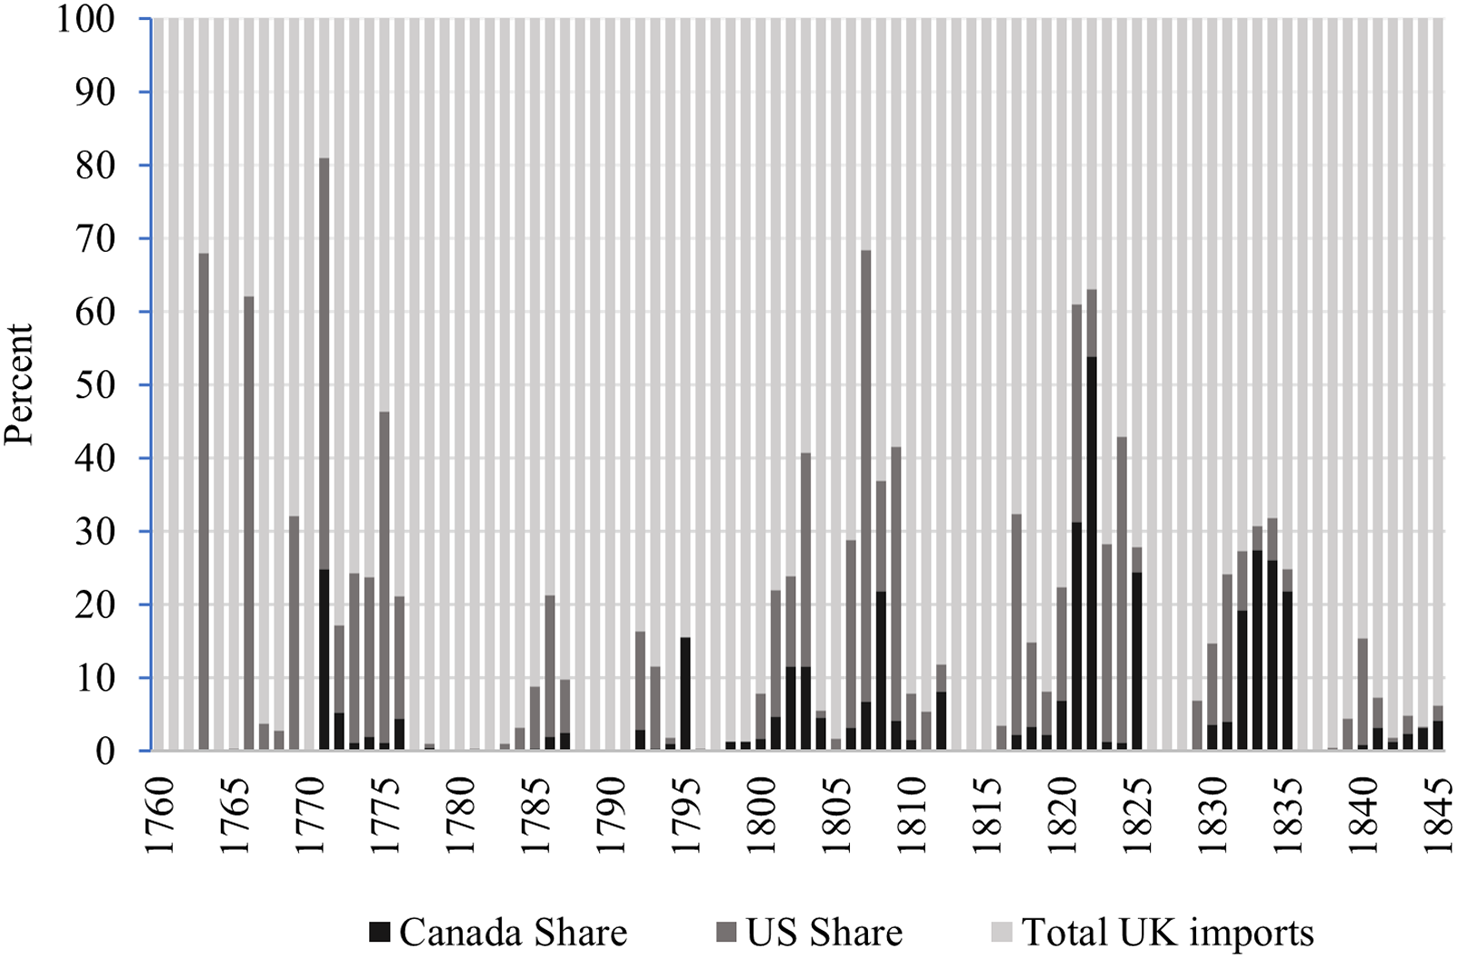
Figure 1. Share of Canadian and US of Total Wheat and Flour Imports into Britain.
Source: Sharp and Weisdorf (Reference Sharp and Weisdorf2013) from 1760 to 1839, Mitchell and Deane (Reference Mitchell and Deane1962: 98–101) from 1840 to 1870.
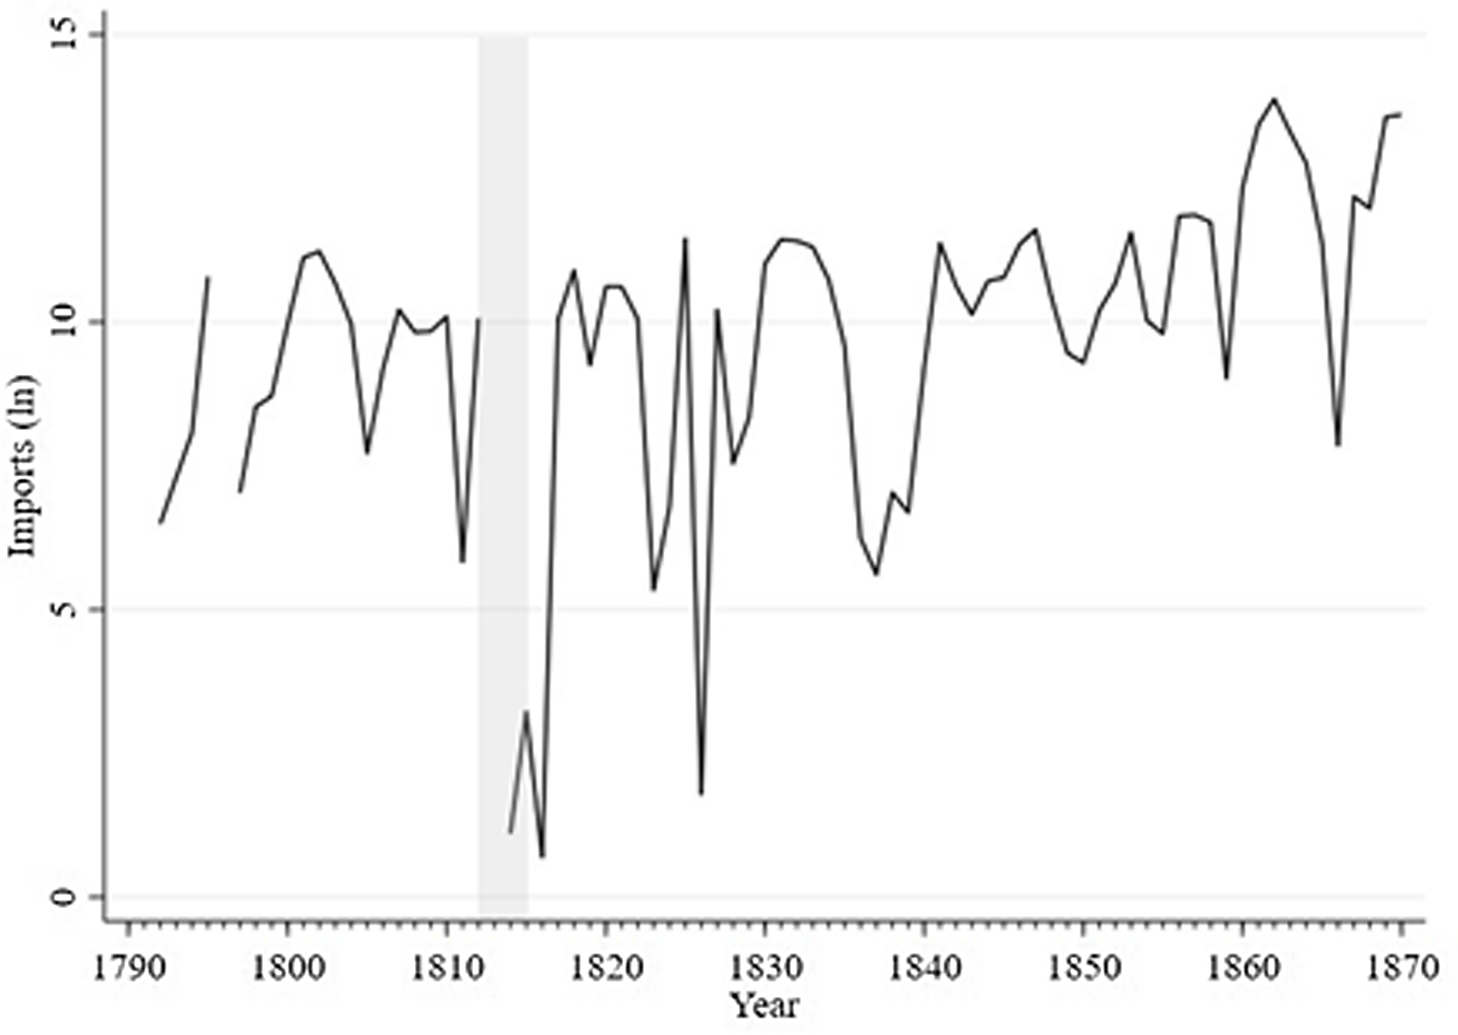
Figure 2. Imports of Wheat and Flour into Britain from British North America, Quarters, Log Scale.
Source: Sharp and Weisdorf (Reference Sharp and Weisdorf2013) from 1760 to 1839, Mitchell and Deane (Reference Mitchell and Deane1962: 98–101) from 1840 to 1870.
Note: The shaded area represents the period of the War of 1812 (to 1815).

Figure 3. Exports of Wheat and Flour from Lower and Upper Canada, in Bushels per Capita (A-axis) and Pounds Sterling per Capita (B-axis).
Source: Vallières and Desloges (Reference Vallières and Desloges2008); Geloso (Reference Geloso2019); Aubry (Reference Aubry1970); Public Archives of Canada (1874).
Note: The statistics on exports do not include the exports to the US after 1784. These estimates are difficult to obtain but discussions provided by McCalla (Reference McCalla1993) suggest that the depiction in this graph remains accurate.
Despite its inclusion within the Empire, Canada did not benefit from free access to metropolitan markets.Footnote 5 Since the beginning of the eighteenth century, the fur trade had gradually declined as a share of the overall economy (Altman Reference Altman1988; Geloso Reference Geloso2016) while the agricultural sector – and agricultural exports as a consequence (Ouellet Reference Ouellet1966; Aubry Reference Aubry1970) – grew in importance. After 1800, while grain and flour exports rarely rivaled timber and potash exports, they had eclipsed furs (Vallières and Desloges Reference Vallières and Desloges2008). Canadian historians, however, have long argued that wheat was never exported as much as it could have been (McCallum Reference McCallum1980; McInnis Reference McInnis1982) during the first half of the nineteenth century as wheat exports were more or less stagnant in spite of population growth (see Figure 2). That failure has frequently been laid at the foot of British trade policy.
This attribution of blame has to do with the nature of tariff policy toward Canadian grain. The Corn Laws permitted grain and flour imports only once prices exceeded a certain level. Footnote 6 The level at which Canadian grain and flour could enter the British market was set below that which applied to other nations.Footnote 7 In addition, there was a tariff that was modulated as a function of the British price (Marr and Paterson Reference Marr and Paterson1980: 88, 90).Footnote 8 The problem that this posed is that while the Canadian colonies received preferential access compared to other foreign sources, this was not “guaranteed”: price changes in Britain could lead to sudden closure of the British market (McInnis Reference McInnis1982: 36–41; Russell Reference Russell2012: 102). This caused important volatility in the ability to access the British market which some historians argue explains the stagnation – a volatility that can be observed in Figure 3 where we expressed exports on a per capita basis. Nevertheless, by the time of full liberalization in the 1840s when the US became the dominant supplier, Canada had been able to pull its punch on British markets. In fact, Canada did manage to export greater quantities after the end of the Corn Laws Hamelin and Roby (Reference Hamelin and Roby1971), Appendix 16).Footnote 9 Overall, it appears that Canadian wheat had a hard time breaking into British markets. However, this became easier after 1815 as Britain gradually liberalized entry.
Trade between Canada and the US
The Canadian colonies (Upper and Lower Canada) initially enjoyed virtual free trade with the US during the period from 1760 to 1775. This short episode is often overlooked because of its brevity and because Canada’s population was so small. However, as Figure 3 makes clear, the period was marked by high levels of exports per capita even if the absolute number of bushels was small given Canada’s small population. In that period, the Statistics of the Trade of Quebec for 1768 to 1775 suggest that 10 percent of the exports of wheat and flour were destined for British North America and another 75 percent was destined for the West Indies. The proportion for biscuits made from Canadian grain was much greater: 92 percent of exports were destined for British North America.Footnote 10 Very little of the exports of grain and its by-products went to Britain between 1760 and 1775. After the American Revolutionary War, the grain trade of Lower Canada with Britain gained in importance while it faltered with the US (Paquet and Wallot Reference Paquet and Wallot1967, Reference Paquet and Wallot1972). However, this coincided with the tightening of the Corn Laws which explains the pattern in Figure 3.
After American independence, the ability of Canadians to trade with Americans was subjected to numerous policy changes. While Quebec City had been designated a free port under the Navigation Acts (allowing the entry of foreign ships with foreign goods that did not transit through Britain), American ships were not permitted general entry until the 1820s (Marr and Paterson Reference Marr and Paterson1980, 124). Wartime events also made trade between them illegal in some key periods (1775–1795; 1807–1815). In 1822, the Canada Trade Act permitted the importation of grain and flour from the US, but duties applied and in 1828, it became possible to export flour made in Canada from American wheat to Britain on the same terms as flour made from Canadian wheat (Marr and Paterson Reference Marr and Paterson1980, 134). In 1831, there was further liberalization with the abolition of all duties on agricultural products entering British North America when the Colonial Trade Act was adopted (Easterbrook and Aitken Reference Easterbrook and Aitken1988, 283, 352). However, this liberalization was not reciprocated by the USFootnote 11 and there was a protectionist reversal in 1843 on the eve of the end of the Corn Laws.Footnote 12 It is also important to note that the 1831 liberalization also allowed American wheat to be milled in Canada and then exported to Britain on the same terms as Canadian produce (Geloso Reference Geloso2023).
The main takeaway here is that trade between Canada and the US was generally possible and important when legal barriers did not exist.
Relevance to econometric strategy
The takeaways from sections “Trade between Canada and Britain” and “Trade between Canada and the US” motivate our econometric strategy to assess whether natural barriers weighed more lightly than policy and war barriers. Indeed, Canadian markets should show signs of growing integration with Britain over time – especially after 1815 when Britain modestly eased entry for Canadian wheat on its markets. Note that this can be the case even with very low levels of trade, or potentially with no trade at all, since the threat of arbitrage (potentially through third countries) can cause prices to move together (see e.g., Lampe and Sharp Reference Lampe and Sharp2015).Footnote 13 Second, Canadian markets should show ebbs and flows in terms of integration with the US. At the start, Canada should exhibit relatively high integration that falls with American independence but picks back up with trade liberalization in the 1830s. If such integrating trends are found, they would match trends in trade policy changes. Indeed, the qualitative evidence in section “Trade between Canada and the US” suggests that episodes of freer trade between the British colonies and the US suggest that they could easily trade with each other in the absence of policy restrictions.
Third, Canadian markets should be more responsive to American prices than American prices to Canadian prices after the 1820s. This is because the Colonial Trade Act of 1831 was a unilateral trade liberalization for Canada. The US, by not reciprocating, would not have been heavily affected by Canadian prices. Moreover, Canadian demand for farm produce was relatively small compared to the size of the American such that even if liberalization had been multilateral, the effect on American prices would have been minimal. If such unidirectional integrating trends are found, it would be supportive of the claim for the predominant role of trade policy. Fourth, we should expect a greater influence of Canadian prices on British markets after the 1820s. This is because the Colonial Trade Act of 1831 also allowed American produce to transit through Canada and then be exported to British markets on the same terms as Canadian produce. As American produce transited through Canada because of this policy change, there would be an effect on UK prices of Canadian prices as American supply transited through Canada.
Data and variance analysis of wheat prices
Data
How did the above-identified episodes of protectionism and free trade impact on the level of market integration between Canada, the UK and the US? To answer this question, we turn to price information. Our data for the US and the UK are those used by Sharp and Weisdorf (Reference Sharp and Weisdorf2013).Footnote 14 The price data for Canada are assembled using a combination of recent (Geloso Reference Geloso2019; Geloso and Lindert Reference Geloso and Lindert2020) and old (Dechêne Reference Dechêne1994; Ouellet et al. Reference Ouellet, Hamelin and Chabot1982; McCalla Reference McCalla1993) price evidence regarding Québec City, Montreal and Central Ontario (for which we provide more details in Online Appendix A).Footnote 15 All prices have been converted to shillings and volumes have been converted to quarters. Figure 4 illustrates the arithmetic mean of prices of quarters of wheat by country between 1720 and 1858. As can be seen in Figure 4, prices in the UK were consistently higher than in Canada (with the exception of the episode during the Wars of 1775–1783 and 1812–1815 when Canada was invaded) and the US. However, Canada has similar prices as the US to 1775 which then diverge. Up to 1858, they hover between American and British prices.
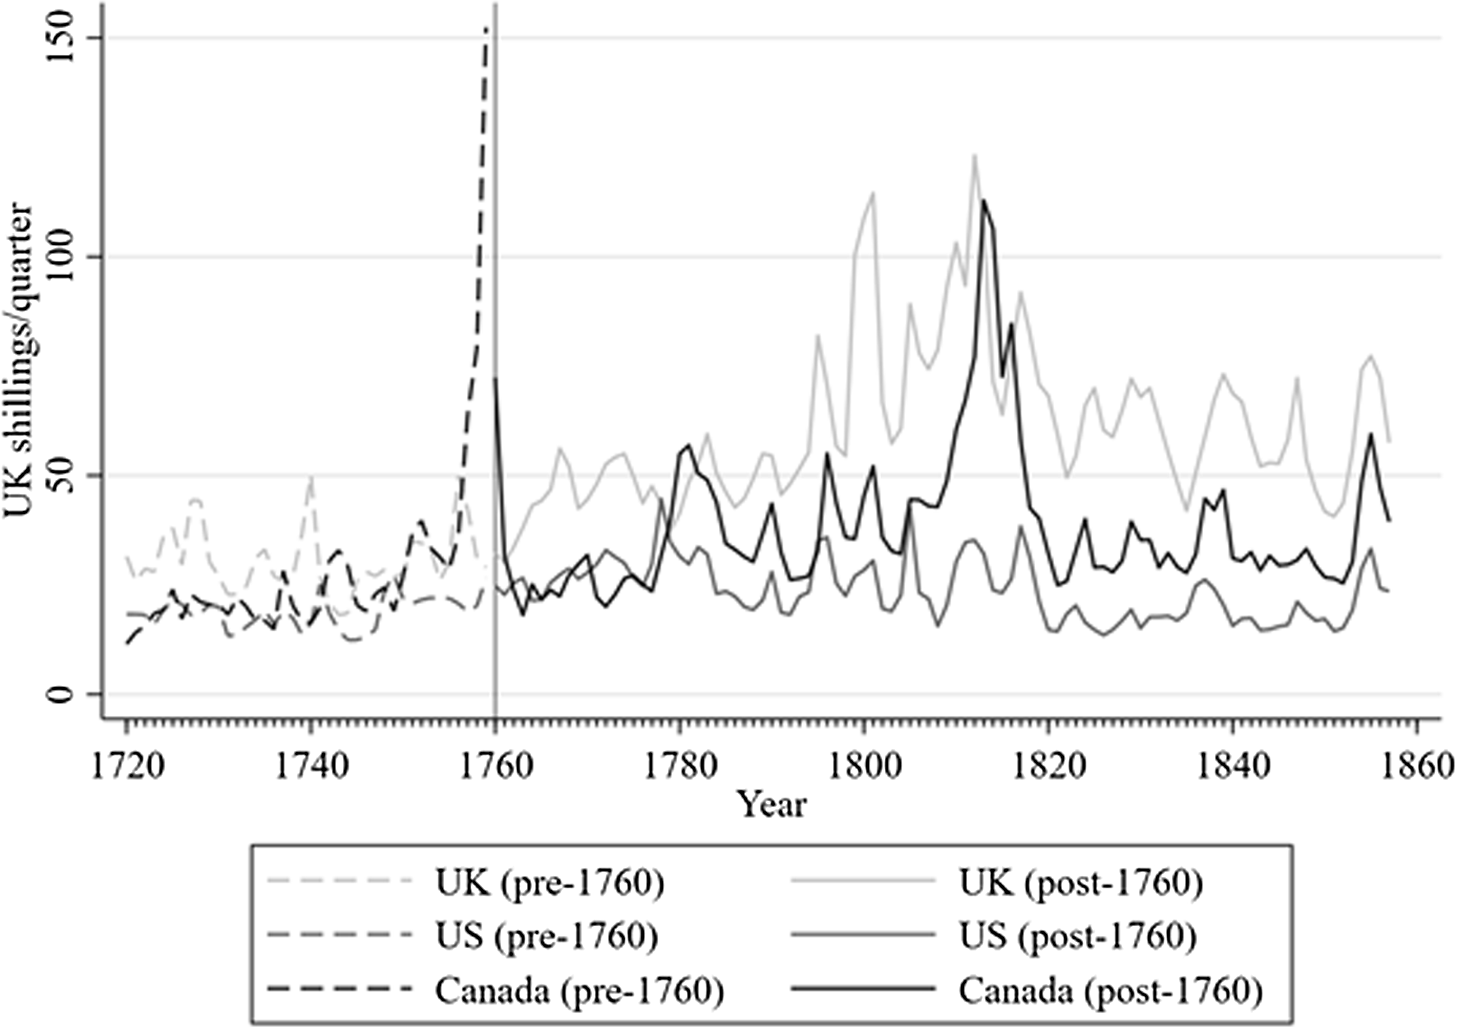
Figure 4. Average Prices per Quarter of Wheat for Canada, UK and US, 1720–1858.
Note: The graph illustrates the average prices. The dashed lines represent the period before 1760, while the solid line represents prices after 1760. In the analysis, we only make use of the data for after 1760. The sources for Canada are described in the appendix. For the US and the UK, see Sharp and Weisdorf (Reference Sharp and Weisdorf2013).
Our data is divided into two parts: one before and one after 1760. In our analysis, we concentrate on the period after the conquest of Quebec by the British Empire.Footnote 16 Therefore, the first part of Figure 4 (the dashed lines), serves only as a visual inspection of the price trends before 1760. We choose to start our analysis in 1760 for two main reasons. The first is that, before 1760, there is no unique exchange rate between the Canadian livre (the unit in which prices were reported) and the British shilling, thus making it more difficult to convert to a common unit. Footnote 17 Second, we can therefore concentrate on the period where parts of Canada came under British rule which minimizes the role of political differences.
We divide our analysis of market integration into two: a visual inspection of price variances and a more formal analysis using cointegration. For the variance analysis, we use prices for all included markets individually, to investigate the price variance both within countries across markets, and between countries. For that part of our analysis, we rely on the same markets for the UK and the US as Sharp and Weisdorf (Reference Sharp and Weisdorf2013), while for Canada we use data for all three aforementioned markets, that is, Montreal, Quebec City and Central Ontario.Footnote 18 Our maintained assumption is that greater variance indicates that markets are not well integrated. If markets were well integrated, prices would be closer together and thus we would observe less variance. This also implies that changes in variance can be taken to mean changes in integration of the different markets. For the cointegration analysis, we compute the average prices for the markets in the three countries. Cointegration analysis starts from the premise that each of the three markets can be summarized by a function that explains the prices observed. The prices on other markets are present in each function. If markets are integrated, this means that there will be a shared equilibrium. As such, any change in prices due to economic conditions on one market should end up affecting prices on other markets (in order to generate a return to a shared equilibrium). If markets are not well integrated, prices on one market should be independent of that on another market. Essentially, what the cointegration analysis does is assess how prices between markets respond to price changes in each other. In this part, we exclude Central Ontario from the Canadian average, because it has a shorter time series than the others (starting only in 1787).Footnote 19 In Online Appendix D, however, we demonstrate that including it makes little difference to the results post-1787. In Figure 4, the solid lines illustrate the three price series (expressed in shillings per quarter) used for the cointegration analysis, 1760 to 1858.
Variance analysis of market integration
Following Federico (Reference Federico2011) and Sharp and Weisdorf (Reference Sharp and Weisdorf2013), we proceed to perform a variance analysis and decompose total variance between the various markets in the UK, US and Canada as described above. Figure 5 thus illustrates total variance, as well as the residual variance, which is due to price dispersion within each country. Again, the reader should bear in mind that a larger variance is an indication of less integrated markets. The total variance is the entire area under the curves in Figure 5. Variance is low and stable from 1760 to 1780. Then there is a rising variance from 1780 to 1815 suggest disintegration during that period whereas a slowly falling variance thereafter suggest integration. This breakdown suggests that the period of political unity prior to the American revolutionary war was marked by integrated markets. The Napoleonic Wars, American independence and the tightening of the Corn Laws match the period of disintegration whereas the end of the wars, the easing of the Corn Laws for Canadian merchants and the Colonial Trade Act of 1831 matches with the mild integration after 1815.
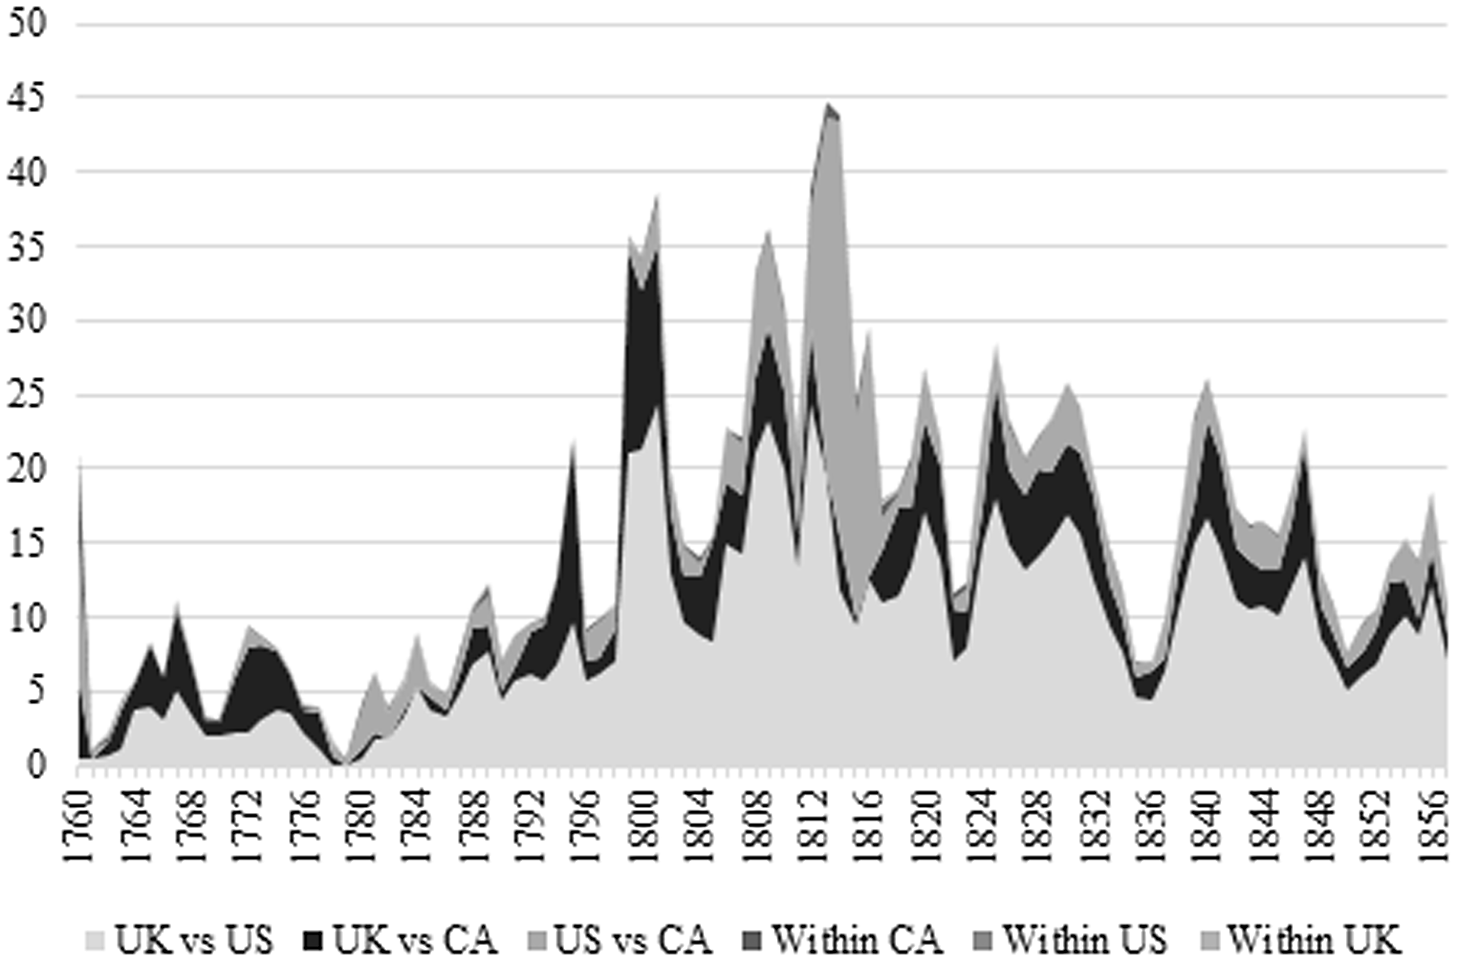
Figure 5. Price Variance 1760–1857.
Source: Author.
The variance across all markets can also be broken down by pair (or set) of markets in ways that are highly instructive. This is what Sharp and Weisdorf (Reference Sharp and Weisdorf2013) used when assessing US and UK market integration pre-1870. We find the same pattern of UK vs. US variance as them. However, the addition of Canada is illuminating. First, as noted above, most literature agrees that although the colony benefited from a preferential access, there was no guarantee of access to the British market (McInnis Reference McInnis1982: 36–41; Russell Reference Russell2012: 102). This is clearly confirmed by our results since the variance between Canada and the UK is highly volatile over the period. If access was guaranteed, the black portion of Figure 5 should be collapsing over time or remain stable. Second, the variance between Canada and the UK is far smaller than the variance between the US and the UK despite the fact that Canada and the US shared roughly similar natural barriers. Canadian merchants very often complained about the inability to overcome government barriers to the British market, while they seem to have been able to trade more easily within Canada (Paquet and Wallot Reference Paquet and Wallot2007; Geloso Reference Geloso2023). Simply put, Canadian grain dealers believed that the preferential tariffs gave them only minor advantage in accessing British markets relative to their American counterparts. However, even this minor advantage dramatically reduced the variance compared to the US vs. UK variance. As such, even if Canada was relatively poorly integrated with the UK for most of the period, a minor difference in policy seemed to matter heavily for market integration. Third, after 1780 and until 1831, the variance between the US and Canada is roughly the same size as the variance between the UK and Canada. Given the greater proximity between the US and Canada, this also points to the importance of policy-related barriers. Indeed, the period of free entry of American produce into Canada from 1831 to 1843 was marked by a reduction in the US to Canada variance. That the return of agricultural tariffs in 1843 coincides with the Canada and US variance reverting to previously observed levels only reinforces our contention that policy mattered more than commonly appreciated.
Cointegration analysis
Econometric model and pre-estimation analysis
In the second part of the analysis, we look for cointegrating relationships between the average prices. This idea builds on Cournot’s division of market integration into an equilibrium concept – the law of one price – and a rapid adjustment back to equilibrium after a shock (see also Barzel Reference Barzel2005 and Baffes Reference Baffes1991). As stated above, a cointegrating relationship implies that markets share an equilibrium which, in the present case, is the law of one price. If a price change on a given market, it will cause movements in prices on other markets. However, these movements will end once equilibrium is restored. We include a trend in the analysis to account for changes in transportation costs and the relative qualities of the wheat, which might vary. This trend allows us not to expect prices to be the same, only that they follow each other. This gives us the following model to estimate:
 $$\Delta {X_t} = \alpha \beta '{X_{t - 1}} + \Gamma \Delta {X_{t - 1}} + \beta {'_0}t + {\varepsilon _t}$$
where ${X_t} = \left( {{p_{us}},\;{p_{uk}},{p_{ca}}} \right)'$
,
${X_t} = \left( {{p_{us}},\;{p_{uk}},{p_{ca}}} \right)'$
, ${p_{us}}$
is the US average price,
${p_{us}}$
is the US average price, ${p_{uk}}$
is the UK average price and
${p_{uk}}$
is the UK average price and ${p_{ca}}$
is the Canadian average price all three in logs.
${p_{ca}}$
is the Canadian average price all three in logs. $t$
is the trend and
$t$
is the trend and ${\varepsilon _t}$
is the error term, which we will assume to be
${\varepsilon _t}$
is the error term, which we will assume to be $iid{N_p}\left( {0,\Omega } \right)$
throughout the analysis.
$iid{N_p}\left( {0,\Omega } \right)$
throughout the analysis.
Equation (1) assumes that that the $k = 3$
vectors in Xt are related through
$k = 3$
vectors in Xt are related through $r \lt k$
equilibrium relationships, that is, the cointegrating relationships, where
$r \lt k$
equilibrium relationships, that is, the cointegrating relationships, where $r$
determines the rank of the matrix
$r$
determines the rank of the matrix $\alpha \beta '$
. The parameters of interest for our analysis are in the two matrices,
$\alpha \beta '$
. The parameters of interest for our analysis are in the two matrices, $\beta '$
and
$\beta '$
and $\alpha $
. The
$\alpha $
. The $\beta '$
contains the long-run equilibrium parameters and
$\beta '$
contains the long-run equilibrium parameters and $\alpha $
contains the adjustment parameters, that is, showing how long it takes to return to equilibrium after a shock. Gamma,
$\alpha $
contains the adjustment parameters, that is, showing how long it takes to return to equilibrium after a shock. Gamma, ${\it \Gamma} $
, represents the short-run dynamics which we will ignore here. For our purposes, the changes over time of
${\it \Gamma} $
, represents the short-run dynamics which we will ignore here. For our purposes, the changes over time of $\beta '$
and
$\beta '$
and $\alpha $
are our main interests. The
$\alpha $
are our main interests. The $\alpha $
tells us how long it takes to revert to the long-run equilibrium. For example, if
$\alpha $
tells us how long it takes to revert to the long-run equilibrium. For example, if $\alpha $
is equal to –0.5 (the values can only be negative), it means that it will take two units of time (i.e., years) to return to the long-run equilibrium. The parameters in
$\alpha $
is equal to –0.5 (the values can only be negative), it means that it will take two units of time (i.e., years) to return to the long-run equilibrium. The parameters in $\beta '$
tell us how much of a change on a particular there will be from a price change on another example. Thus, for example, if
$\beta '$
tell us how much of a change on a particular there will be from a price change on another example. Thus, for example, if $\beta '$
is 0.5 and
$\beta '$
is 0.5 and $\alpha $
is –0.5, this means that a price change of 1 percent on another market will cause the price on a particular market to change by 0.5 percent and that this will take two years to take place. For market integration to take place,
$\alpha $
is –0.5, this means that a price change of 1 percent on another market will cause the price on a particular market to change by 0.5 percent and that this will take two years to take place. For market integration to take place, $\alpha $
should move away downward from zero while
$\alpha $
should move away downward from zero while $\beta '$
should move away upward from zero.
$\beta '$
should move away upward from zero.
Before we begin looking for cointegrating relationships between the prices, we investigate whether the series should be divided into shorter periods, in accordance with our data and historical events. This allows us to see if $\alpha $
and
$\alpha $
and $\beta '$
change over time. This is important if we believe that these are not constant throughout the entire period. An inspection of Figure 4 reveals that there are several breaks in the data, which gives us a first indication of the presence of structural changes (i.e.,
$\beta '$
change over time. This is important if we believe that these are not constant throughout the entire period. An inspection of Figure 4 reveals that there are several breaks in the data, which gives us a first indication of the presence of structural changes (i.e., $\alpha $
and
$\alpha $
and $\beta '$
changed over time).
$\beta '$
changed over time).
As a first step, we recursively estimate a simple unrestricted VAR model, to look for changes in the estimated parameters. Footnote 20 We do this exercise both backward, keeping the end year fixed, and forward, keeping the start year fixed. From the recursive graphs, it appears that we should divide our data into three periods: 1760–1783, 1783–1822, and 1822–1857. Footnote 21 The recursive graphs can be seen in Online Appendix B, Figures B1 and B2.
The first break, 1783, is consistent with the timing of American independence and is thus a natural break point, as we observe some important institutional changes. As mentioned in section “Canada in the North Atlantic wheat trade,” 1822 marks the start of some important events in market exchanges between the three countries. On the one hand, a period began where Britain eased trade with Canada and on the other a Canadian law was passed imposing a duty on grain imports from the US. It is important to note here that, with the abolition of the Corn Laws in 1846, an era of greater market integration began and a break at that time is thus likely. However, longer time series would have been needed to show this picture in our analysis. As a further control we perform a Wald test for structural breaks with known break dates. The results can be seen in Table B1, Online Appendix and shows strong evidence for the presence of a structural break both in 1783 and 1822.
Having identified the breaks, we can proceed by identifying the number of lags, normality of the error term, and the cointegrating rank in equation (1) for each of the subperiods. The results of the pre-estimation tests can be seen in Online Appendix B and indicate that for the first two periods, 1760–1783 and 1784–1822, one lag is enough to avoid problems with autocorrelation while for the last period, 1822–1857, we need two lags. Tests for normality reveal no issues for all three periods.
Before proceeding with the cointegration analysis, we test the rank for each of the three periods, to know how many cointegrating relationships we are looking for. Here, we rely on two results: (1) the trace statistic along with the maximum-eigenvalue statistic and the information criteria, and (2) the recursively calculated trace statistic for each of the three subperiods. Both can be seen in Online Appendix B, Figures B6–B11 and show that the first period has rank 1 while the other two have rank 2. For all three periods, we proceed to look for cointegrating relationships in the data with the only initial restriction being the established rank.
CVAR results
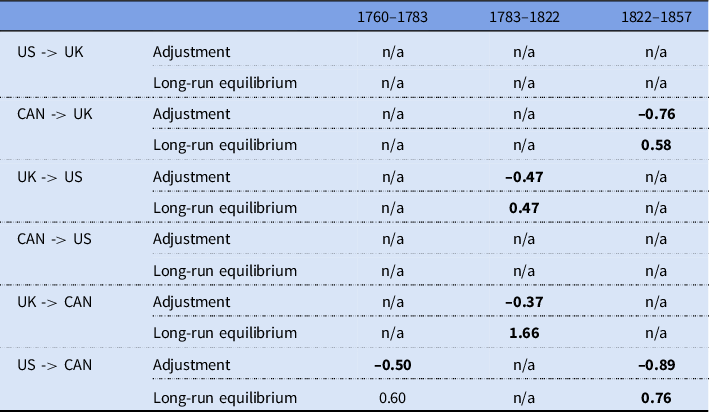
For the sake of simplicity, we start with Table 1, which presents a summary of our findings. Each column is one of our three time periods, and each row provides the parameters we estimated, both the $\alpha $
coefficients, which tell us the speed of adjustment to equilibrium, and the
$\alpha $
coefficients, which tell us the speed of adjustment to equilibrium, and the $\beta '$
coefficients, which tell us the nature of the long-run equilibrium. Note that there are six potential causal relationships between the prices as listed in the first column. If cointegration is identified, we provide the relevant coefficients, otherwise “n/a” is recorded.
$\beta '$
coefficients, which tell us the nature of the long-run equilibrium. Note that there are six potential causal relationships between the prices as listed in the first column. If cointegration is identified, we provide the relevant coefficients, otherwise “n/a” is recorded.
Table 1. Summary of the CVAR results, giving estimated adjustment (α) and long-run equilibrium (β') parameters
To add some flesh to this, we proceed to provide the cointegrating relationships as equations. For the reader unfamiliar with the method, this can however be skipped in favor of the summary above and at the end of this section. A full discussion of the results is given in section “Discussion and Conclusion.”Footnote 22 For the period 1760–1783, we find the following cointegrating relationship:
 $$\left[ {\matrix{ {\Delta {p_{u{k_t}}}} \cr {\Delta {p_{u{s_t}}}} \cr {\Delta {p_{c{a_t}}}} \cr } } \right] = \left[ {\matrix{ 0 \cr 0 \cr { \bf - 0.499} \cr } } \right]\left[ {{{\left\{ {{p_{ca}} - 0.597{p_{us}} - \bf 0.039} \right\}}_{t - 1}}} \right] + \ldots $$
Equation (2) shows the results, with bold typefaces indicating coefficients significantly different from zero at the 5 percent level. The model is very well specified, and the imposed restrictions can be accepted with a high $p$
-value of
$p$
-value of $83.71{\rm{\;percent}}$
. The results show that the Canadian price adjusts to the US price by
$83.71{\rm{\;percent}}$
. The results show that the Canadian price adjusts to the US price by $0.60{\rm{\;percent}}$
given a
$0.60{\rm{\;percent}}$
given a $1{\rm{\;percent}}$
change in the US price, even though the parameter is not significantly different from zero. It is, however, important to recall that to be fully integrated, a 1 percent change in the US price should be followed by a 1 percent change in the Canadian price. Testing the hypothesis that the parameter is not significantly different from 1 is accepted, suggesting (weak) market integration. The adjustment parameter to
$1{\rm{\;percent}}$
change in the US price, even though the parameter is not significantly different from zero. It is, however, important to recall that to be fully integrated, a 1 percent change in the US price should be followed by a 1 percent change in the Canadian price. Testing the hypothesis that the parameter is not significantly different from 1 is accepted, suggesting (weak) market integration. The adjustment parameter to ${p_{ca}}$
, suggests that it took about two periods for the system to return to equilibrium after a shock.
Footnote 23
The conclusion we can make for the first period, consistent with the finding in Figure 5, is that before American independence the US and Canada were somewhat integrated, and the Canadian prices were adjusting to the US prices. The UK was not integrated with any of the other markets in this period, given that the adjustment parameter for the UK is zero.
${p_{ca}}$
, suggests that it took about two periods for the system to return to equilibrium after a shock.
Footnote 23
The conclusion we can make for the first period, consistent with the finding in Figure 5, is that before American independence the US and Canada were somewhat integrated, and the Canadian prices were adjusting to the US prices. The UK was not integrated with any of the other markets in this period, given that the adjustment parameter for the UK is zero.
For the second period, 1783–1822, we find the following two cointegrating relationships:
 $$\left[ {\matrix{ {\Delta {p_{u{k_t}}}} \cr {\Delta {p_{u{s_t}}}} \cr {\Delta {p_{c{a_t}}}} \cr } } \right] = \left[ {\matrix{ 0 &0 \cr { \bf - 0.474} &0 \cr 0 &{ \bf - 0.371} \cr } } \right]\left[ {\matrix{ {{{\left\{ {{p_{us}} {\bf - 0.466}{p_{uk}}} \right\}}_{t - 1}}} \cr {{{\left\{ {{p_{ca}} {\bf - 1.656}{p_{uk}}} \right\}}_{t - 1}}} \cr } } \right] + \ldots $$
The model in equation (3) is again well specified and the imposed restrictions can be accepted with a $p$
-value of
$p$
-value of $73.69{\rm{\;percent}}$
. For this period, both the US prices and the Canadian prices are driven by the UK prices. In equation (3), the trend has been restricted to zero, given than the estimated coefficients were insignificant. The US price adjusts by
$73.69{\rm{\;percent}}$
. For this period, both the US prices and the Canadian prices are driven by the UK prices. In equation (3), the trend has been restricted to zero, given than the estimated coefficients were insignificant. The US price adjusts by $0.46{\rm{\;percent}}$
to a
$0.46{\rm{\;percent}}$
to a $1{\rm{\;percent}}$
change in the UK price while the Canadian prices adjust with more than
$1{\rm{\;percent}}$
change in the UK price while the Canadian prices adjust with more than $1{\rm{\;percent}}$
to a
$1{\rm{\;percent}}$
to a $1{\rm{\;percent}}$
change in the UK price. However, testing the hypothesis that the parameters are equal to 1, thus indicating full market integration, shows that both are not significantly different from 1 at the 1 percent significance level. When it comes to the adjustment parameters, the UK prices drive the others, and both the US and the Canadian prices adjust slowly after a shock, taking more than two periods to return to equilibrium. This is the time when transatlantic price gaps were high (see Figure 4) suggesting a lack of integration, but on the other hand it was also a period when Britain was largely shut off from continental markets. In such circumstances, it is arguably not surprising that periods of high prices in Britain translated into increased North American supplies and higher prices there too, as Sharp and Weisdorf (Reference Sharp and Weisdorf2013) argue.Footnote
24
$1{\rm{\;percent}}$
change in the UK price. However, testing the hypothesis that the parameters are equal to 1, thus indicating full market integration, shows that both are not significantly different from 1 at the 1 percent significance level. When it comes to the adjustment parameters, the UK prices drive the others, and both the US and the Canadian prices adjust slowly after a shock, taking more than two periods to return to equilibrium. This is the time when transatlantic price gaps were high (see Figure 4) suggesting a lack of integration, but on the other hand it was also a period when Britain was largely shut off from continental markets. In such circumstances, it is arguably not surprising that periods of high prices in Britain translated into increased North American supplies and higher prices there too, as Sharp and Weisdorf (Reference Sharp and Weisdorf2013) argue.Footnote
24
For the last period, 1822 to 1858, equation (4) shows the following results:
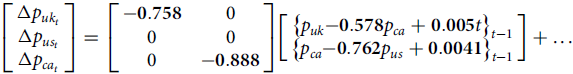 $$\left[ {\matrix{ {\Delta {p_{u{k_t}}}} \cr {\Delta {p_{u{s_t}}}} \cr {\Delta {p_{c{a_t}}}} \cr } } \right] = \left[ {\matrix{ { \bf - 0.758} &0 \cr 0 &0 \cr 0 &{ \bf - 0.888} \cr } } \right]\left[ {\matrix{ {{{\left\{ {{p_{uk}} {\bf - 0.578}{p_{ca}} + {\bf 0.005}t} \right\}}_{t - 1}}} \cr {{{\left\{ {{p_{ca}} {\bf - 0.762}{p_{us}} + {\bf 0.0041}} \right\}}_{t - 1}}} \cr } } \right] + \ldots $$
The imposed restrictions can be accepted with a $p$
-value of
$p$
-value of $8.15{\rm{\;\;percent}}$
, and all estimated coefficients are significantly different from zero. The UK price adjusts with
$8.15{\rm{\;\;percent}}$
, and all estimated coefficients are significantly different from zero. The UK price adjusts with $0.58{\rm{\;\;percent}}$
to a
$0.58{\rm{\;\;percent}}$
to a $1{\rm{\;percent}}$
change in the Canadian price while the Canadian prices are driven by the US prices, adjusting
$1{\rm{\;percent}}$
change in the Canadian price while the Canadian prices are driven by the US prices, adjusting $0.76{\rm{\;\;percent}}$
to a
$0.76{\rm{\;\;percent}}$
to a $1{\rm{\;percent}}$
change in the US price. As for equation (3), testing the hypothesis of the parameters in
$1{\rm{\;percent}}$
change in the US price. As for equation (3), testing the hypothesis of the parameters in $\beta '$
being equal to 1, can again be accepted at the
$\beta '$
being equal to 1, can again be accepted at the $1{\rm{\;percent\;}}$
significance level. In the last periods, prices thus run from the US to Canada and from Canada to the UK. The adjustment parameters are highly significant and close to 1, indicating a quite fast return to equilibrium after a shock, also showing that markets are more integrated in the last period. This may appear to be counterintuitive given that Canada was a small open economy. But one should bear in mind two important elements discussed in section “Canada in the North Atlantic wheat trade.” First, after 1822, American wheat could transit through Canada to Britain if it was converted into flour in Canada. This would have meant that a large supply became potentially available to British markets. Second, with full liberalization in 1846, British prices would have been more responsive to changes in market conditions in Canada.
$1{\rm{\;percent\;}}$
significance level. In the last periods, prices thus run from the US to Canada and from Canada to the UK. The adjustment parameters are highly significant and close to 1, indicating a quite fast return to equilibrium after a shock, also showing that markets are more integrated in the last period. This may appear to be counterintuitive given that Canada was a small open economy. But one should bear in mind two important elements discussed in section “Canada in the North Atlantic wheat trade.” First, after 1822, American wheat could transit through Canada to Britain if it was converted into flour in Canada. This would have meant that a large supply became potentially available to British markets. Second, with full liberalization in 1846, British prices would have been more responsive to changes in market conditions in Canada.
Finally, Figure 6 provides a handy summary of our results along a stylized timeline of market integration, with the main events marked.

Figure 6. Stylized Depiction of Market Integration from 1760 to 1858.
Recursive analysis
As a robustness check to the chosen periods, we perform a recursive analysis of the three identified cointegrating relationships. A recursive analysis takes as its starting point a small sample, then extends it by one period at a time, and allows us to estimate whether the parameter estimates change as more years are covered. If they do, this is a violation of the assumptions of the model (which assumes that the parameters are constant) and suggests that we should split the sample. Thus, in order to establish whether the end point in each period is correctly chosen, we use a forward recursive analysis whereas to establish whether the start points are correctly chosen, we perform a backward recursive analysis. Whenever there is an evident shift in the level of the parameters, or the p-values, in the recursive graphs, it is an indication that the analysis, using the specific restrictions, should end at that point. All the recursive graphs can be seen in Online Appendix C, Figures C1–C4. For the first period, 1760–1783, we need to establish whether the end point is correctly chosen, and thus we perform a forward recursive analysis, using the restrictions imposed in equation (2). From Figure C1, Online Appendix we can conclude that there is a change during the 1780s in the estimated coefficient, and thus the first break point seems plausible. For the second period, 1783–1822, we need both to look at the start point and the end point. Figure C2, Online Appendix shows the forward recursively estimated coefficients, where it clearly appears that something changes around 1822 with the p-value, while also the coefficients show a change between 1815 and 1822. Figure C3, Online Appendix shows the backward recursively estimated coefficients, and it is again clear that both the coefficients and the p-values change around 1883. Finally, for the last period, 1822–1857, we need to look at the choice of the start point in 1822, and we thus perform a backward recursive analysis. Figure C4, Online Appendix shows the result of the backward recursive analysis, and it appears again likely that there is a change around 1822.
Robustness check
In addition to the above analysis, we also used a different set of periods as a robustness check and to compare our results to those of Sharp and Weisdorf (Reference Sharp and Weisdorf2013).Footnote
25
First, we repeated the analysis from section “CVAR results” using the period 1720–1799 only for the UK and the US using our average prices.Footnote
26
We found signs of an $\alpha $
parameter that suggests that markets responded to each. This echoed the results of Sharp and Weisdorf (Reference Sharp and Weisdorf2013) that indicated market integration between the UK and the US.
$\alpha $
parameter that suggests that markets responded to each. This echoed the results of Sharp and Weisdorf (Reference Sharp and Weisdorf2013) that indicated market integration between the UK and the US.
At first glance, this conclusion might seem in contrast to our main results. Indeed, we found that the US and the UK are not integrated in the period 1760–1783. However, in our main results we did find market integration between the UK and the US in the second period (1783 to 1822). Furthermore, from an inspection of recursive graphs and smaller subperiods for the UK and the US it appears that market integration is largely driven by prices in the period before 1760 and after American independence. Our results are, therefore, consistent with the findings of Sharp and Weisdorf (Reference Sharp and Weisdorf2013).
Second, we added the Canadian prices for the same period, 1720–1799. Integration between the UK and US markets is unaffected by this inclusion. However, there is weak evidence of the Canadian market being affected by the US market. This is reassuring. First, Canada was largely under French rule prior to 1760. Finding integration in the presence of political fractioning would have raised red flags in terms of the economic validity of our results. In fact, this is consistent with our main analysis and indicates that institutional barriers to trade (i.e., trade barriers between French colonies and British colonies in this case) mattered.
Finally, we look at market integration between Canada and the US and Canada and the UK respectively for the period before and after Canada became part of the British Empire. This also indicates that the Canadian market was not well integrated with the US market, and even less with the UK market, before it became part of the Empire. Afterward, the results suggest that the Canadian market was more integrated with both the US and UK markets. The same conclusions as above can be drawn from this.
Discussion and conclusion
Both the variance and cointegration analyses clearly point to distinct periods with different levels of market integration. These different periods seem to be associated with different policy regimes or exogenous shocks in the form of war. Indeed, the changes in variance often coincided with war-related events of trade policy changes. The breakdown of time windows in the cointegration analysis matched the turning points in variance. Finally, the evolution of the adjustment parameters matches these events (i.e., they show signs of less/more integration in wartime/peacetime and in period of more/less protectionist policies). We break our results into two categories of implications. The first is that wars were important disrupters of market integration. The second is that natural trade barriers were far less important than trade policy barriers.
The importance of wars is visible immediately from our first period in the cointegration analysis. For the period between the conquest of Quebec in 1760 and US independence in 1783, the Canadian markets were not that well integrated with either the US or the UK markets. This result is unsurprising. The Conquest of 1760 imposed considerable destruction upon Quebec and constituted a major shock that took some years to recuperate from.Footnote 27 When trade resumed in earnest, there was only a short amount of time before the Revolutionary War would start. However, the variance analysis for this period shows large variance between both Canada and the UK and Canada and the US, while the cointegration analysis shows that Canada was more integrated with the US than with the UK, which seems not to be integrated with either Canada or the US during this period. This is consistent with trade volumes in Canadian grain that went in great quantities to the American colonies prior to Independence.
Thus, our finding of some tentative evidence of market integration between the US and Canada in the early period is quite telling given the two shocks of two significant wars. The fact that we do not find evidence for integration of the British market in the period 1760–1783 can be explained by two events. First, the British started to become net importers of wheat only during the 1770s with the onset of the industrial revolution combined with rapid population growth (Sharp Reference Sharp2010). Therefore, for much of the first period, the UK did not import large amounts of wheat, thus making it less likely for markets to integrate. Second, the American War of Independence from 1775 to 1783 brought several actions aimed at avoiding/prohibiting the export of wheat from the US.
The subsequent period sees the UK as the main driver of wheat prices and both the US market and the Canadian market integrate with the UK from 1783 to 1822. The grain trade of Lower Canada with Britain gained in importance after American independence, explaining why we find evidence for market integration in the cointegration analysis. This is, again, unsurprising given the role that the French Wars played for grain prices. As Marr and Paterson (Reference Marr and Paterson1980: 90) point out: “Prior to 1815, the price of wheat in Great Britain was sufficiently high that the Corn Laws seldom either taxed or excluded British North American wheat from the British market.” The relationship in that period suggest that the wars had the paradoxical effect of making the protectionist barriers less relevant even though the wars made the Atlantic trade more perilous. That the return to peace – which marks our last period from 1822 to 1858–is associated with greater integration only further highlights the disruptive nature of wars to the process of market integration.
Most importantly, our results suggest that natural trade barriers were of minimal importance. Consider our finding that the US and UK variance is twice that of the Canada and UK variance. That large difference could either be caused by differences in transport costs or differences in trade policy. We believe it is possible to rule out the former. While the portions of Canada that were deeper inland faced higher transportation costs that limited their access to the British market, the areas along the Saint-Lawrence River and on the Atlantic faced minimal transport costs.Footnote 28 Transportation costs between the East Coast of the US or Canada and Great Britain were similar and slightly favorable. For example, Quebec City and Halifax (House of Lords 1851: 123; Quebec Gazette May 7, 1847; Quebec Gazette, March 8, 1847; Quebec Gazette, April 24, 1844) had freight rates in the 1840s that were either below or similar to those of New York (Anonymous 1847: 388).Footnote 29 Other cities like Montreal (Quebec Gazette, September 30, 1846) had slightly higher freight rates than New York (4.5 to 4.75 shillings in 1846 for Montreal versus 2 to 2.25 for New York) because they were deeper inland. However, these other cities had a strong cost advantage from the canals and the Saint-Lawrence River. As such, shipping a barrel of flour from Ohio to Montreal costs 2.75 shillings compared to 4.5 shillings for shipping the same barrel to New York (House of Lords 1851: 122). When the cost of shipping to Liverpool is included for the late 1840s (2.5 shillings from New York and 5.08 shillings from Montreal), the difference between both cities is trivial (a total cost of 7.25 shillings versus 7.83 shillings per barrel). These transport costs represented less than 9 percent of the British price between 1840 and 1845. This means that the difference of shipping from either Montreal or New York amounted to half of a shilling or roughly 1 percent of the British price.Footnote 30 This leaves room for trade policy to have a large role.
Indeed, British prices for wheat in the 1820s onward were low enough that Canadian wheat had to be imposed the higher duty of 5 shillings per quarter. This is nearly twice as much as the transportation costs, but it is less than a third of the duty that American wheat would have faced to enter the British market (Sharp Reference Sharp2010: 80). The duty is a far stronger candidate to explain our variance-related results. Moreover, readers should bear in mind our cointegration analysis results that suggest that further liberalization led to even greater integration between Canada and the UK. Indeed, this is the period where we find that the Canadian price drives the UK prices. As such, when Canada enjoyed preferential access to an increasingly greater degree than the US, the integration with Britain was accelerated.Footnote 31
Further augmenting this point about the strong relative importance of trade policy are our results regarding the US and Canada. In the cointegration analysis, from 1822 to 1858, we found that the US price drives the Canadian prices. This is the period of gradual liberalization toward the US even though this was unilateral. Unilateral liberalization meant that US suppliers could enter the Canadian market but not the opposite so that price changes in Canada should have had limited effects on US markets – something made truer by the fact that the Canadian market was small relative to the US market. As such our finding that US prices affect Canadian prices but not the other way around is unsurprising. However, what is surprising is that this means that trade policy was the main barrier to market integration – not natural barriers. The coincidence of Canada–US market integration with more liberal trade policy 1760–1783 and 1822–1858 further points to the importance of trade policy for market integration.
Thus, while there was a role for natural trade barriers especially for places deeper in the North American hinterland, we are forced to consider that the first era of globalization could have occurred earlier had it not been for institutional trade barriers. Market integration between the US and Canada was similarly limited by institutional barriers to trade. Thus, the well-known globalization in the second half of the nineteenth century could have begun earlier, in the eighteenth century, although certainly to a more limited extent given the more limited technology of the time.
Supplementary material
To view supplementary material for this article, please visit https://doi.org/10.1017/ssh.2023.36
Acknowledgments
Thank you to participants at conferences for helpful suggestions and comments and to Martin Lundrup Ingerslev for conscientious research assistance. Geloso wishes to acknowledge the helpful support of Delmain Pale and Dry XO.


 Open access